TeamCity
Qodana is available in TeamCity as the Qodana build runner. To start using it, these prerequisites need to be met:
You use TeamCity as a build server for your project. If not, learn how to do it in TeamCity documentation.
Your project language is included in the list of fully supported technologies.
If you run your own TeamCity agents using Docker images of Qodana, make sure that Docker is installed on the agent machines and accessible to the users TeamCity is running under. TeamCity agents hosted by JetBrains already meet this condition.
Qodana Cloud
Qodana uses a project token generated by Qodana Cloud. This token is required for the paid Qodana linters and optional for use with the Community linters. You can see these sections to learn how to generate the project token in the Qodana Cloud UI:
The project setup section explains how to generate a project token when first working with Qodana Cloud.
The Manage a project section explains how to create a project token within an existing Qodana Cloud organization.
Basic configuration
In the TeamCity UI, navigate to the configuration page of a build where you would like to run Qodana.
On the page, click the button.
On the page that opens, select the runner.
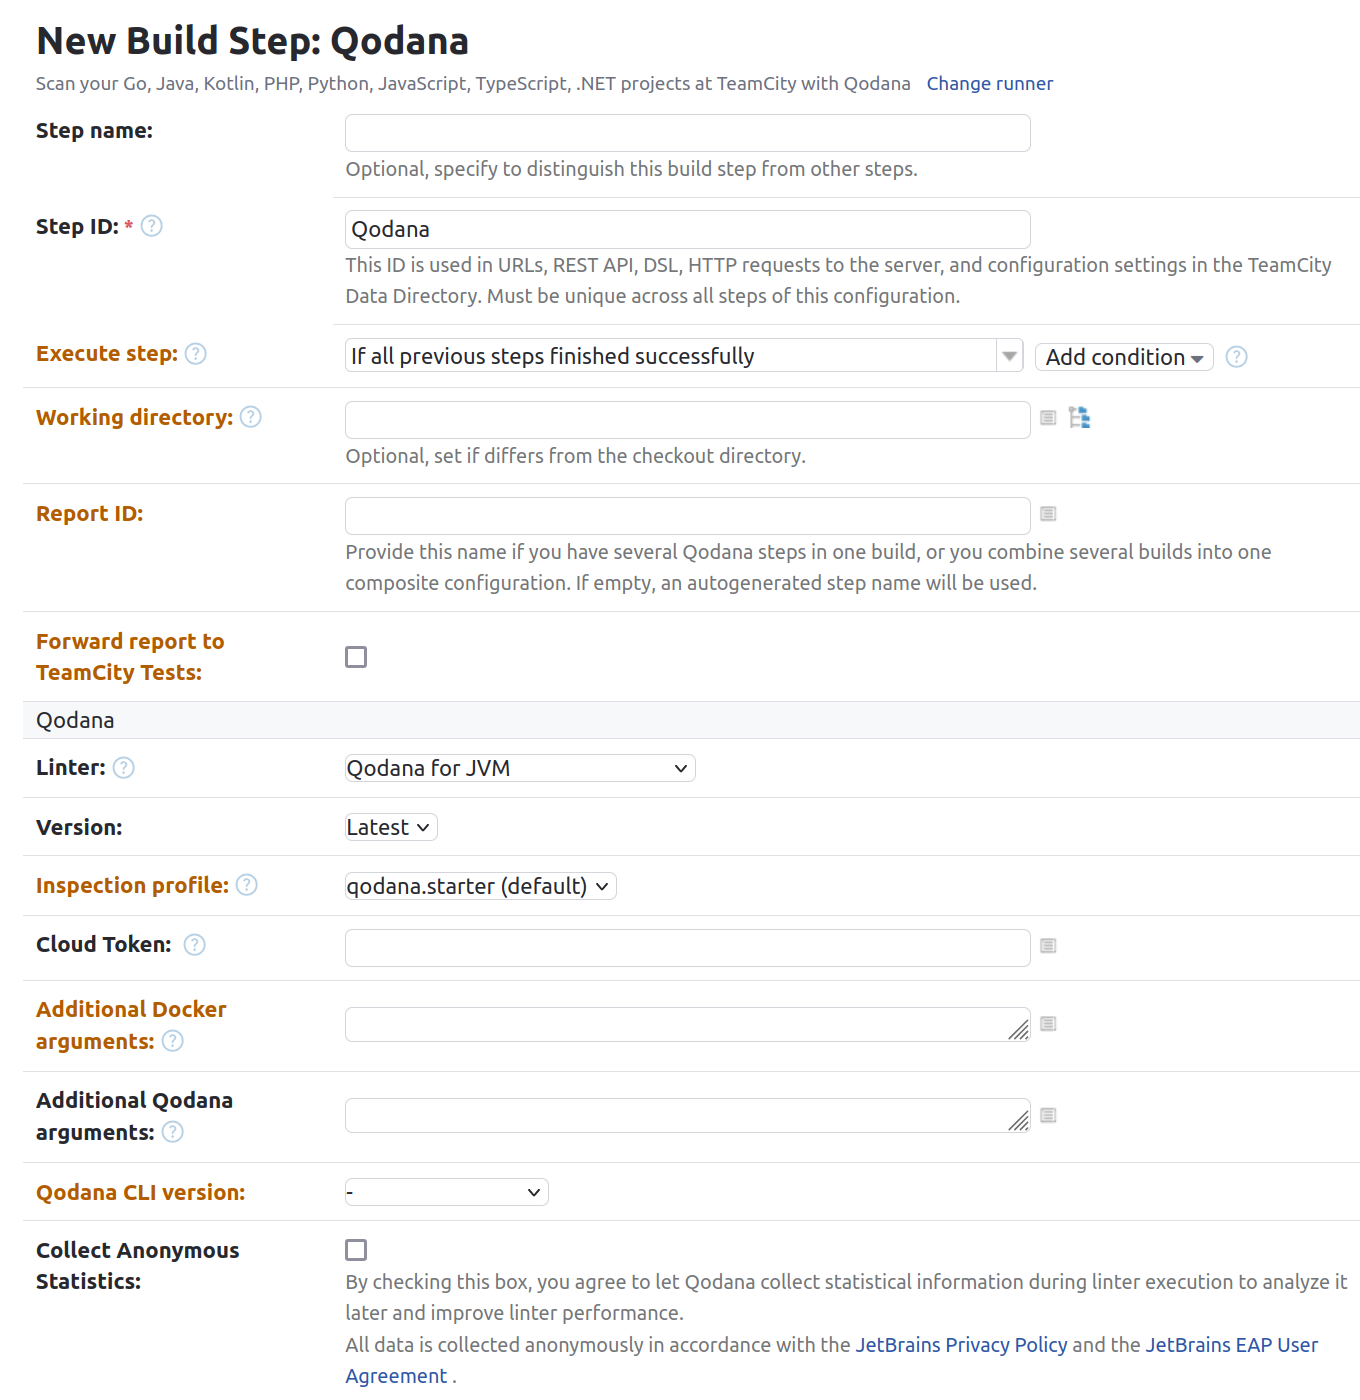
On the page, click and configure the runner:
uniquely identifies this step among other build steps.
uniquely identifies this step among other build steps.
configures the build condition that will trigger this build step.
sets the directory for the build process, see the TeamCity documentation for details. You can leave this field empty if the
Checkout directoryparameter is specified on the tab.uniquely identifies the report to let you distinguish between multiple reports when several analysis steps are configured within a single build.
The checkbox configures Qodana report availability in the Test tab of the TeamCity UI. Using this option, you can view codebase problems along with other problems detected.
configures the Qodana linter.
Here, specify the linter that you would like to run.
is by default set to
Latest.defines an inspection profile:
qodana.starter (default)is one of the default profiles.Profile namelets you specify a profile, see the Existing Qodana profiles section for details.Profile pathlets you specify the path to your custom profile. To use this option, make sure that you also configure the custom profile in theqodana.yamlfile.
configures a project token generated in Qodana Cloud.
configure the arguments accepted by a Docker image, see the Configuration options section for details.
let you extend the default Qodana functionality, see the Types of options section for details.
lets you specify the Qodana CLI version that you would like to use.

Click the button.
Quality gate and baseline
Using the Additional Qodana arguments field of the Qodana runner configuration, you can configure the quality gate and baseline features:
--fail-threshold <number>option for configuring a quality gate--baseline <path/to/qodana.sarif.json>option for configuring a baseline
To configure both options, in the Additional Qodana arguments field separate them using a space character:
Analyze pull requests and specific branches
Information about configuring TeamCity for analyzing pull and merge requests is available on the TeamCity documentation portal.
To learn how to analyze specific branches, see the Trigger Settings section of the TeamCity documentation.
Add a configuration script
Custom profile configuration for Qodana linters is stored in the qodana.yaml file. When using a CI system, you need to put this file to the working directory manually. Alternatively, you can write a script that will do it for you.
In the TeamCity UI, navigate to the configuration page of a build where you would like to run Qodana.
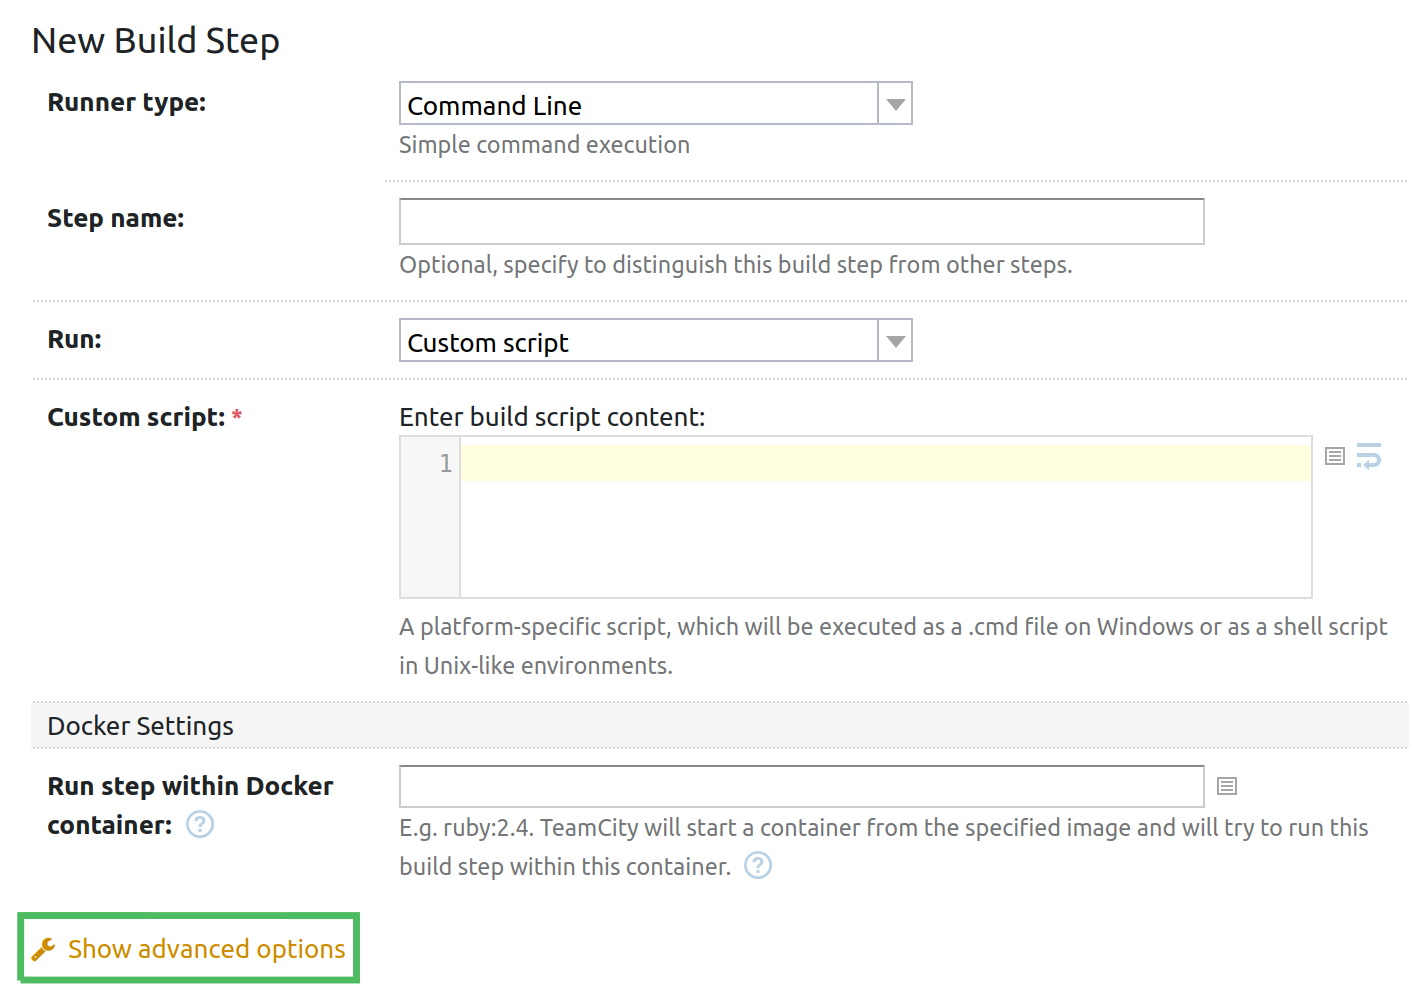
On the page, click the button.
On the page that opens, select the
Command linerunner.Configure the
Command linerunner as described on the TeamCity documentation portal.
In the field, paste a script that adds a custom
qodana.yamlfile to the working directory. In the example below, the script appends the following inspection exclusions to the configuration file:#!/bin/sh FILE="./qodana.yaml" /bin/cat <<EOM >$FILE exclude: - name: Annotator - name: AnotherInspectionId paths: - relative/path - another/relative/path - name: ProhibitedDependencyLicense EOM
Verify analysis results
Now that you have configured and run the build, you can examine analysis results in Qodana Cloud.
Alternatively, you can view analysis results using the TeamCity UI, follow these steps:
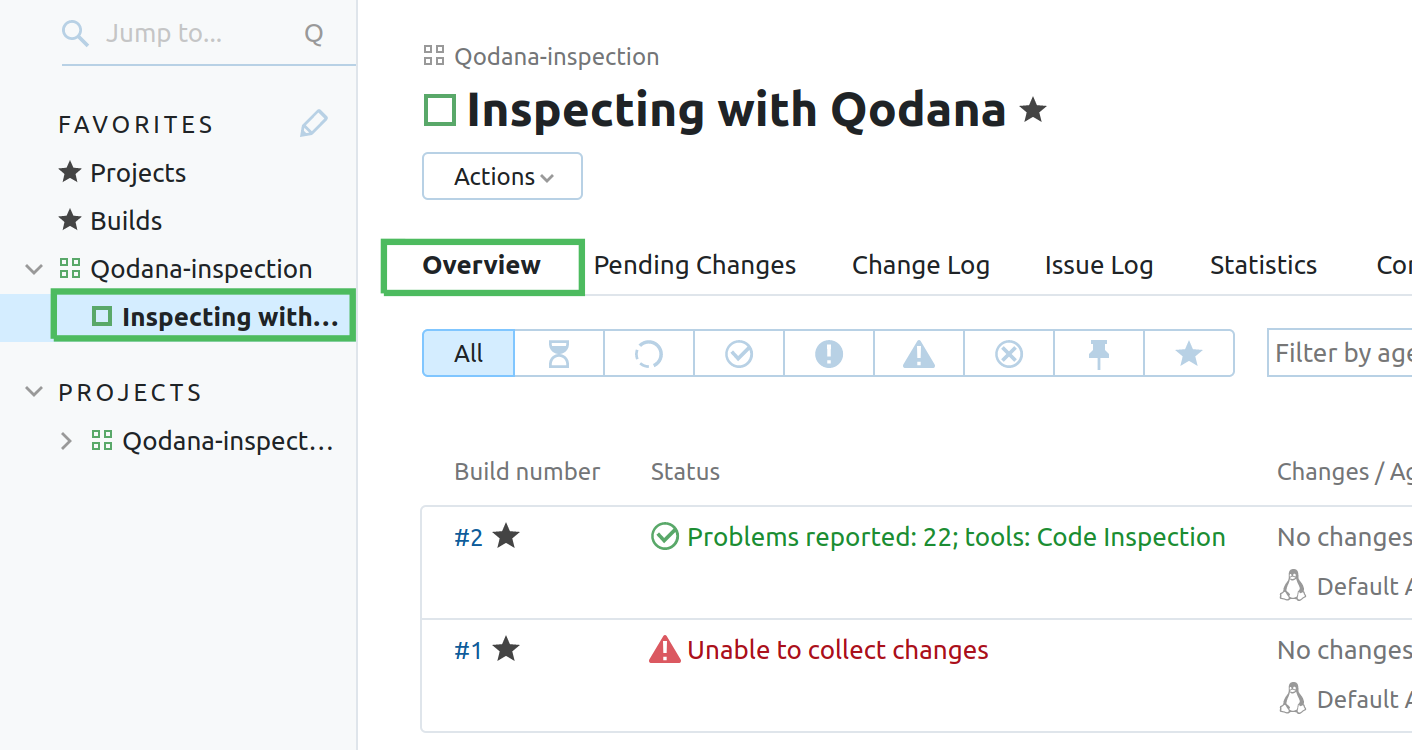
Navigate to a project build page. On the tab, click the build entry.

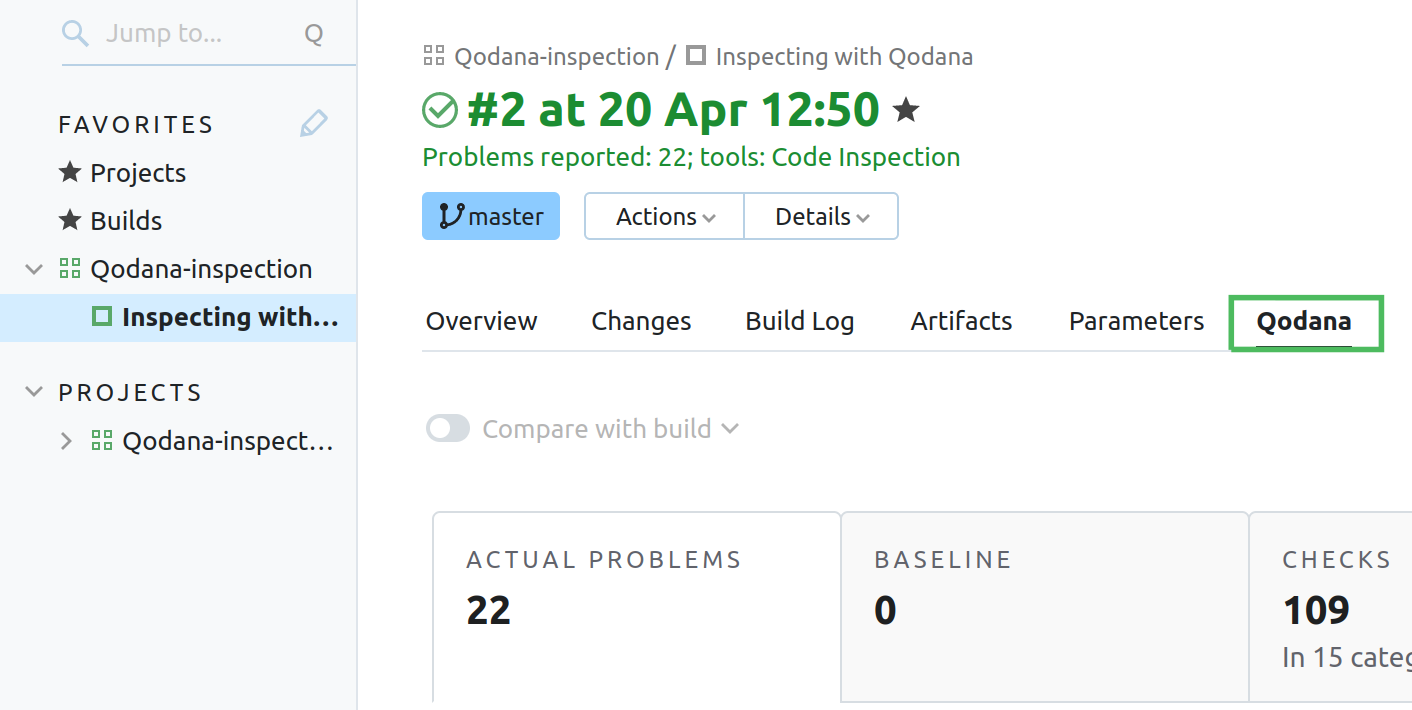
On the build page, navigate to the tab to find the analysis report. To learn more about Qodana reports, see the Analysis reports section of this documentation.
