Godot support
Rider provides comprehensive support for GDScript, including native GDScript support combined with LSP integration. This enables high accuracy and coverage for features like code analysis, navigation, type hints, and symbol resolution. Both LSP (language server) and DAP (debug adapter protocol) are configured automatically.
JetBrains Rider's renown code analysis, coding assistance, and code navigation features are available in both C# and GDScript code in Godot projects.
Godot support is based on two open-source plugins that are bundled with Rider: Godot Support, which is responsible for the overall Godot functionality, and GdScript, which provides a native support of the GDScript language.
Get started
JetBrains Rider is ready to work with Godot projects as soon as the Godot Engine is installed on your machine.
Godot projects can be opened in JetBrains Rider in the following ways:
If the project uses only GDScript, select from the main menu, choose the project folder, and click Select Folder.
If the project uses C#, open the solution file .sln located in the project folder via .
To set JetBrains Rider as the default editor for C# scripts in the Godot editor, navigate to in the Godot editor menu and select JetBrains Rider in the External Editor dropdown.
In a similar way, you can set JetBrains Rider as the default GDScript editor on the settings page.
To find the location of the JetBrains Rider executable, switch to Rider, go to , and look for Installation home directory. On Windows, you need to point to bin/Rider64.exe. On macOS, you need to point to Rider's .app folder.
For older Godot Editor versions, you may need to specify the following in the Exec Flags:
{project} --line {line} {file}.
Optimize Godot editor for Rider
Below are the recommended settings for configuring the Godot editor for optimal integration with Rider as your external editor. To access these settings, make sure that the Advanced Settings switch is enabled at the top of the Editor Settings dialog.
Use Rider Add-on in Godot Editor
A convenient alternative to manual configuration of Godot settings is Rider Godot add-on. It allows you to quickly apply a set of editor settings recommended for working with JetBrains Rider, which ensures a smooth development experience in Rider, including project discovery, run configurations, and code insight for C# and GDScript. Using the add-on, you can always switch between the Rider-optimized settings and the stock Godot settings with a single click.
Install Rider Add-on
Open the Godot Editor and click AssetLib at the top of the window.
Type
riderin the search bar that appears, and click JetBrains Rider Integration add-on to install it.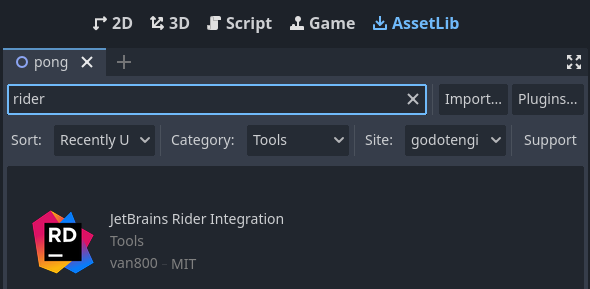
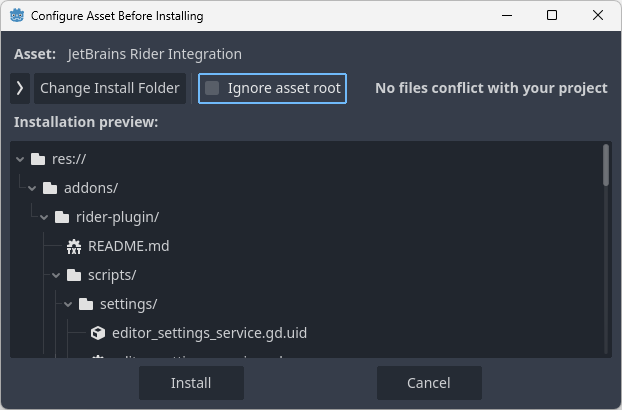
When the add-on is downloaded, make sure that Ignore asset root is turned off, and click Install to finish the installation.
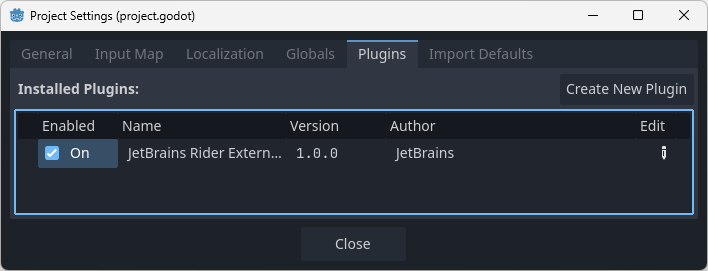
When the installation is finished, select from the menu, switch to the Plugins tab and enable the Rider add-on:
When the add-on is installed and enabled, the Use Rider toggle appears on the toolbar:
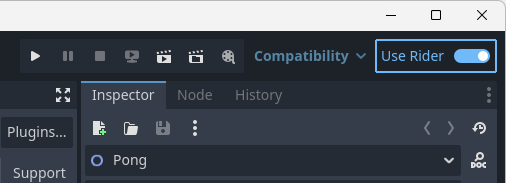
This toggle allows you to switch between the two sets of options defined in the res://addons/rider-plugin/presets.json. Depending on the state of the toggle, the values from on or off sections are applied to the editor settings.
Here is an example of how the configuration in presets.json looks like. You can customize the sets of values to your liking.
Work with GDScript code
JetBrains Rider can analyze GDScript files in two different ways:
By connecting to the Godot Language Service via LSP (which is normally the Godot Editor with the same project opened). The Godot Language Service becomes available on your machine when you install the Godot Engine.
By using the native Godot parser provided by the bundled GdScript plugin.
When Rider connects to the Godot LSP server, a connection indicator appears on the status bar. If there is a successful LSP connection, it is used for the analysis, and the native analysis via the plugin is disabled.
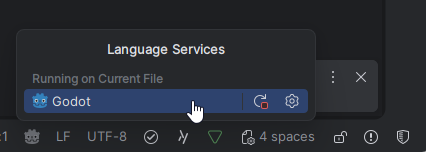
By default, JetBrains Rider establish the LSP connection with a running Godot editor. However, if you prefer to not have the Godot editor running, you can make Rider automatically start Godot LSP service in the background when needed. To do so, choose Automatically start headless LSP server in the LSP server connection: on the Languages & Frameworks | Godot Engine settings page Ctrl+Alt+S.
Code completion in GDScript
JetBrains Rider provides code completion for Variables, Constants, Methods, Signals, Enums, Classes, Annotations, Nodes, Inputs, Groups, Meta fields, and Resources:
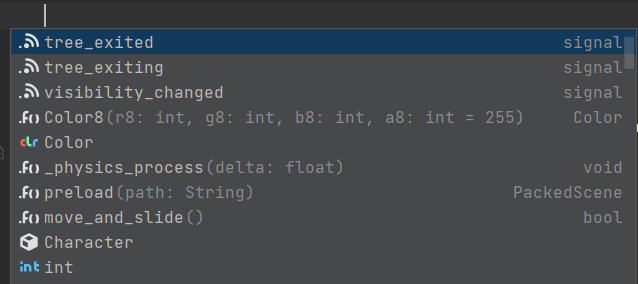


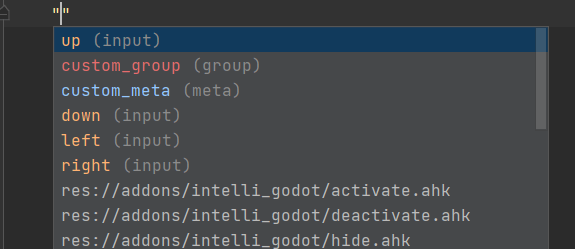
By default, the underscore-prefixed variables and methods do not appear in completion lists. If you want to change this behavior, clear the Hide _private members from completion checkbox on the page of JetBrains Rider settings Ctrl+Alt+S.
Go to Declaration/Usages in GDScript
You can use Go to Declaration (Ctrl+B or Ctrl-click) on usages of symbols and file resources.
If you are on a declaration of a symbol, Find Usages Alt+F7 will help you find all its references.

GDScript file templates
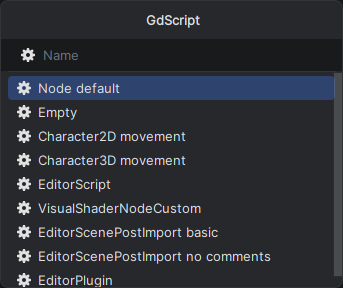
When adding new GDScript files to your project, you can use file templates imported from the Godot source:
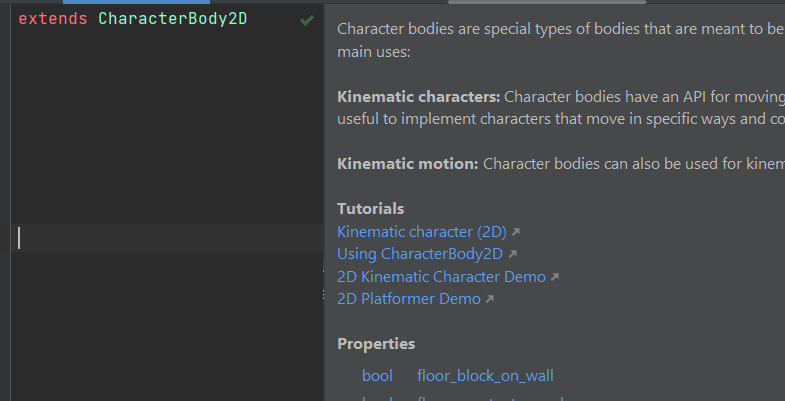
Quick documentation in GDScript
You can see Quick Documentation Ctrl+Q, which is generated from comments:
Parameter Information in GDScript
When writing or studying function calls in GDScript, use Parameter Information Ctrl+P to see the details of available method signatures:

Inlay Hints
There are also dedicated Inlay hints in GDScript files:

Action indicators in GDScript
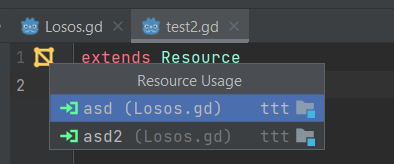
JetBrains Rider adds many different action indicators to the left margin. In addition to common indicators, such as the quick-fix bulb ![]() , you can use the following GDScript-specific indicators:
, you can use the following GDScript-specific indicators:
Parent (super) methods

Run the current scene

Resource usage
Connected signal

Inherited scene

Color picker

Code formatting in GDScript
An important aspect of code style is how to format the code, that is, how to use whitespaces, tabs, and line breaks to arrange code elements, whether and how to use tabs for indents, whether and how to wrap long lines, and so on.
The extensive set of JetBrains Rider code formatting rules has a default configuration that takes into account numerous best practices. You can configure every detail of formatting rules and enforce the rules in your code. These rules are applied when JetBrains Rider produces new code with code completion and code generation features, applies code templates and performs refactorings. The formatting rules can also be applied to the existing code in the current selection, current file, or in a larger scope up to the entire solution.
You can configure formatting styles for GDScript on the page of JetBrains Rider settings Ctrl+Alt+S.
Current limitations in GDScript support
get_node,get_parent, and so on are not parsed as the actual Node, but only as the genericNodetype.The
get_windowmethod (and maybe a few other methods) return different classes based on context (SubViewport,Window, etc.), but the return is parsed as the baseViewportclass, so to get code completion, you have to manually specify the type.Dynamic nodes and nodes added at runtime cannot be predicted at design time, and therefore no code completion is available for them.
C# support
JetBrains Rider provides full support for Godot projects written in C#. This includes:
Navigation, code completion, and refactoring tools tailored to the Godot framework
Code inspections with quick-fix suggestions
MSBuild integration and support for Godot's C# project model
Debugging functionality, including breakpoints, step execution, and variable inspection
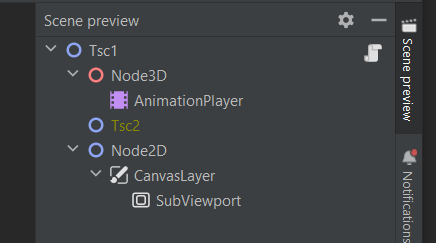
Scene preview window
In JetBrains Rider, you can see the Node tree of the selected .tscn of or all .tscn files connected with given .gd file in the dedicated Scene preview window:
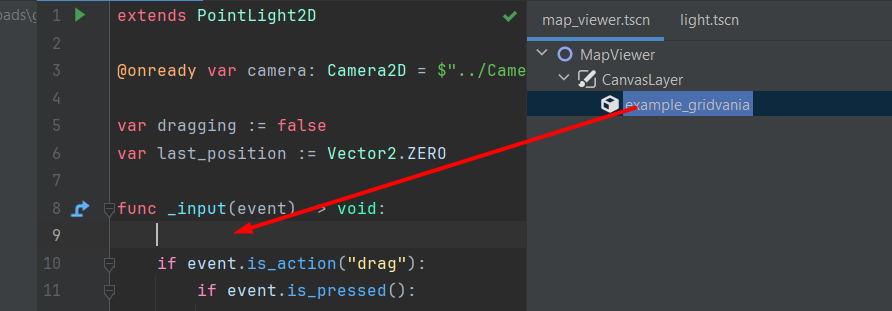
You can drag-n-drop nodes from the Scene preview into the script in the editor:
Build C# projects
JetBrains Rider builds Godot C# projects the same way as any standard .NET projects. By default, JetBrains Rider optimizes the build process with ReSharper Build, which tracks changes in your solution and only rebuilds modified projects and necessary dependencies. See how ReSharper build works for more details.
When you declare or change export variables in a C# script, they appear in the Godot editor only after rebuilding the project. Therefore, by default, JetBrains Rider rebuilds the project as soon as the application focus moves out of Rider. If the automatic rebuild causes performance issues, you can clear the Build Automatically checkbox on the page of JetBrains Rider settings Ctrl+Alt+S.
Run and debug
When you open a Godot project, JetBrains Rider automatically creates one or more run configurations that you can use to run and debug games. Debugging of Godot projects is performed via the Debug Adapter Protocol (DAP).
There are some differences in running Godot projects that only have C# code and projects that have GDScript or mixed GDScript/C# code.
Run and debug Godot projects with C# code
If you are going to debug your project, prepare your session by setting breakpoints where necessary.
Use the Player run configuration to launch your project. This configuration is created automatically when you open the Godot project

Alternatively, you can launch a single scene from your Godot/C# project. To do so, right-click a scene file .tscn and choose Debug '[scene name].
Godot projects with GDScript code can be launched from JetBrains Rider only under the debugger. To run such projects without debugging, use the Godot editor.
Debug Godot projects with GDScript code
Make sure that the Godot editor is running having the same project open.
If it is not running, you can start it from JetBrains Rider by clicking the Godot icon on the toolbar and choosing Start Godot Editor:

If you are going to debug your project, prepare your session by setting breakpoints where necessary.
Use the Player GDScript run configuration to launch your project. This configuration is created automatically when you open the Godot project
Debug both GDScript and C#
Start the debugging session with the Player GDScript configuration as described above.
Press Ctrl+Alt+F5 or select from the main menu.
Select the desired Godot process in the list and click Attach with .NET Debugger.
C++ support
For developers working with the Godot engine source code, JetBrains Rider offers comprehensive support for C++ development. This includes:
Smart code insight with features like code completion and navigation
Code inspections and refactorings
Cross-platform compatibility for modifying and extending the engine
Integration with build systems and debugging tools
Test C# projects
If you use the gdUnit4Net unit testing framework to in your C# Godot project, you can use the extensive features for unit testing.
Profile C# projects
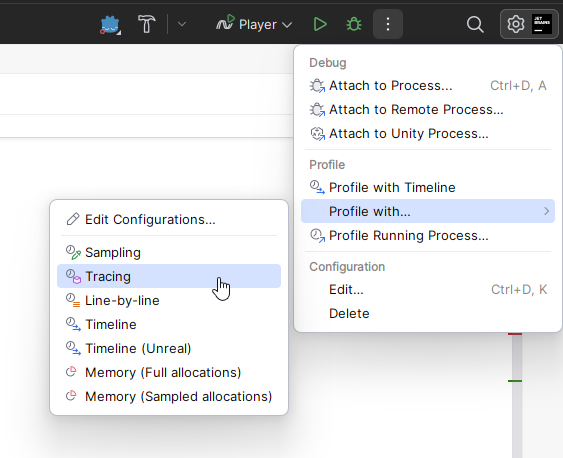
To profile the performance and memory of a C# Godot project, click the three-dots menu next to the automatically created Player run configuration and choose the desired profiling type:
Fore more information, see the original pull request in the Godot engine.