Unit testing
JetBrains Rider helps discover as well as run, debug, cover, or profile unit tests . The following unit testing frameworks are supported:
NUnit — JetBrains Rider installation includes two bundled test runners that support NUnit versions up to 2.7.1 and up to 3.15.5 respectively. NUnit versions up to 5.0 are also supported and are used if the corresponding NuGet package is installed in the project.
MSTest v1 (Windows only, requires Visual Studio installed), v2, v3, and v4 (cross-platform)
xUnit v1, v2, and v3, including xUnit v3 version 4.0.
Custom test frameworks that use VSTest. To configure discovery for these frameworks, refer to VSTest.
Custom test frameworks that use Microsoft.Testing.Platform, such as TUnit.
Microsoft.Testing.Platform support is enabled by default. Build the test project to discover its tests. To configure this support, refer to Testing Platform.
To analyze coverage of Testing Platform tests, the test project also needs a dotCover NuGet package. For more information, refer to Analyze coverage of Testing Platform tests.
With JetBrains Rider, you can execute a single unit test, all tests in a test class, file, project or solution. You can also execute any number of tests combined in a test session.
Besides running and debugging unit tests, you can analyze code coverage of unit tests and run performance profiling of unit tests.
Before running coverage analysis or performance profiling, make sure that the PDB information exists for all target assemblies. The safest choice would be to build your code with the Debug build configuration.
In this section:
- In current document
- In project or solution
- Unit test sessions
- Test categories
- Execute tests
- Analyze test results
- Create unit tests
- Navigate between tests and tested code
- Maintain code quality of unit tests
- Monitor memory with dotMemory Unit
- Unit Tests window
- Unit Tests Coverage window
All JetBrains Rider unit testing actions are available from the menu or from the Unit Testing Quick List Alt+Shift+U:
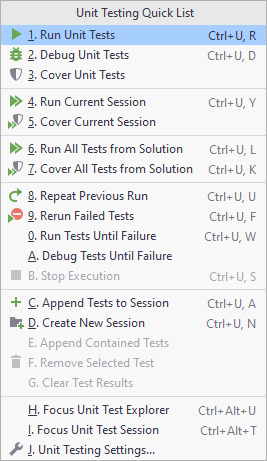
You can use the following shortcuts for unit testing commands:
Unit testing
Unit Testing Quick List... | Alt+Shift+U |
Run Unit Tests | Ctrl+;, R |
Debug Unit Tests | Ctrl+;, D |
Stop Execution | Ctrl+;, S |
Create Unit Test | Ctrl+T, C |
Go to Test/Tested Class | Ctrl+T, G |
Repeat Previous Run | Ctrl+;, T |
Rerun Failed Tests | Ctrl+;, F |
Run Tests Until Failure | Ctrl+;, W |
Run All Tests from Solution | Ctrl+;, L |
Create New Session | Ctrl+;, N |
Append Tests to Session | Ctrl+;, A |
Run Current Session | Ctrl+;, Y |
Run Unit Tests under dotMemory Unit | Ctrl+;, M |
Run Selected Tests | Shift+Enter |
Debug Selected Tests | Ctrl+D |
Run Current Session (Tool Window) | Ctrl+Y |
Create New Session (Tool Window) | Alt+Shift+Insert |
Append Tests to Session (Tool Window) | Ctrl+Alt+Insert |
Remove Selected Tests (Tool Window) | Delete |
Run All Tests from Solution (Tool Window) | Ctrl+L |
Show Unit Tests window | Alt+Shift+8 |
For the full list of JetBrains Rider keyboard shortcuts, refer to Keyboard shortcuts in predefined keymaps.