Debug Unity applications
JetBrains Rider allows you to attach the debugger to the Unity Editor or a player. Once connected, you can stop at an interesting game state, inspect Unity objects and collections, change runtime values, and step into your own or external code.
Attach the debugger
Debug a Unity application on a local computer
Make sure the project you want to debug is opened in the Unity editor.
In JetBrains Rider, open the corresponding Unity project solution.
Set breakpoints by clicking the gutter next to a required line of code.
Select the Attach to Unity Editor & Play run configuration.
Start a debugging session by doing one of the following:
Click
 on the toolbar.
Choose from the main menu.
Press Shift+F9.
Debug a Unity application on a remote device
Make sure the project you want to debug is opened in a Unity player on the remote device.
In JetBrains Rider, open the corresponding Unity project solution.
Set breakpoints by clicking the gutter next to a required line of code.
Make sure the Development Build and Script Debugging options are selected in Unity's Build Settings.
Make sure the remote device is visible to the current network, and firewall rules allow incoming UDP messages for the current process.
If you use an Apple USB device, make sure iTunes or the Apple Mobile Device service are installed.
From the main menu, select .
In the opened window, click Add player address manually and specify Host IP address and Port for connecting to the Unity player.
Select the Unity process in the list and click OK.
Run the application using the Play button in Rider or in the Unity player.
When developing games for Android, it is often necessary to debug the game on a physical Android device to ensure that it works correctly. One way of doing that is through USB using the Android Debug Bridge (adb) — a command-line tool included in the Android SDK.
Debug a Unity application on Android devices via USB with adb
Open the Unity project in a version of Unity where Android support is included.
Change the build target to Android using the Build Settings dialog and build and deploy to a connected Android device via USB.
In Rider, choose from the menu and select the Android device and Unity project to debug. Multiple Unity projects running on the device will be listed separately.
Add a breakpoint and debug as normal. The temporary run configuration created automatically can be reused for quick reattachment.
Inspect Unity objects
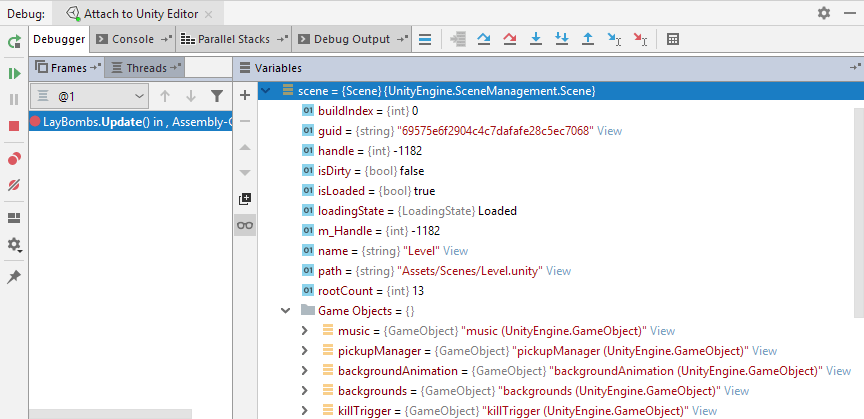
When execution is suspended, JetBrains Rider presents Unity objects in a form that is useful for debugging instead of requiring you to navigate their raw internal structure. The debugger shows the active scene, root game objects in a Scene, and the children and attached components of each GameObject. For ECS Entity objects, it shows component data.
These Unity-aware views make it easier to relate a value in the debugger to the object hierarchy and state in your game. They are controlled by Extend value rendering on the Unity Engine settings page.
Explore collections while debugging
Use the collection visualizer to inspect arrays and collections as tabular data. For example, when debugging an object pool, you can filter and sort its objects to find the active, inactive, or initialized instances that matter to the current problem.
Click Explore next to a collection in the Debug window. In the collection view, you can rearrange columns, search, filter, sort, and use the available data-analysis actions. For details, refer to Visualize data structures.
Debug textures
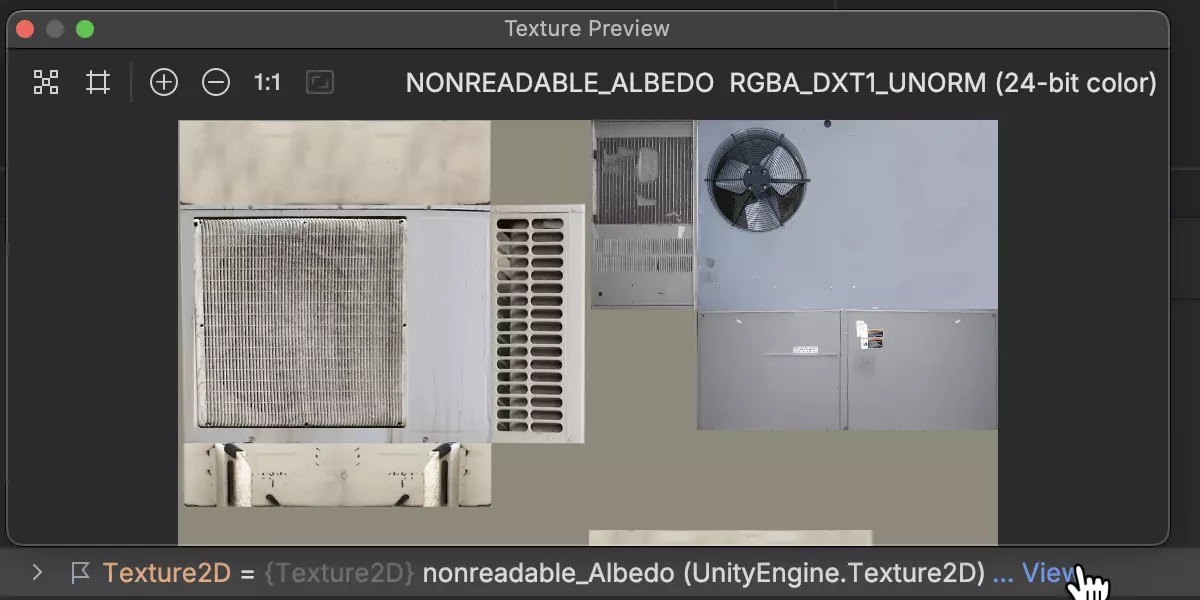
Preview Unity textures directly in the debugger when you need to verify generated or modified image data without exporting it or adding temporary rendering code. The visualizer supports Texture2D and RenderTexture objects.
Pause the debugger when a texture object is available in the context.
In the Debug window, find the desired texture object and click View next to it.
In the popup that appears, use the zoom and pan controls to study the texture:
Control when execution stops
Customize breakpoints
Code in a game loop can run many times per frame, so suspending at every breakpoint hit is rarely useful. Customize a breakpoint to stop only for the state you need. For example, add the condition health <= 0, or use a hit count to investigate a problem that appears only after repeated updates.
A dependent breakpoint can remain disabled until another breakpoint is reached, such as an initialization breakpoint. A temporary breakpoint with Remove once hit stops only once. If you need diagnostic output without interrupting gameplay, use a tracepoint instead of suspending execution.
To configure conditions, hit counts, dependencies, logging, and one-shot behavior, right-click a breakpoint or open the Breakpoints dialog. For details, refer to Breakpoints.
Pausepoints
A pausepoint is a type of debugger breakpoint that does not suspend the execution of your code but instead pauses the Unity Editor at the end of the current frame. This lets you set a pause condition in the code (for example, hit a button, reach a certain health value, or just go down a certain code path) and then use the Unity editor's Inspector window to inspect the current state of the game. So, unlike a breakpoint, a pausepoint does not suspend the Unity editor.
Set a Unity pausepoint
Do one of the following:
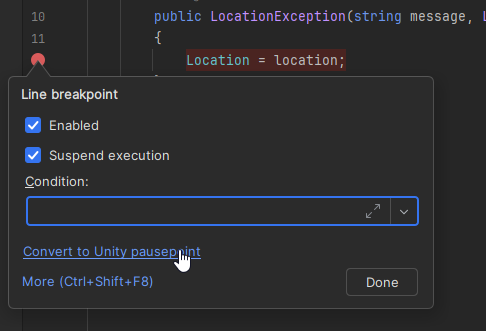
Set a line breakpoint to a required line of code. Then, right-click the breakpoint and in the context menu, choose Convert to Unity pausepoint.
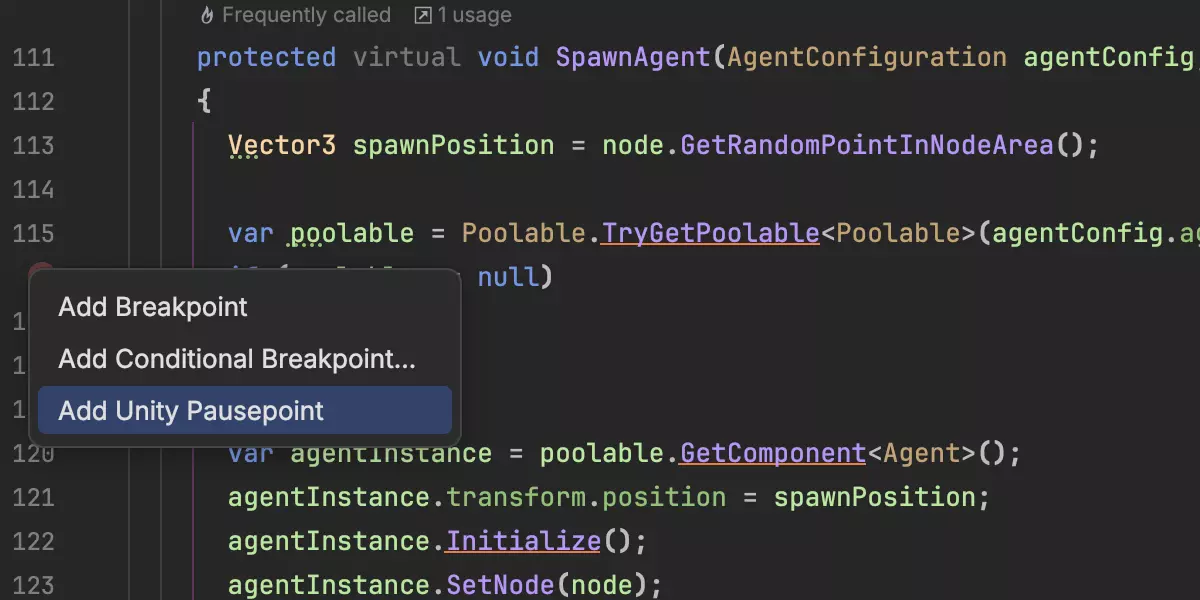
Right-click the gutter area or the line number and choose Add Unity Pausepoint from the menu.
Optionally, set an additional condition or a hit count for the pausepoint.
Once execution reaches the pausepoint, the Unity editor will switch to the pause mode letting you inspect the current state of your game or even change any values.
Tracepoints
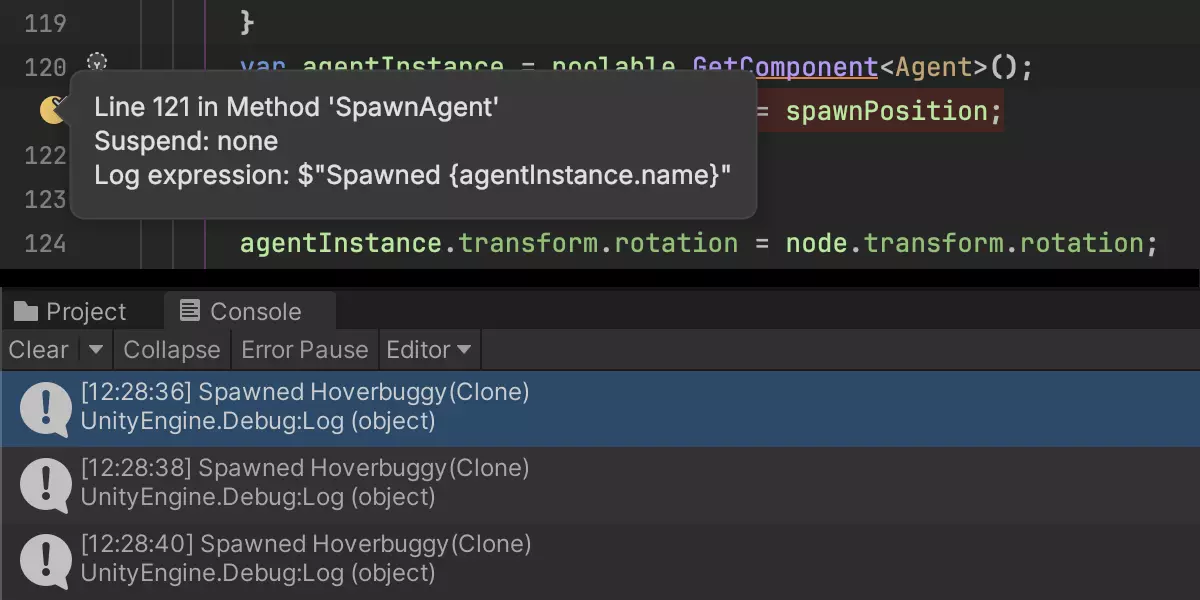
If you use tracepoints, you can log messages and expression values without suspending the game. Tracepoint output is shown in the Unity Console:
Evaluate expressions and change values
While execution is suspended, you can evaluate expressions in the current context and change variable values. For example, change a counter, health value, state, or flag and resume execution to enter a branch that would otherwise be difficult to reach.
This lets you investigate a game state without editing the source, rebuilding the player, and reproducing the situation from scratch. Remember that changing values can leave the running game in an inconsistent state.
Debug external code
When a problem leads into a library for which source is not immediately available, navigate or step into it as usual. JetBrains Rider can show its decompiled representation, and you can set a breakpoint directly in the decompiled code to investigate the library's behavior. For supported runtimes and configuration, refer to Debug external code.
Debug IL2CPP players
Attach to an IL2CPP player in the same way as to another remote Unity player. Build it with Development Build and Script Debugging enabled, and then use . IL2CPP players support the Unity-aware debugger views for scenes, GameObject objects, children, and components when Extend value rendering is enabled.
IL2CPP code trimming can remove types or members that the debugger would otherwise evaluate. If data is missing or a player cannot be attached, refer to Troubleshooting debugging Unity players.
Troubleshooting debugging Unity players
If you have problems debugging Unity players, refer to the troubleshooting pages for debugging Unity players and debugger connection on Windows.