Unity Engine settings
General
Automatically refresh assets in Unity | If this checkbox is enabled, JetBrains Rider triggers asset refresh in Unity when you make one of the following changes to the project:
|
Notify when Rider package update is available | Shows a notification when a newer version of the JetBrains Rider package is available for your Unity project. Update the package in Unity's Package Manager. |
C#
Show gutter mark or Code Vision for implicit script usages | Controls Unity gutter icons and Code Vision hints for classes, methods, and fields that Unity uses implicitly: Choose Always, When Code Vision is disabled, or Never to control when gutter icons appear.  |
Enable performance analysis in frequently called code | When this option is enabled, JetBrains Rider shows you performance-sensitive areas: event functions that are called each frame, such as |
Highlight performance critical contexts: | Unity has a number of methods that get called frequently. These methods are treated as a performance-critical context and can be highlighted in the editor gutter. Choose Always to highlight all such areas, Current method only to highlight the current method, or Never to hide these highlights. 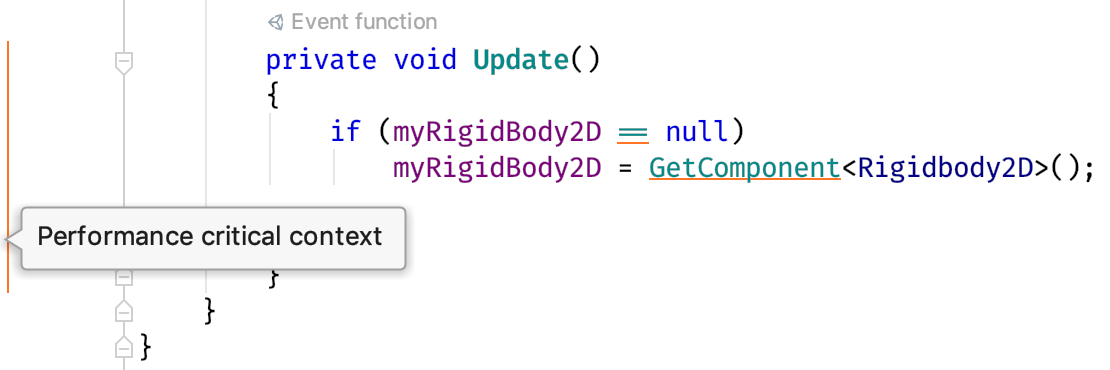 |
Show gutter mark or Code Vision for frequently called methods | When this option is enabled, you will see the following gutter indicators next to frequently called methods. The option also controls the corresponding Code Vision hints:  |
Enable analysis for Burst compiler issues | Toggles Burst compiler warnings. |
Show gutter mark or Code Vision for Burst-compiled methods | Toggles additional gutter icons and Code Vision hints for Burst-compiled methods. This option requires Enable analysis for Burst compiler issues. |
Use assembly definition folder as namespace root | Calculates C# namespaces relative to the folder containing the assembly definition (.asmdef), excluding parent folders. If the assembly specifies a root namespace, JetBrains Rider uses it instead of the assembly definition folder name. Regenerate Unity project files after changing the root namespace in the assembly definition. This option is disabled by default. |
Skip 'Editor' folders when calculating namespaces | Excludes folders named Editor when calculating C# namespaces in Unity projects. This avoids adding an |
DOTS
Exclude DOTS-generated code from navigation results | Hides source-generated partial declarations of Unity DOTS types from navigation results, so you can navigate to the declarations you wrote. Clear this checkbox to include generated declarations. |
Refactoring
Serialized field refactoring settings | Controls whether the Rename refactoring adds
|
Text-based assets
Parse text-based asset files for script and event handler usages | Indexes Unity assets saved in text format to find references to scripts, serialized fields, and event handlers in scenes, prefabs, and other assets. This lets Find Usages include references from asset files. Clear this checkbox to reduce indexing work at the cost of asset usage information. |
Show Inspector values in the editor | Shows values assigned to serialized fields in Unity's Inspector directly in the code editor. This requires text-based asset indexing and Unity's Asset Serialization mode set to Force Text. |
Cache prefab data to improve Find Usages performance | Caches imported prefab data so that repeated Find Usages searches can reuse it. Clear this checkbox to reduce cache memory usage at the cost of slower searches through prefabs. |
Automatically disable asset indexing for large solutions | Disables asset indexing when an external file to index exceeds 250 MiB or their total size exceeds 4,000 MiB. Large binary assets that cannot be indexed do not count toward these limits. JetBrains Rider shows a notification when it disables indexing. You can re-enable it with Parse text-based asset files for script and event handler usages. |
Prefer UnityYamlMerge for merging YAML files | Uses Unity's UnityYAMLMerge tool to merge YAML files in Unity projects. If the tool cannot resolve a conflict, JetBrains Rider opens its merge viewer. |
Merge parameters | Sets the command-line arguments passed to UnityYAMLMerge. The default is |
Shaders
Suppress resolve errors of unqualified names | Suppresses unresolved-name errors in HLSL shader code in Unity projects. Enable this option if Unity-specific shader declarations cause false errors. This option is disabled by default. |
Debugging
Extend value rendering | When enabled, JetBrains Rider will show extra values in debugger object views, such as active scene and |
Ignore 'Break on unhandled exceptions' setting for IL2CPP players | Unity's Mono 4.x runtime ignores the 'Break on unhandled exceptions' setting. This option applies the same behavior to IL2CPP players. |
Timeout for advanced Unity evaluations, in milliseconds | Sets how long the debugger waits before terminating advanced Unity evaluations, such as generating a texture preview. The default is 10,000 milliseconds. |
Breakpoint Trace message output: | Chooses where breakpoint trace messages appear: Debugger console and Unity log, Unity log, or Debug output. By default, messages appear in both the debugger console and the Unity log. |
Profiler integration
These options are on the Profiler Integration subpage.
Enable Unity profiler integration | When this checkbox is selected, JetBrains Rider allows analyzing Unity profiler snapshots directly in the editor and in the Unity Profiler window. |
Unity profiler snapshot fetching mode | By default, JetBrains Rider automatically fetches the snapshot data from Unity profiler as soon as the snapshot is captured. However, fetching the snapshot in a resource-intensive setup may take some time. In this case, you can disable automatic fetching by choosing Manually in this selector. In the manual mode, JetBrains Rider alerts when new snapshot data is available, which is either when you capture a new snapshot in Unity or when you switch the snapshot frame in the Unity Profiler window. You can then fetch the data at any convenient moment by clicking the corresponding button in the Unity Profiler window: 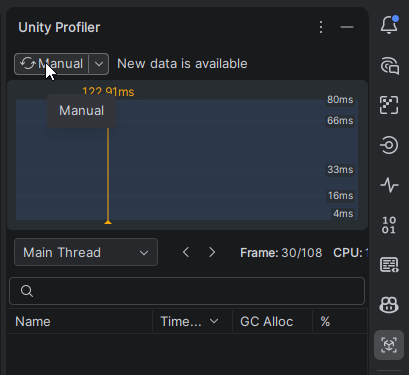 The widget at the top of the Unity Profiler window also allows you to quickly toggle the profiling mode. |
Enable profiler highlightings | When enabled, JetBrains Rider displays gutter marks with the profiler information. |
Profiler highlightings view mode | By default, the gutter marks display the CPU load, which makes the markers wide. You can choose Minimized to display narrow gutter marks, which are color-coded. |