.NET Unity
You can analyze Unity project using the Qodana for .NET linter in the native mode as explained in this section.
Before your start
Before running Qodana, you need to take several steps to prepare your project.
Qodana Cloud
To run Qodana, you need to obtain a project token that will be used by Qodana for identifying and verifying a license.
Navigate to Qodana Cloud and create an account there.
In Qodana Cloud, create an organization, a team, and a project.
On the project card, you can find the project token that you will be using further in this section.
Solution and packages
Make sure that you have already built your Unity project, see the Build the project chapter of the .NET section for details.
Unity projects typically don’t include a C# solution and project files, and these should be generated. Install the corresponding .NET SDK in the build environment by executing the following script on each build:
Qodana configuration
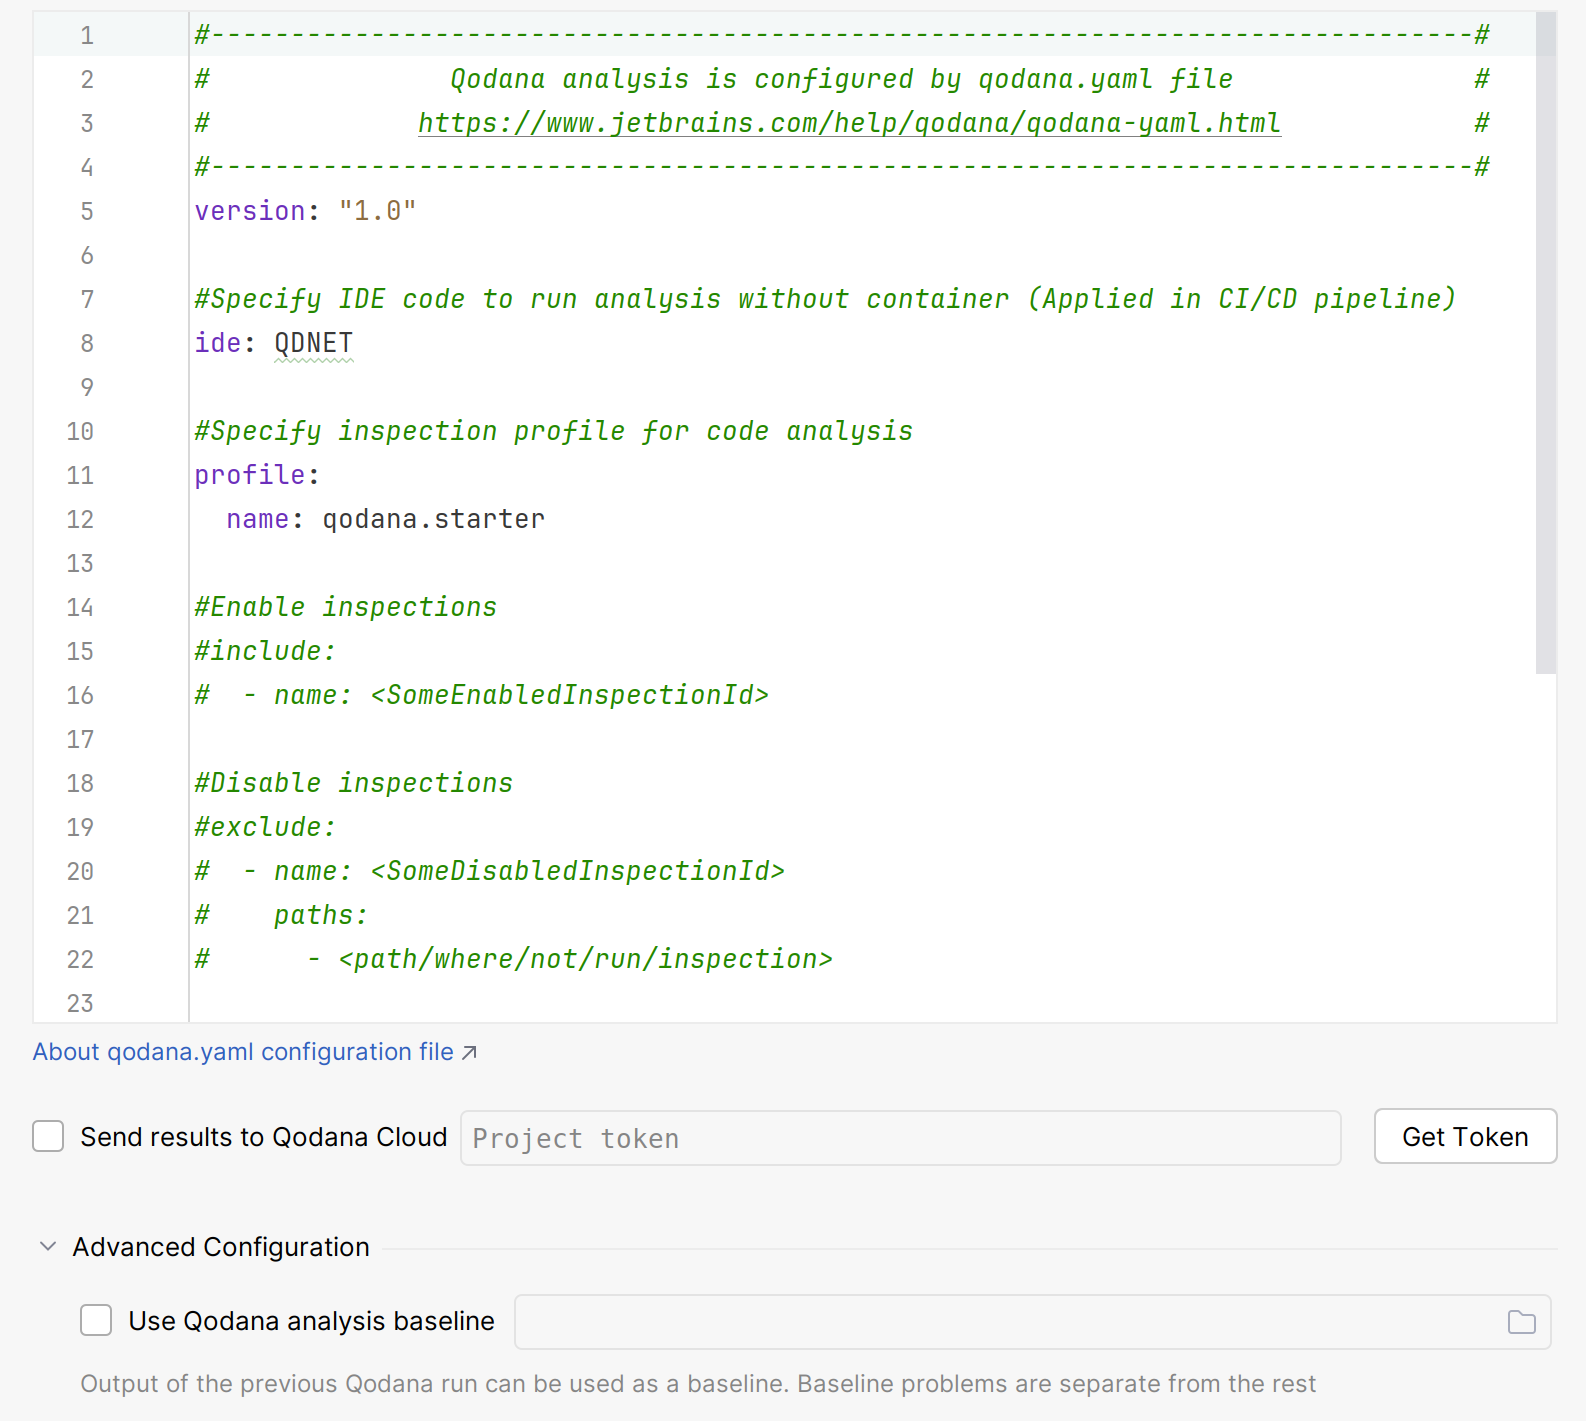
In the qodana.yaml file, save the following configuration to employ the Qodana for .NET linter in the native mode and use the qodana.recommended inspection profile:
Native mode is the recommended mode for running the Qodana for .NET linter.
Prepare your software
Choose the software that you would like to use for running Qodana, for example:
On the tab of the GitHub UI, create the QODANA_TOKEN encrypted secret and save the project token as its value.
In the root directory of your project, save the .gitlab-ci.yml file. This file will contain a pipeline configuration that will be used by GitLab CI/CD in this use case.
Follow the instructions from the Qodana CLI page on GitHub.
Run Qodana
To inspect the main branch, release branches and the pull requests coming to your repository in the native mode, save this workflow configuration to the .github/workflows/code_quality.yml file:
Run this command in the project root directory:
This command tells Qodana to generate the output and report in the /report directory inside a project directory.
In your IDE, navigate to .
On the dialog that opens, make necessary configurations to the
qodana.yamlfile.
Click for analyzing your code.
In the tool window, see the inspection results.
Customize your analysis
Using recommendations from the Analysis reports and Inspection profiles sections, you can adjust Qodana analysis of your project. For example, using the Configuration tab of a Qodana report, you can select the inspections that will be used during the analysis or exclude them from the analysis. Also, you can exclude directories of your project that you do not wish Qodana to analyze. To adjust the existing profile, you can use the recommendations from the Custom profiles section.