Code coverage
Code coverage uses generated reports to calculate the overall code coverage inside a method, a class, and a file. It also reports on the issues connected with the missing coverage in these entities.
This feature is available under the Ultimate and Ultimate Plus licenses in the following linters:
Linter | Code coverage tool | Supported report formats |
|---|---|---|
IntelliJ IDEA Code Coverage Agent is the recommended tool |
| |
| ||
| ||
|
How it works
For the missing code coverage issues, the predefined threshold in Qodana is currently set to 50%.
Code coverage employs several inspections that are already included in the qodana.recommended and qodana.starter default inspection profiles, so you do not need to enable them:
Linter | Employed inspection |
|---|---|
Once the inspection is complete, reports are available in Qodana reports and JetBrains IDEs.
Code coverage calculation
Qodana calculates a code coverage based on the number of code lines containing logic with function, method, and class statements being ignored. Here is the snippet containing comments on how it works:
Prepare the project
Configure a code coverage tool. While configuring Jest, note that all files in coverage reports should have the relative paths inside the project. For example, if your codebase files are contained in the
<project-root>/src/directory, then file paths in code coverage reports should besrc/<file-name>.If you run Qodana locally, use your code coverage tool to generate a code coverage report. Save the report to the directory where Qodana can read it. If you run Qodana in your GitHub pipeline, configure the workflow as shown in the Run the code coverage section.
Run the code coverage
Map the directory containing code coverage reports to the /data/coverage directory and the project token using the QODANA_TOKEN variable. Here are the Docker and Qodana CLI command samples:
Create the pipeline that will store all code coverage output files in the <project-root-dir>/.qodana/code-coverage directory. Below is the pipeline configuration example containing the comments:
You can find configuration examples in our GitHub repository.
Create a GitLab CI/CD pipeline that will store all code coverage output files in the <project-root-dir>/coverage directory:
This uses the QODANA_TOKEN variable to contain the project token. The --coverage-dir=$CI_PROJECT_DIR/coverage in the script block runs Qodana with the code coverage directory.
Fresh code
Fresh code is the code contained in a GitHub pull request. Qodana can calculate fresh code coverage and display the results.
To enable the fresh code feature, in your GitHub workflow configure the PR-mode. Here is the sample for inspecting the JavaScript fresh code:
Report overview
After you have prepared the project and ran the code coverage, you can view code coverage reports in Qodana Cloud or using your IDE.
Qodana Cloud
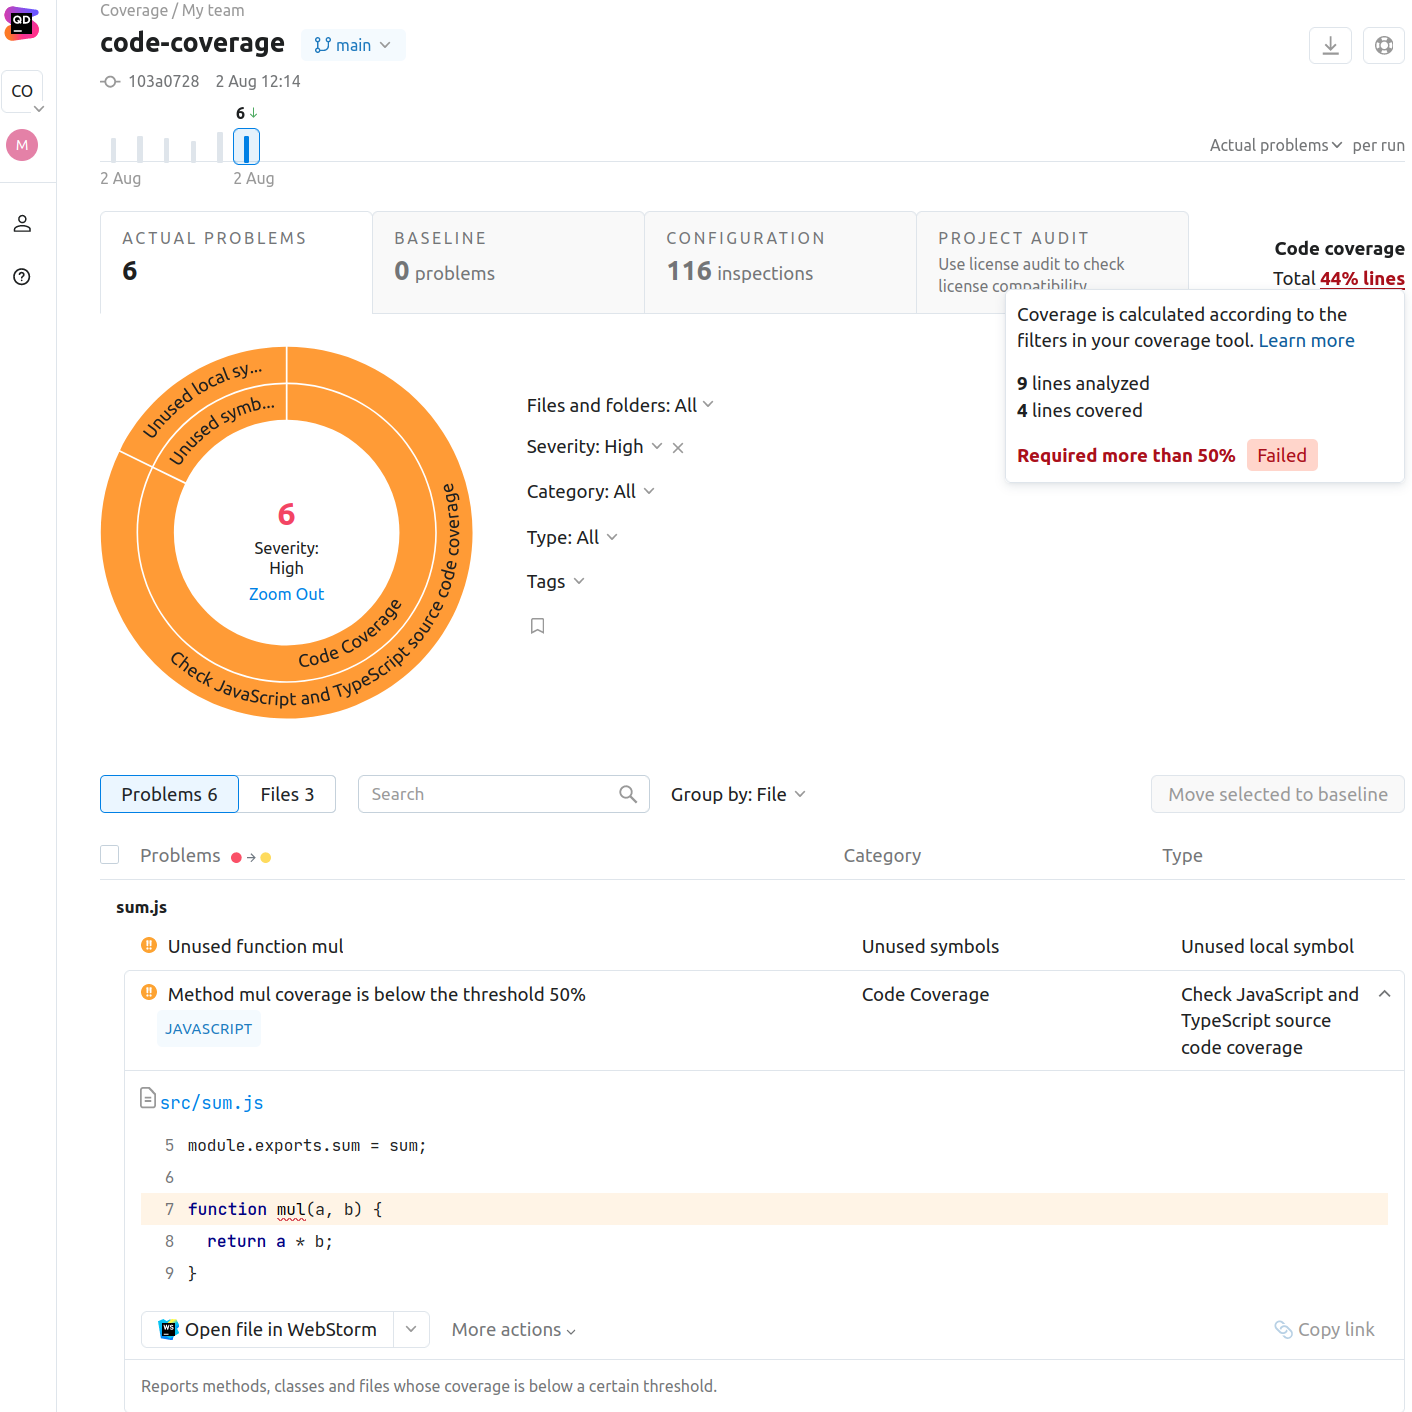
You can find code coverage statistics in the upper-right corner of the Qodana report UI. It also enumerates the inspections that were employed by the feature.

IDE
You can view code coverage reports using IntelliJ IDEA, WebStorm, and PhpStorm IDEs starting from version 2023.2. This feature is available for reports retrieved from Qodana Cloud after linking, or reports from local storage.
Open reports from Qodana Cloud
In your IDE, navigate to .

In the dialog, click .

This will redirect you to the authentication page.
In the dialog, search for the project you would like to link with.

View coverage reports in IDE
You can view locally-based code coverage reports directly in JetBrains IDEs.
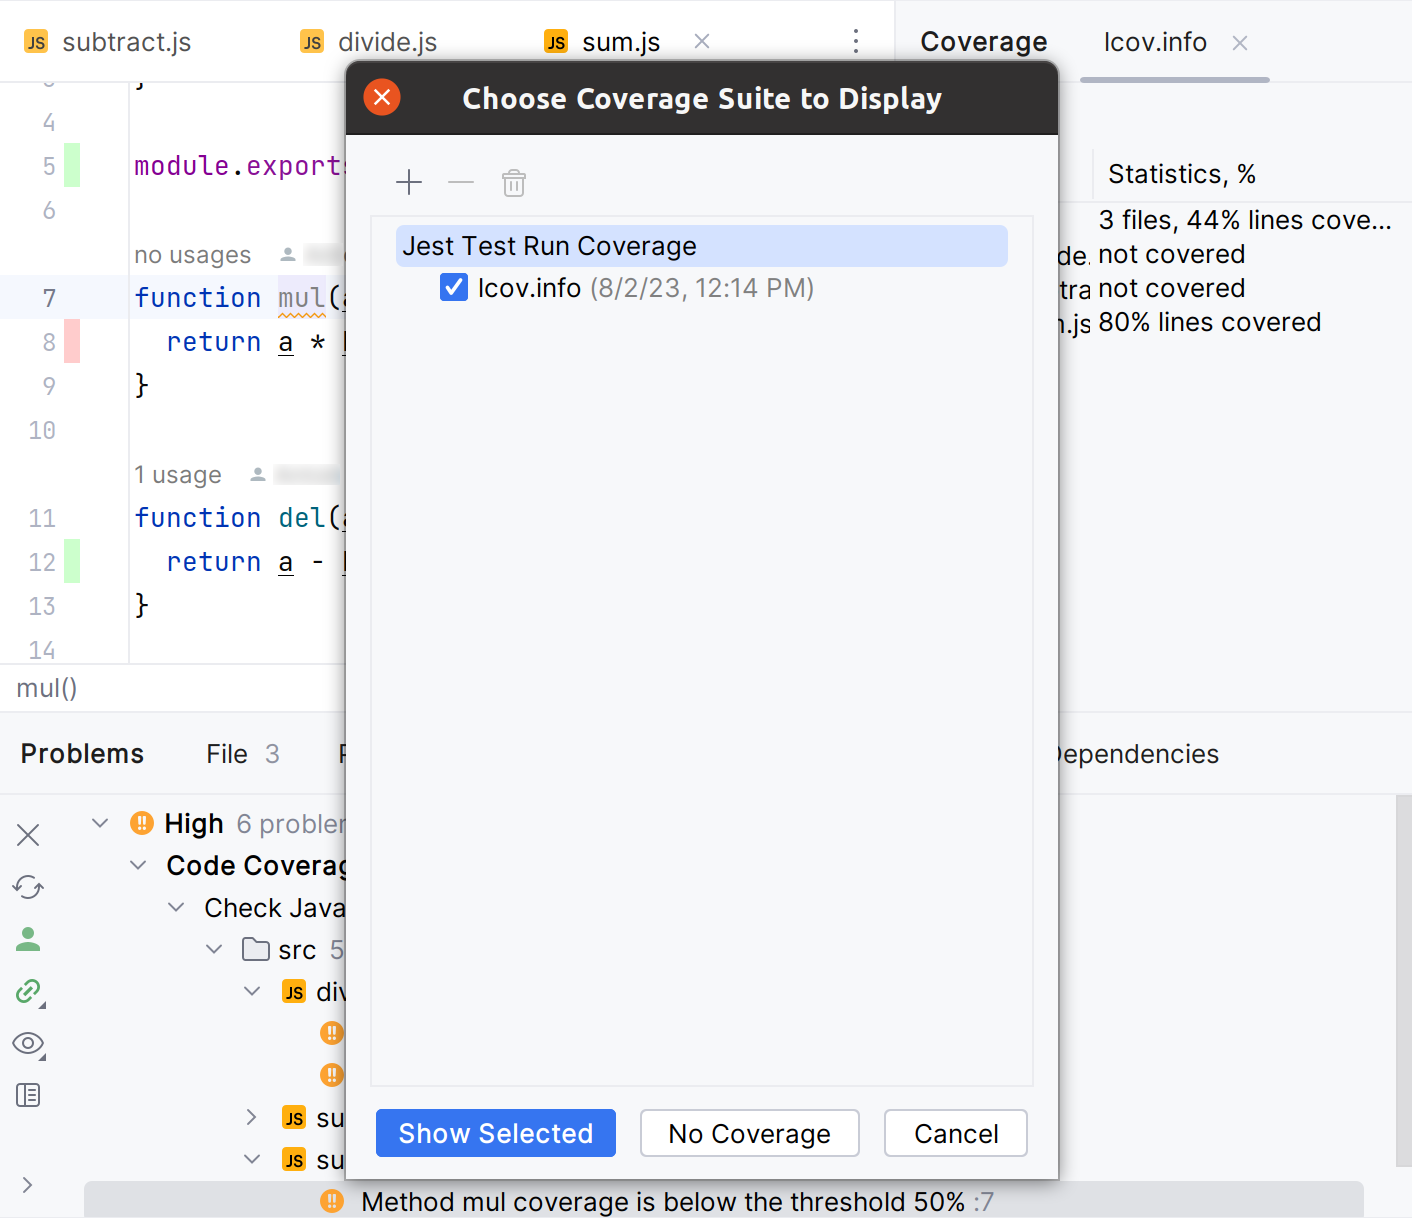
In your IDE, navigate to and open the file containing a code coverage report.

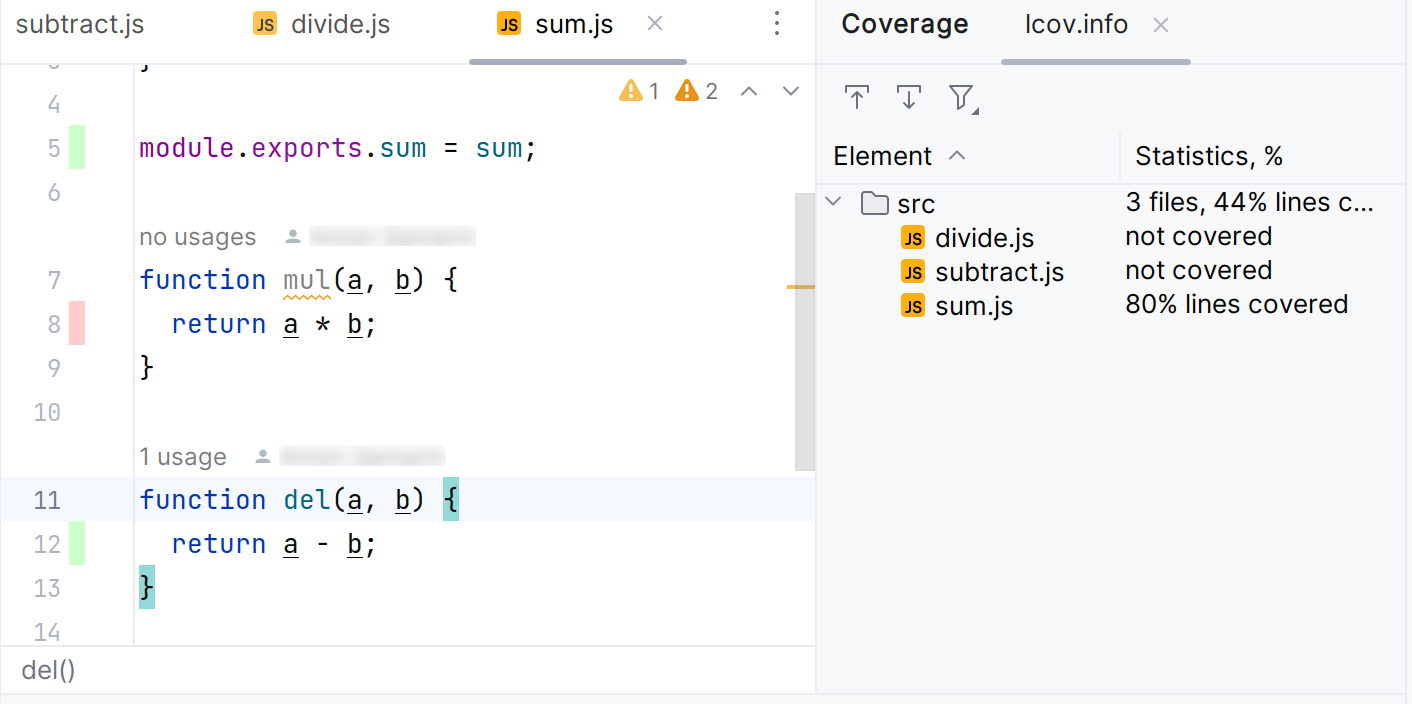
In the tool window, you can view the test coverage report. This report shows the percentage of the code that has been executed or covered by tests.

Report overview
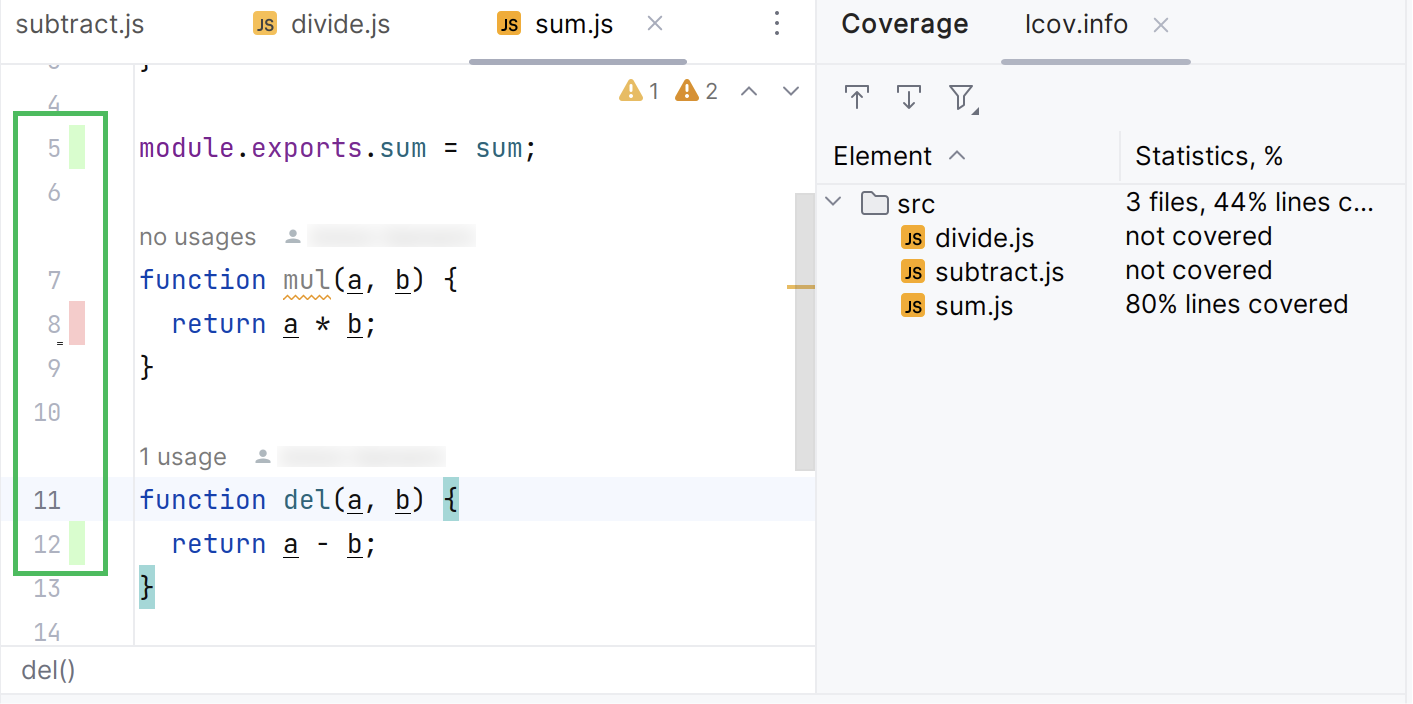
The IDE highlights the codebase test coverage using color marking. By default, the green color means that a particular line was covered, and the red color means the uncovered line of code.

The report shows coverage for the lines that implement the logic of a method, function, or a class, but not for the function, method, or class declaration. The image below shows that code coverage is not applicable to line 7, while line 8 is not covered.
