What’s New in Rider
Rider 2020.3 brings the long-awaited support for new .NET 5, C# 9, and F# 5 features. We’ve also introduced new features such as Immediate Window and Private Source Link in the debugger, Project Dependency Diagrams, Push-to-Hint, and language support for the Avalonia UI framework. Unity developers will find updates to Burst analysis and shader support. And finally, you can drag and drop tabs to split the editor the way you like!
.NET 5 and C# support
Please welcome the first Rider release with .NET 5 support! The support includes Source Generators, C# 9 features, new NuGet features, and new target frameworks (net5.0-windows and net5.0). In addition, you can create, build, run, debug, profile, and cover .NET 5 applications.
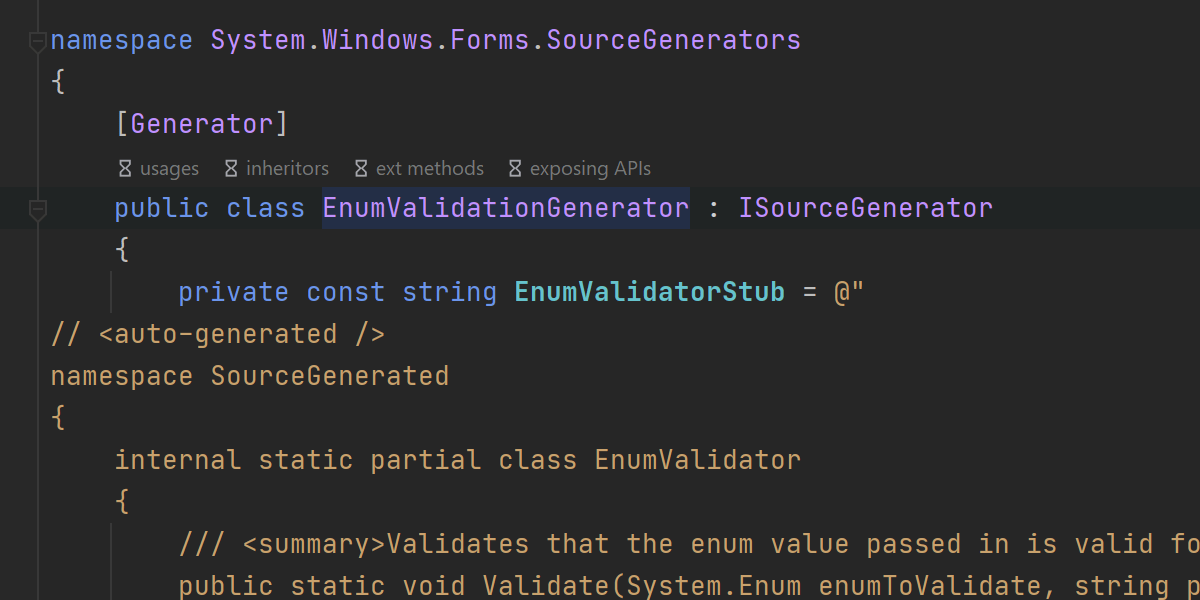
Source Generators are almost certainly the most talked about feature in the C# compiler. It’s understandable: the ability to create new code right in the compilation process and use it immediately is exciting and could be useful in lots of different situations.

What can Rider do here? Well, it can do what it does best and take the generated files into account while performing refactorings, provide code editor features, and help you navigate to the generated code.
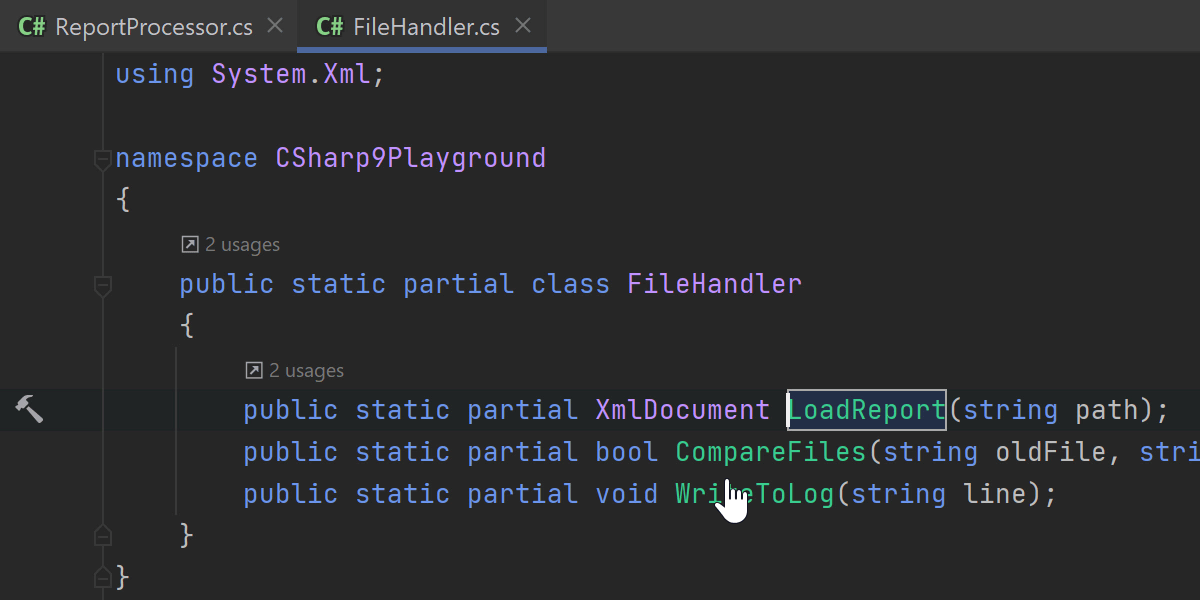
Partial methods are now allowed to have out parameters, non-void return types, and any type of accessibility, making them more useful with Source Generators. Source Generators can use the defining declaration of the partial method to customize the behavior of the generated code.

Another cool addition is init-only properties. Such properties can only be set during the initialization of an object. So finally you can use object initializers without exposing the property as mutable!
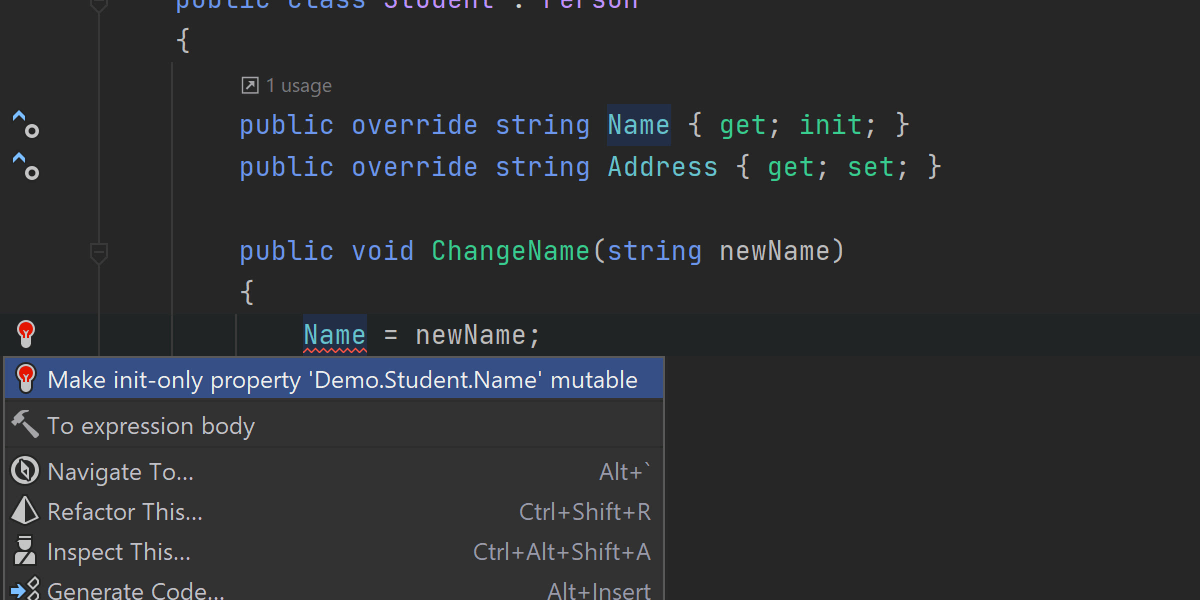
Rider is aware of init-only properties and takes them into account when completing your code, performing generative completion, analyzing whether the property changed anywhere, and offering a quick-fix to make it mutable if you change your mind.
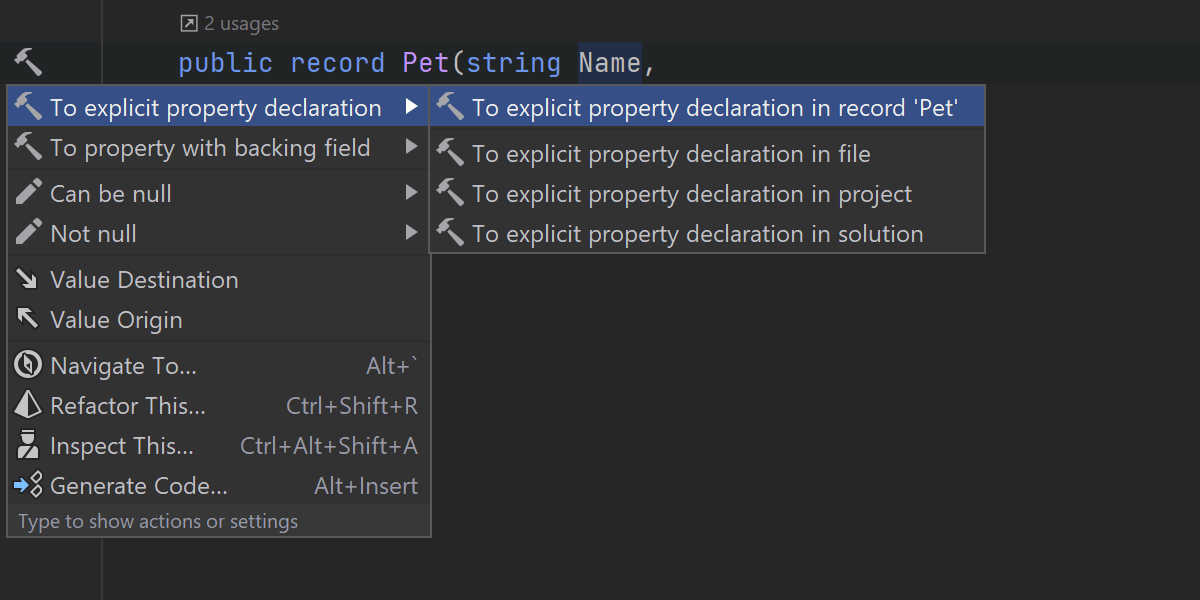
The perfect place to apply init is new record types. These are reference types with value semantics that help you achieve immutability, but this time for the whole object. Again, Rider is keeping up with the language, from quick-fixes for choosing your preferred declaration style to basic completion.
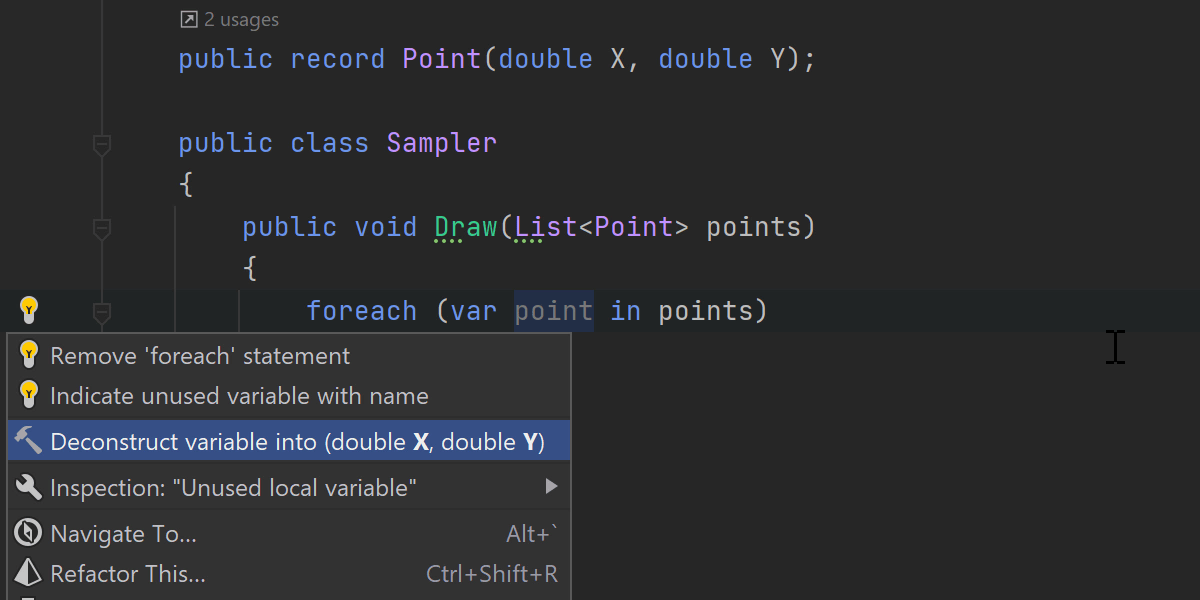
Positional records have a compiler-generated Deconstruct() method. Rider supports all deconstruction features in such objects. Notice the popup when introducing a variable: it offers you the choice between single variable or a deconstructing declaration. The same choice will be offered when a function accesses a property of a record object.
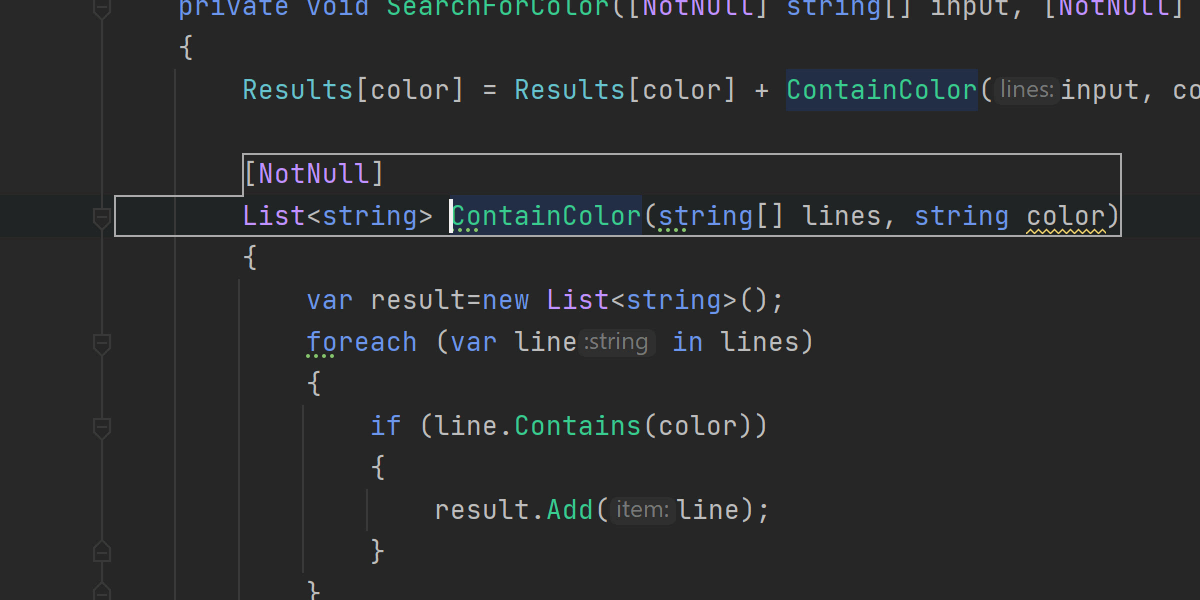
Moving on from the big things, local functions are now permitted to have attributes (as well as parameters and type parameters in local functions). This is supported by Rider quick-fixes, including the neat feature of annotating the method as
[NotNull] or [CanBeNull] by pressing ! or
?, respectively.
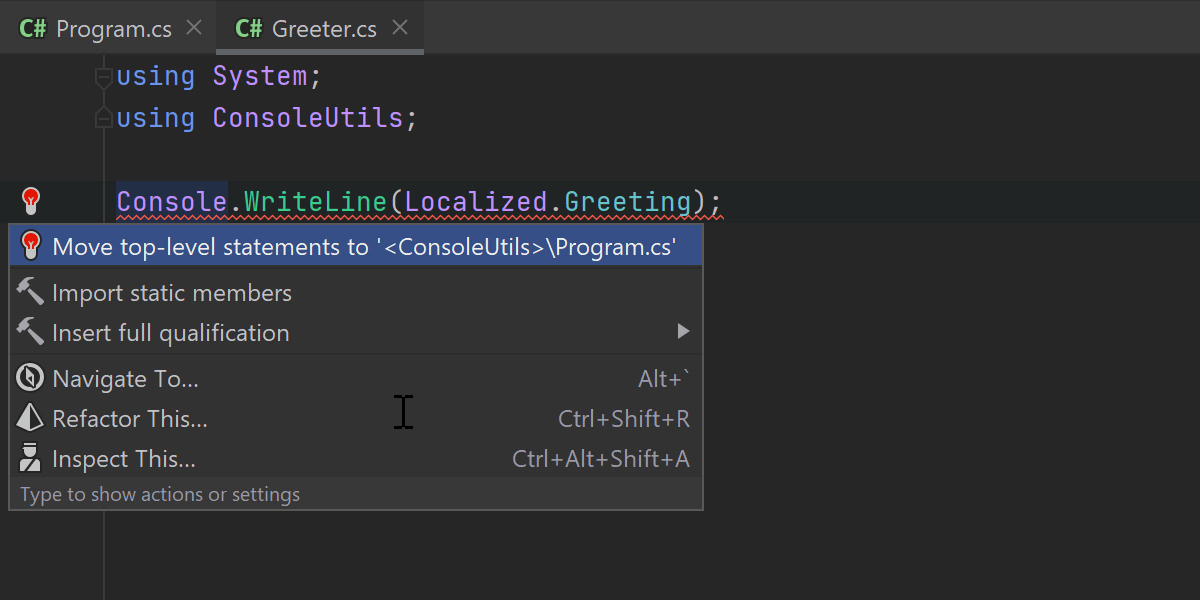
Another useful C# 9 addition is the ability to write top-level programs. No more fighting with Program classes: you can place your entry point code right after the using directives! There is some help available for working with top-level statements as well. There are two rules about top-level statements: they should precede any type or namespace, and only a single file in the project can contain top-level code. Both rules are easy to break when you’re rearranging and copy-pasting code. Rider provides quick-fixes to remedy this by moving your top-level code to the top or to another file.
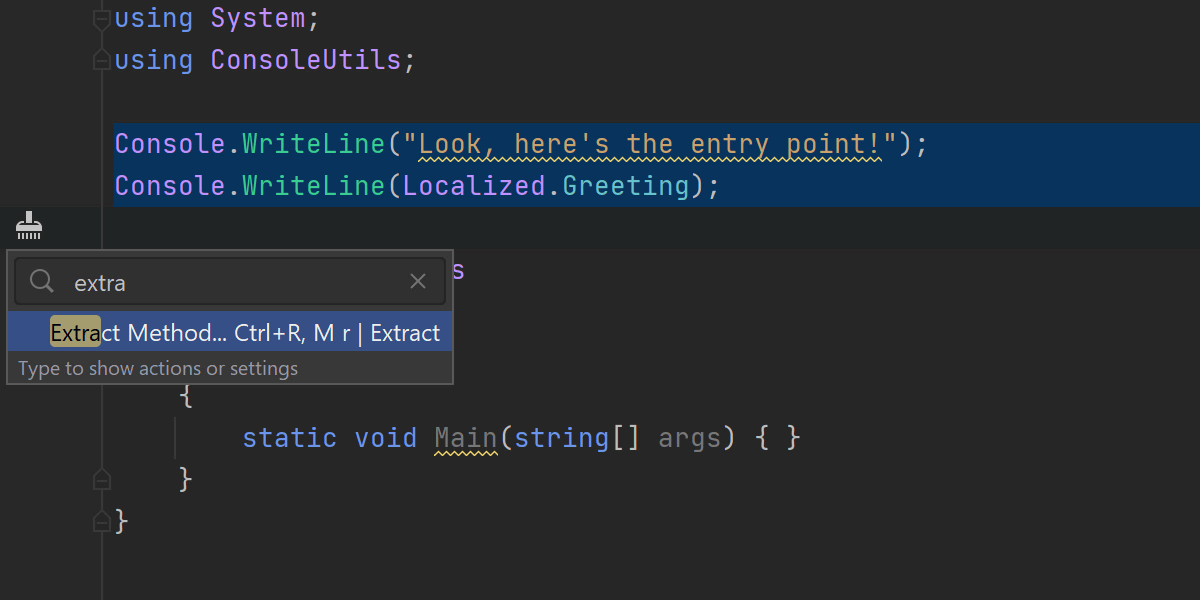
Given that top-level code is also code, there are refactorings for it as well: Extract local variable and Extract method refactorings.
Learn more: C# 9 Top-level Statements In ReSharper and Rider
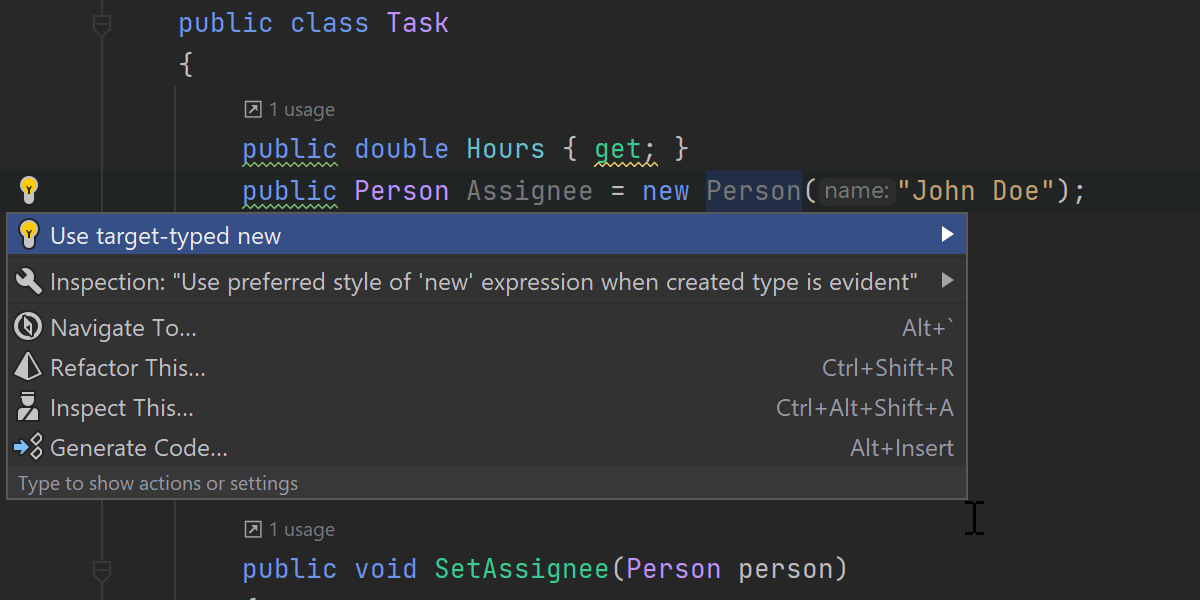
With target-typed new expressions in C# 9 we can omit the type after the new keyword when it can be inferred from the usage context. Rider provides full support for the feature including the ability to Find Usages of the constructor and configure preferred syntax style. The latter allows you to use
new() syntax when a created type is evident while enforcing an explicit type specification in other cases.
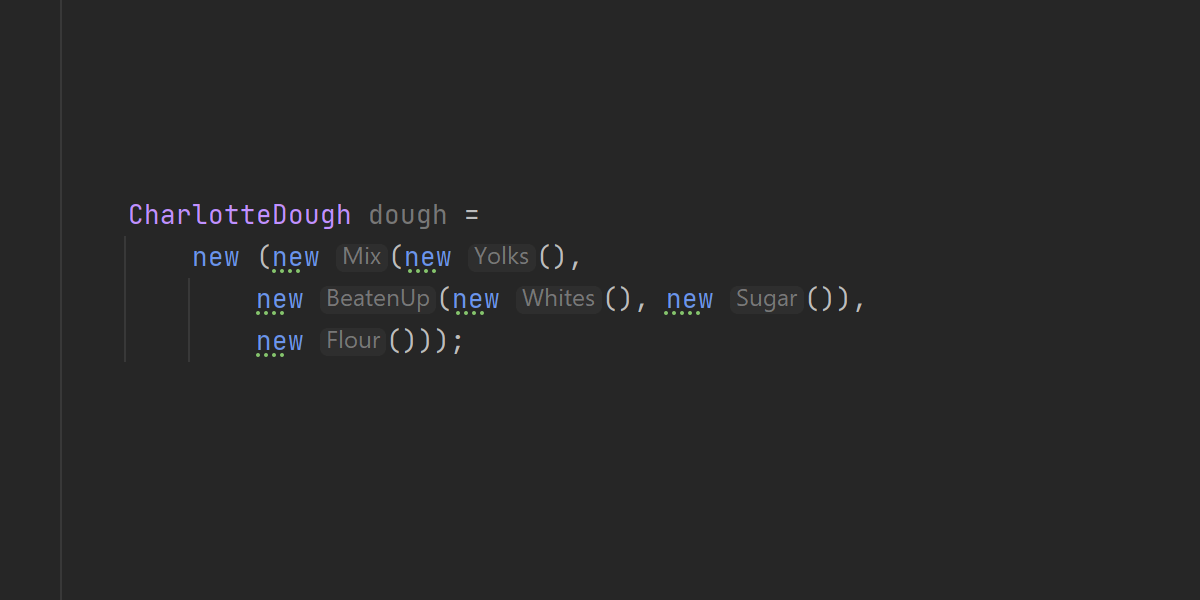
By the way, Rider’s new (pun intended) type name hints can help if all the new() in your code gets out of control.
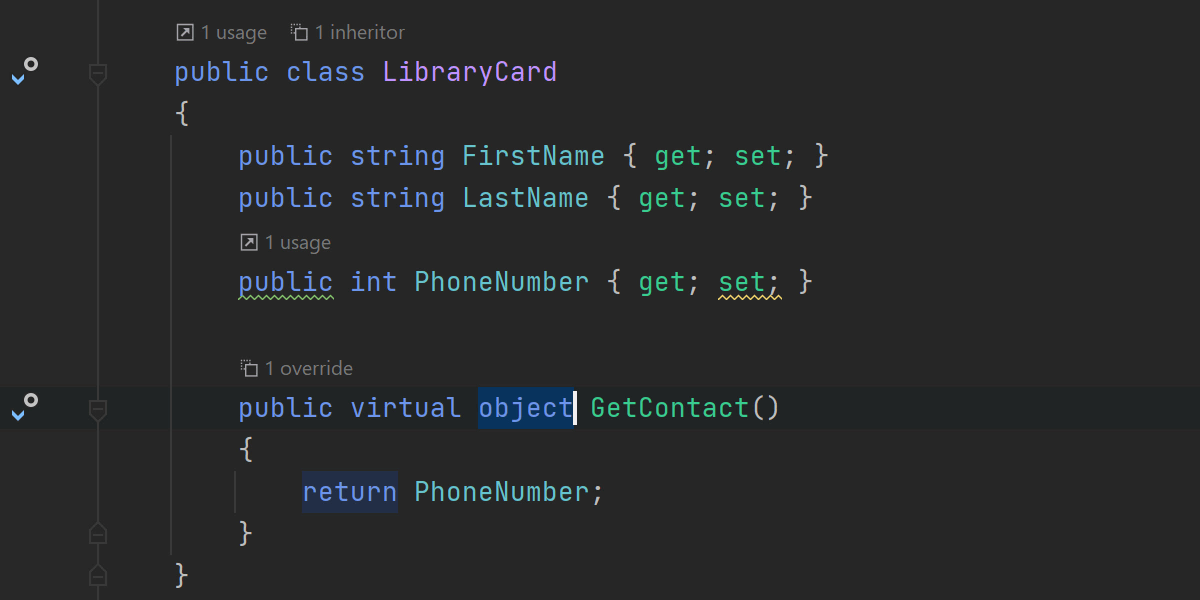
With return type covariance, you’re no longer bound to returning the same type in overriding members as you do in the base class method. There is no longer any need to implement workarounds to return a more specific type.

Pattern matching continues to evolve in the new language version. Matching expressions now allow using relational (<,
>, etc.) and logical (not, or, and) patterns, cutting out a lot of the verbosity of the old
switch constructs. Rider can assist you with analyzing the patterns and rewriting them in the desired style.

Finally, when lambda discard parameters were introduced, we felt it would be nice to add a quick-fix for them.
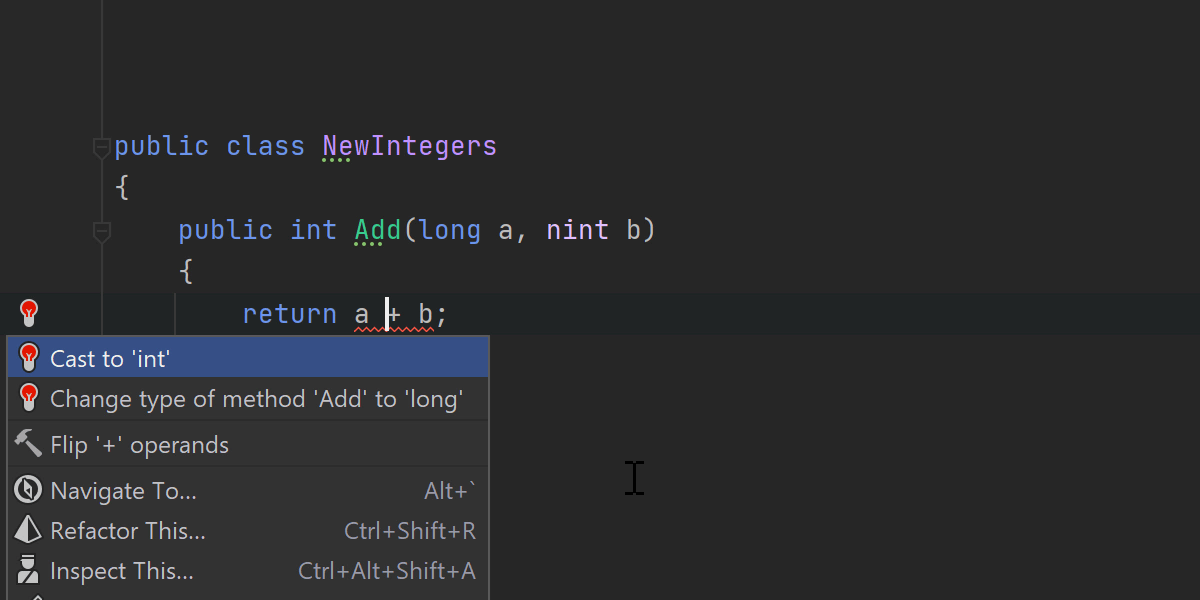
That’s about it for the major language highlights. There are smaller improvements added to the language that are supported in Rider 2020.3 as well. This includes target-typed conditional expressions, static lambdas, extension
GetEnumerator methods in foreach, function pointer types, and native integer types.
Debugger
Immediate Window
Introducing a new Immediate Window with code assistance. It allows you to create synthetic variables when the program stops on a breakpoint, and to experiment with your code without restarting the debugger.

When you start a debugging session, the Immediate Window appears on the bottom-right, below the watch variables within the debugger pane. It will accept input only when your application is in a paused state, typically when it has reached a breakpoint.
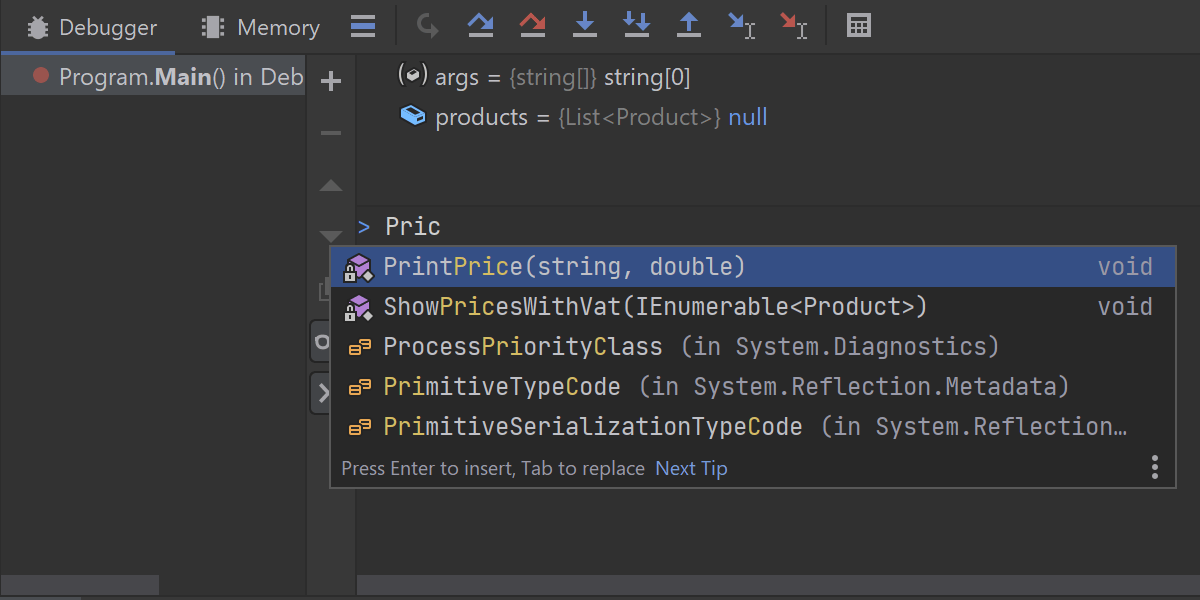
Type any valid C# code, with the full range of code completion features at our disposal.
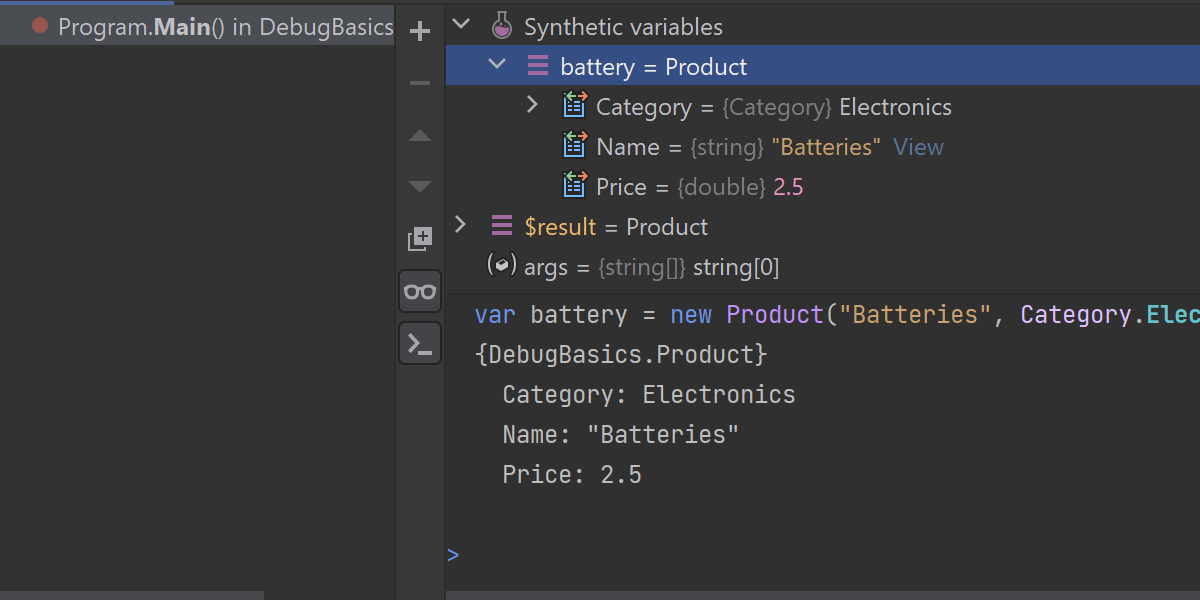
Define new synthetic variables. Rider will track those values in the variables window under a synthetic variables collection. You can inspect, pin, and modify those variables like you do any other variables.
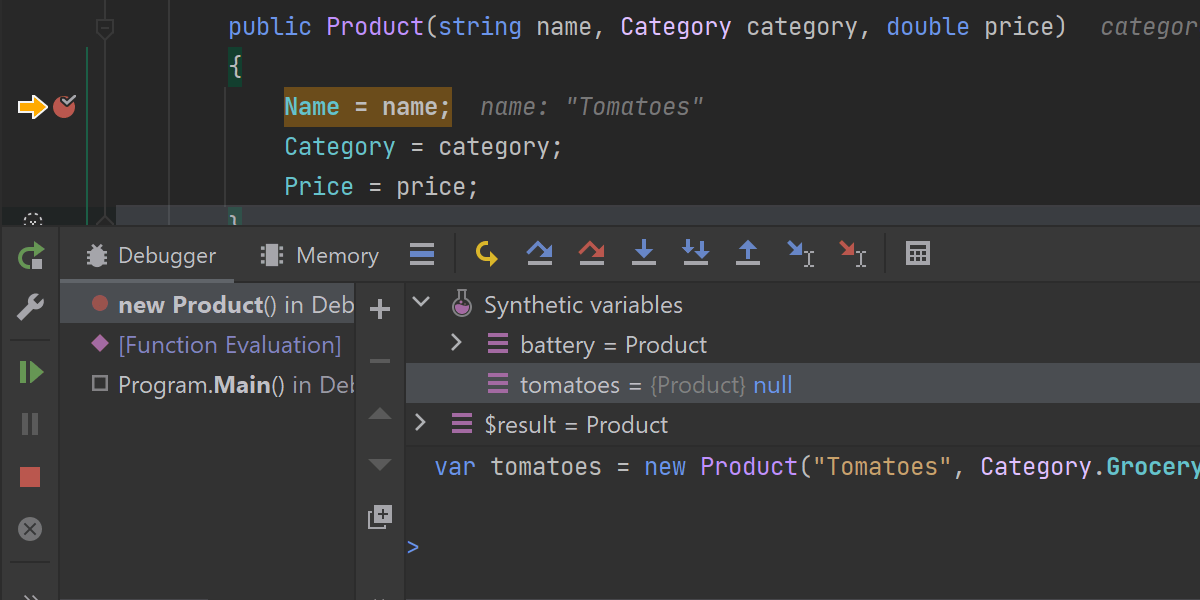
You can even call any member functions on the available objects or any static functions available in the current context using any available objects as arguments. Breakpoints on the execution path of the function will suspend the execution as if it was a normal call. The call will have its own part of the stack starting with Function Evaluation, which you can explore in the Frames panel.

Execute statements without needing to assign them to any variables. Rider will record the last returned value from a run statement under the $result placeholder. The Immediate Window will track the history of all of your statements.
Learn more: Immediate Window – Interact with your Code while Debugging in Rider
New actions
New debugger actions are now available when debugging hasn't started.

Right now, you don’t have to start debugging and navigate through several steps to the method or a place in code you’re interested in. If you use Start Debugging and Run to Here or Start Debugging and Run to Here Non-Stop, Rider will take you there, skipping any breakpoints.
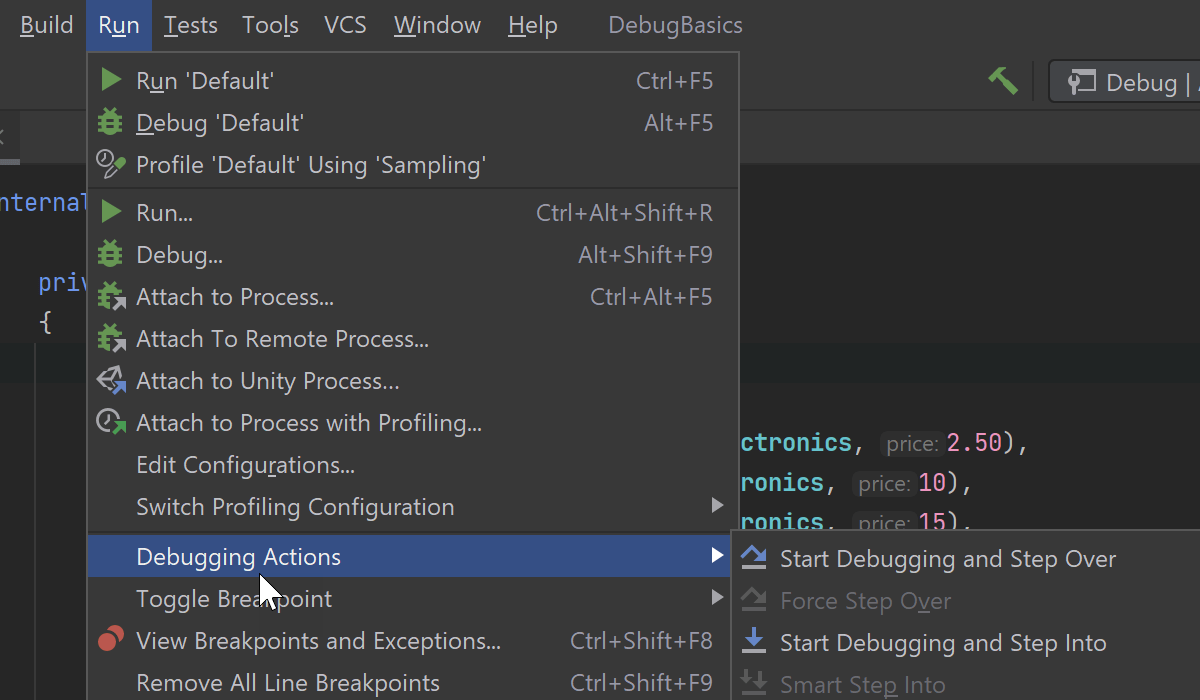
If you want to start debugging your application and stop the execution right in the beginning, as soon as it reaches the application entry point, use the Start Debugging and Step Over or Start Debugging and Step Into actions.
You can find these actions under Run | Debugging Actions in the main menu.
Please note that the actions mentioned above are only available for the .NET Project configuration / .NET Static Method.
Private Source Link

Great news for anyone familiar with the term “Private Source Link” – Rider 2020.3 now provides full support for private source servers in both the debugger and the embedded decompiler. Rider supports sources located on GitHub, GitHub Enterprise, BitBucket, and Azure DevOps (former VSTS).


Rider can save authentication credentials for easy future access.
Other debugger updates
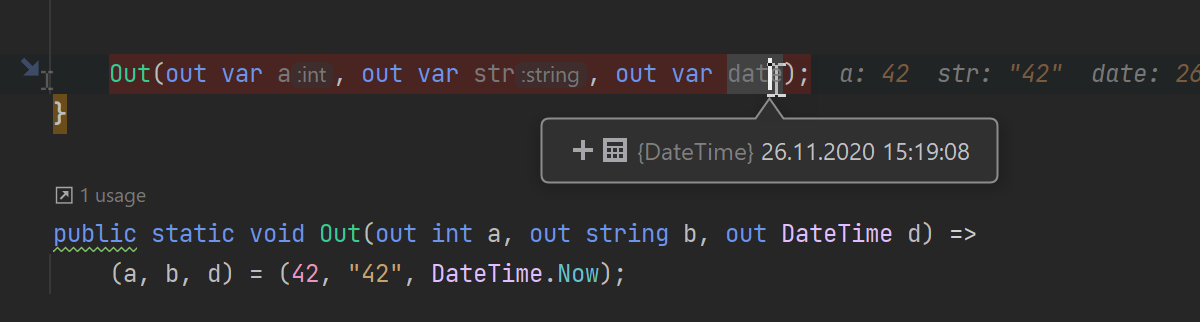
- We’ve implemented evaluation of methods that have out and ref parameters or declare out variables in the parameter list.
- We've significantly sped up the enumeration of IEnumerable sequences.
- The ‘View’ link is now displayed correctly for objects with very long presentations.
- Long strings are no longer truncated when you copy their values, and their evaluation has been optimized.
Project Dependency Diagram
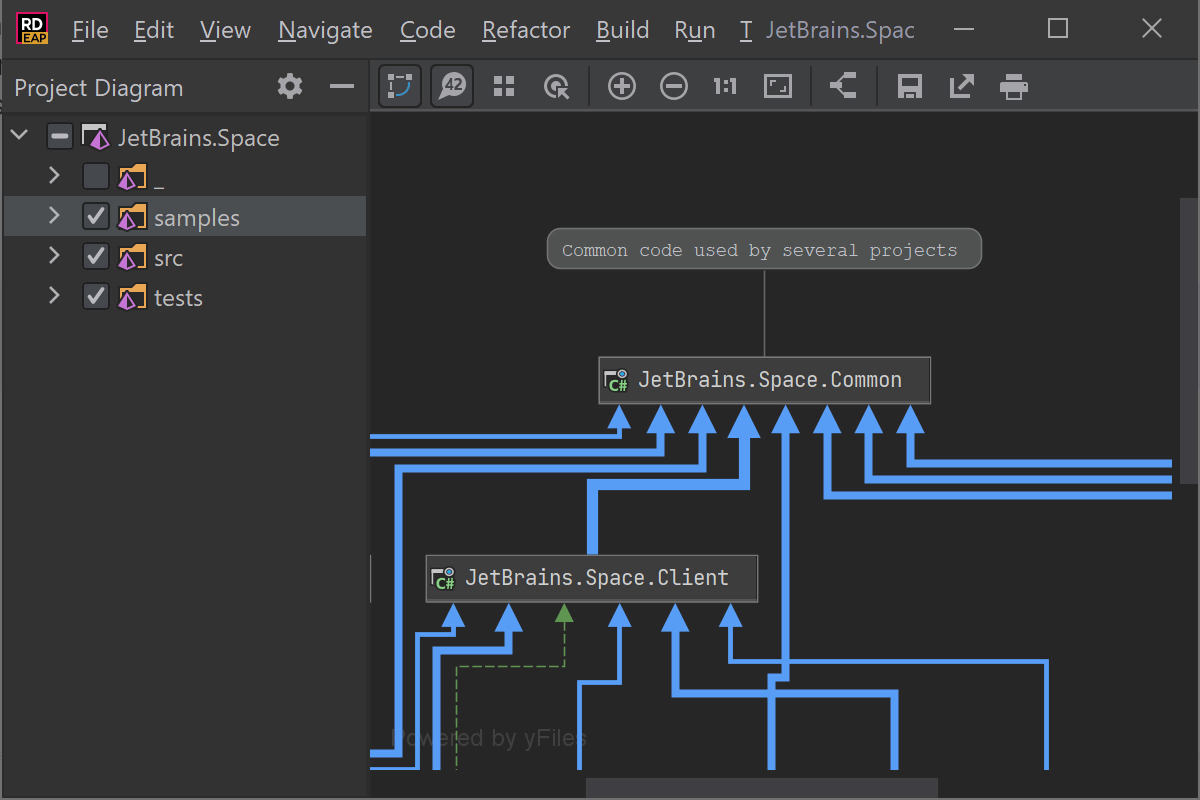
Our new architecture tool helps you visualize project dependencies in your solution and explore its architecture.
Explore the diagram
You can open the project dependency diagram from Tools | Architecture | Show Project Diagram or from the context menu in the Solution Explorer. It follows your solution structure, and starts by showing all top-level items in your solution. You can select which projects or solution folders should be visible, change the scale, enable a grid (and the snap to grid option, if needed), and add notes to annotate certain projects.
Navigation
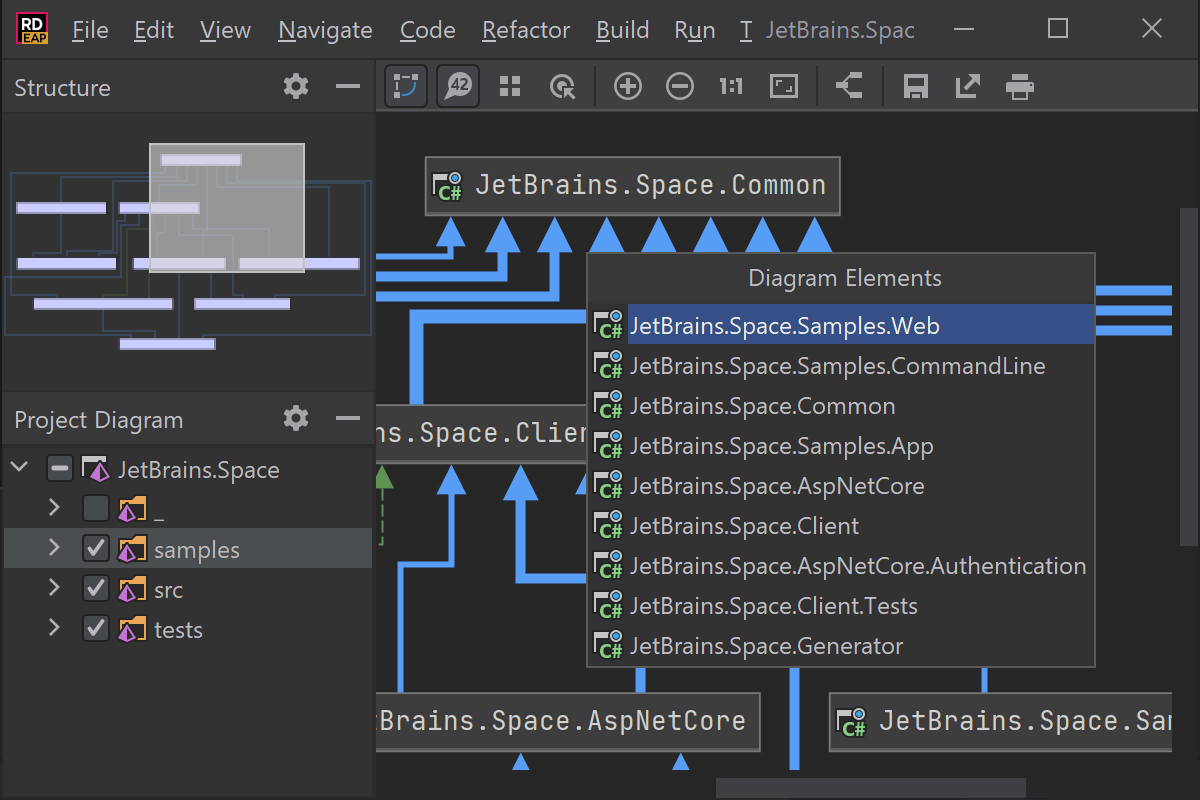
Use Ctrl+F on Windows or Cmd+F on macOS to find the project you want to focus on.
The Show Neighbors of Selected Nodes toolbar button filters the project dependency diagram to the selected node, its direct dependencies, and the projects that depend on this project.
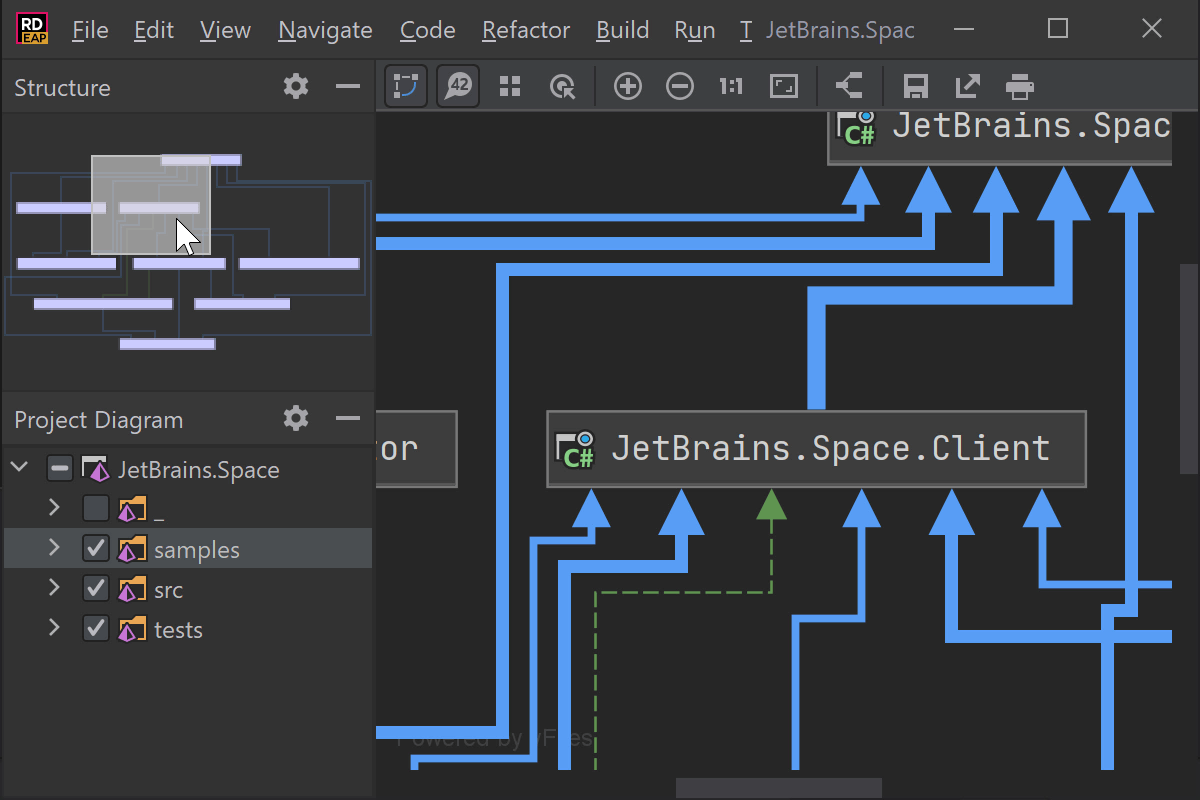
For large project dependency diagrams, you can open the File Structure tool window (View
| Tool Windows | Structure) and pan around using a high-level overview.

Analyze coupling between project
Click the Enable Coupling Analysis icon in the toolbar to perform analysis and update the diagram. The thickness, color, and style of the links can vary depending on how tight the coupling between projects is. Hover the link and Rider will display a tooltip with the exact number of usages. Clicking the link will gather details about dependent code and display them in a separate tool window.
In a project dependency diagram, you can also Show Transitive Dependencies. This will render both direct and indirect project dependencies.
Save and compare snapshots
Save a snapshot of the project dependency diagram from the toolbar and then compare
it with the current solution. Use the
Tools | Architecture | Compare With Saved... menu to load and inspect
previously saved snapshots. Rider will highlight the differences between the
diagrams.
Learn more: Project Dependency Diagrams come to Rider 2020.3
Export diagrams
From the toolbar, you can export the diagram as an image and include it in your documentation.
Game Development
Unity
Rider 2020.3 brings another great release for our Unity support, with updates to Burst analysis, shader support, and unit testing, as well as a handful of helpful fixes.
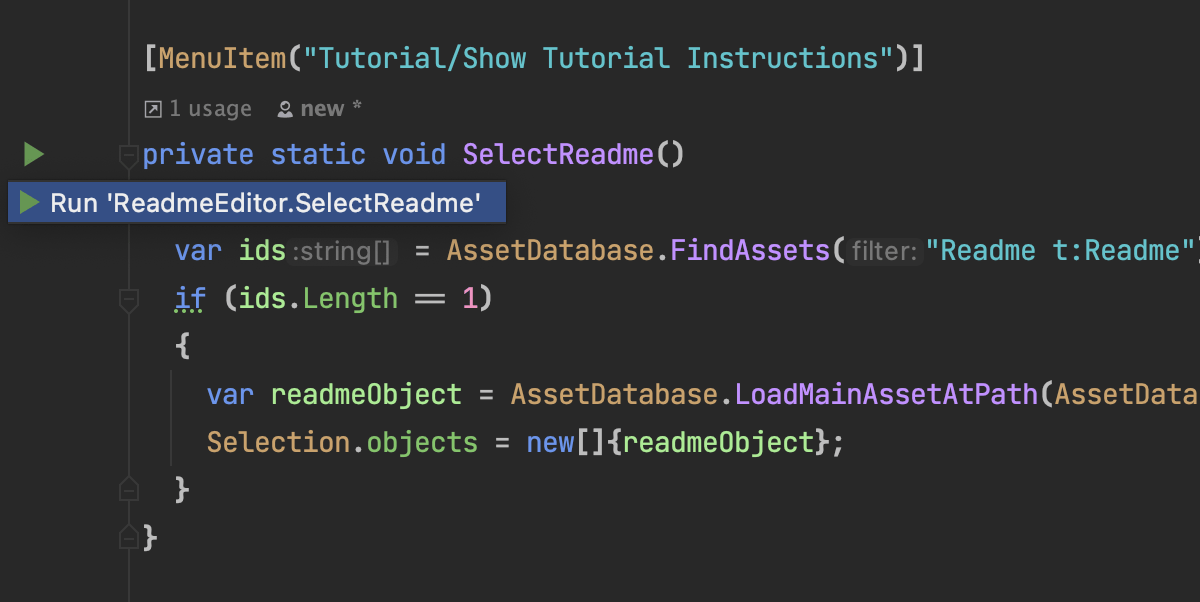
Click the icon next to any method marked with Unity’s [MenuItem] attribute, and Rider will tell Unity to invoke the method, right from the IDE.
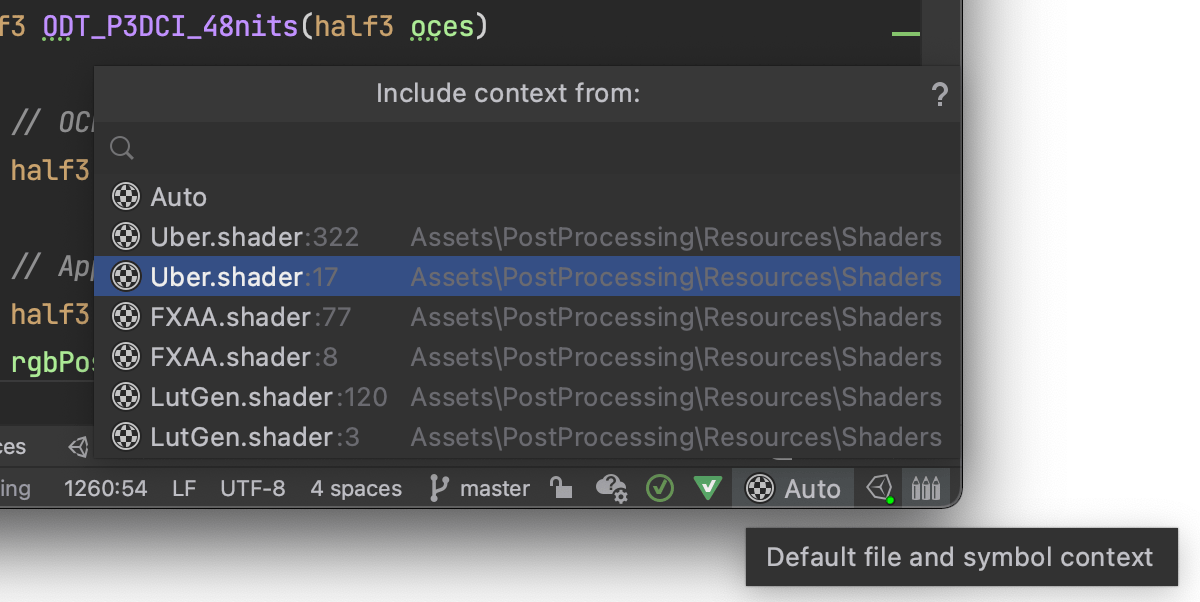
Rider’s smart support for shaders gets an upgrade, automatically using define symbols from pragmas such as shader_feature and target when analyzing the code. There is a new context picker in the status bar to analyze a shader based on the symbols defined in the location it was included from.
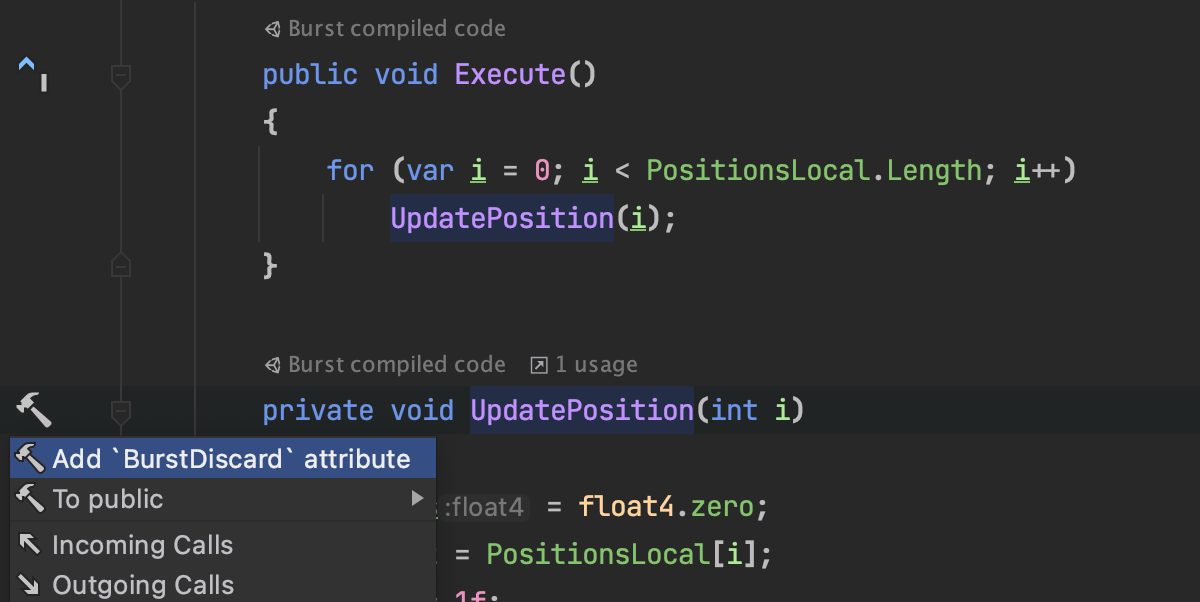
We’ve improved the Burst context analysis with a new Code Vision indicator and new warnings for incorrect SharedStatic usage. You can also use the
Alt+Enter menu to quickly add a [BurstDiscard] attribute.
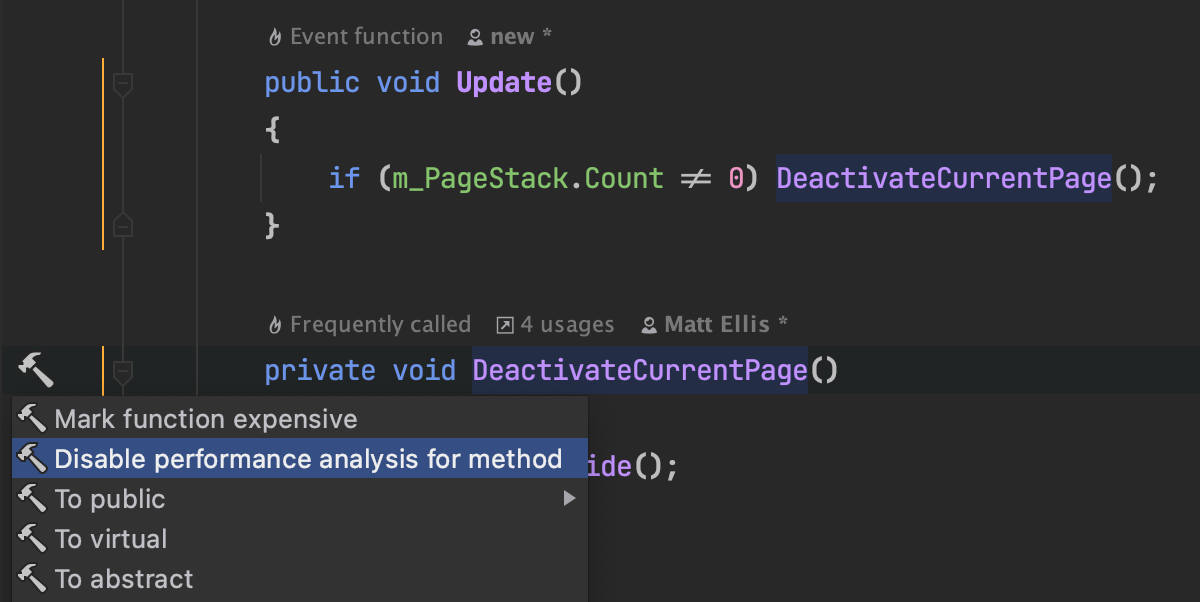
New context actions allow better control of the analysis of performance-critical methods such as Update. You can now tell Rider to stop treating a method as frequently called, or stop highlighting a method as expensive, and you can even start a new performance context from an arbitrary method.
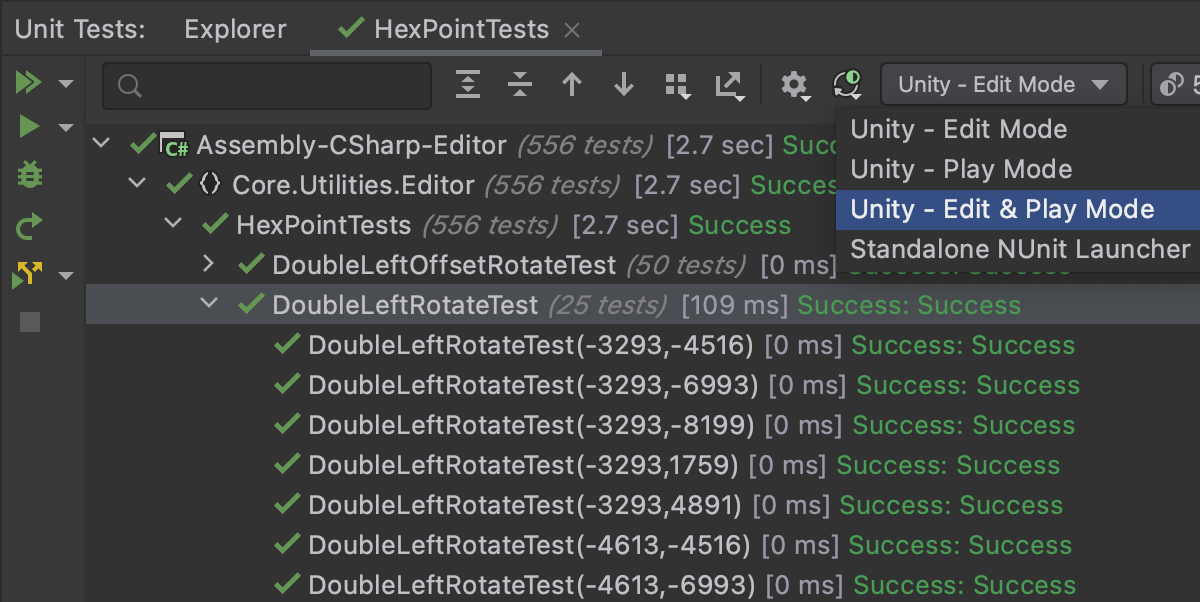
Unit testing gets some great new updates, too, with support for the
[Explicit] attribute, and parameterized test features. You can also run both edit and play mode tests in a single test run.
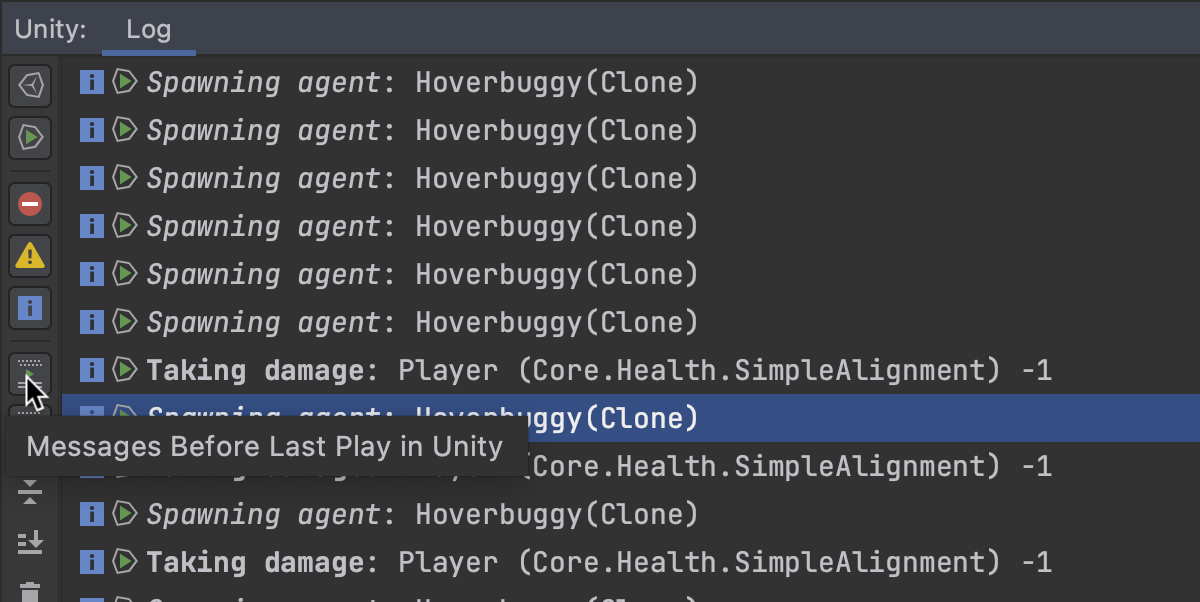
The Unity log viewer tool window has been given some useful UI improvements, notably the ability to filter based on the last time you switched the game to play mode, or the last time the game’s AppDomain was reloaded.
And of course, we’ve fixed a number of issues, including a fix for an infinite “refreshing solution” message when not connected to the Unity editor and a new quick-fix to remove a redundant event message. We’ve also resolved incorrect C# language suggestions for player projects. Please see the changelog for more details.
Rider for Unreal Engine Early Preview
Rider for Unreal Engine is still at the public preview stage and is scheduled for release as part of Rider in 2021. You can evaluate the preview for free until the public release.
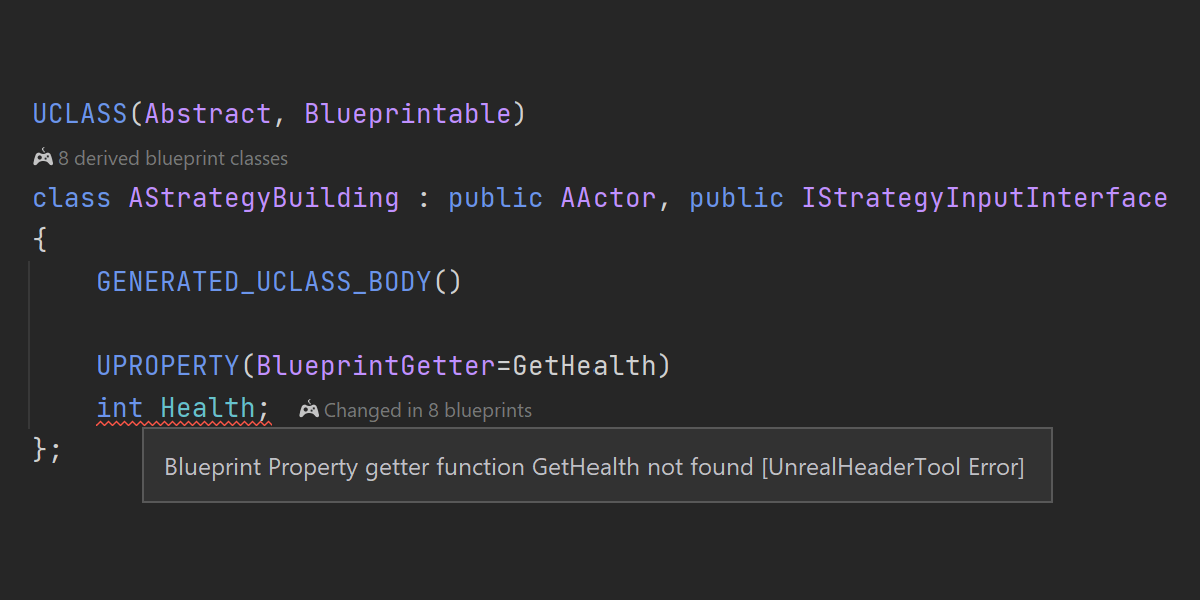
Rider for Unreal Engine provides seamless integration with UnrealHeaderTool to help you catch more Unreal Engine specific code issues right in the editor. When working with an Unreal Engine project, it will automatically run UnrealHeaderTool on the file you’re editing and display any errors or warnings, just like for other inspections.
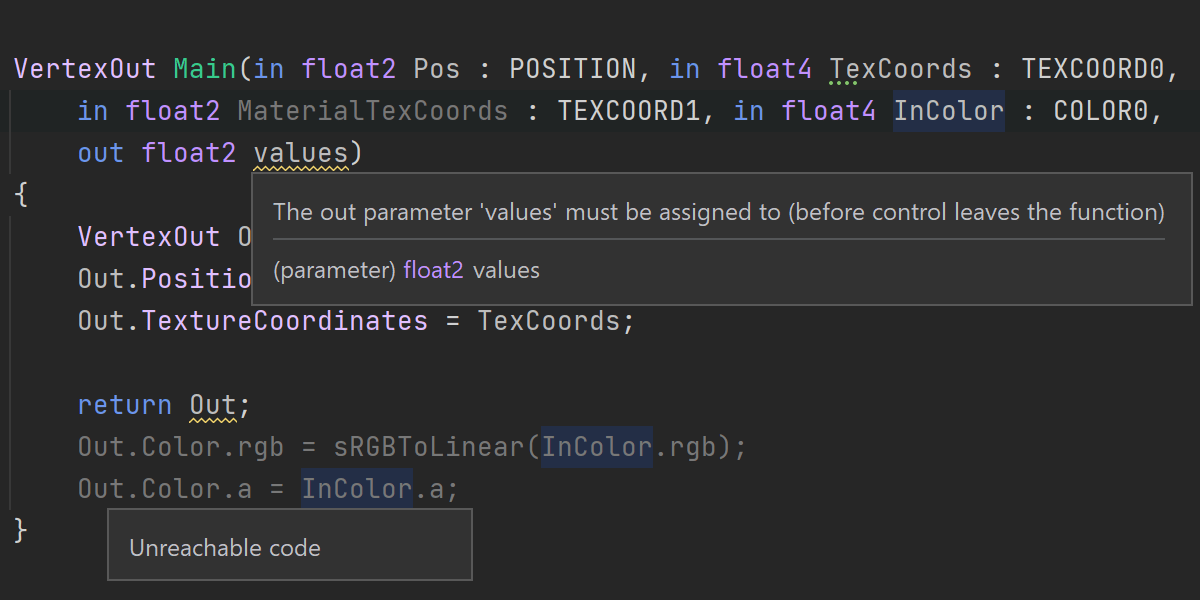
The full power of control-flow analysis now comes to HLSL shader files. It warns you about unreachable code, uninitialized variables, redundant control flow jumps and conditional branches, and so on. In the main Rider, the same analysis is enabled for Unity shaders in v2020.3.
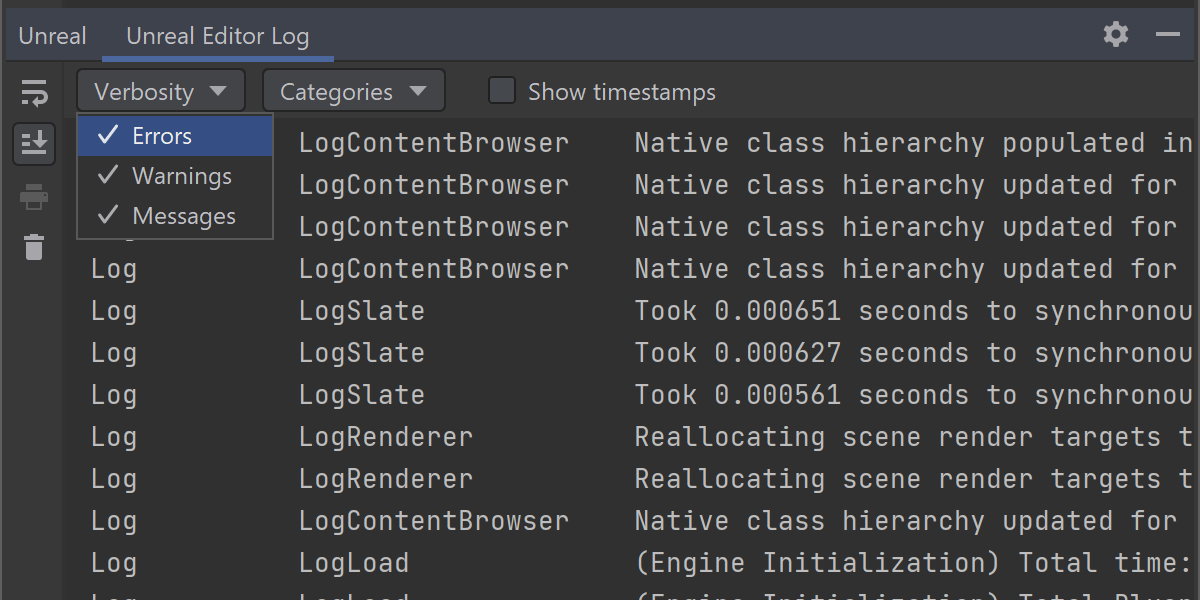
We’ve added filters to the Unreal Log, so Rider for Unreal Engine now lets you filter by Verbosity and Category, and you can show or hide timestamps. We’ve fixed an issue with the UI freezing when there are too many messages in the Unreal log panel.
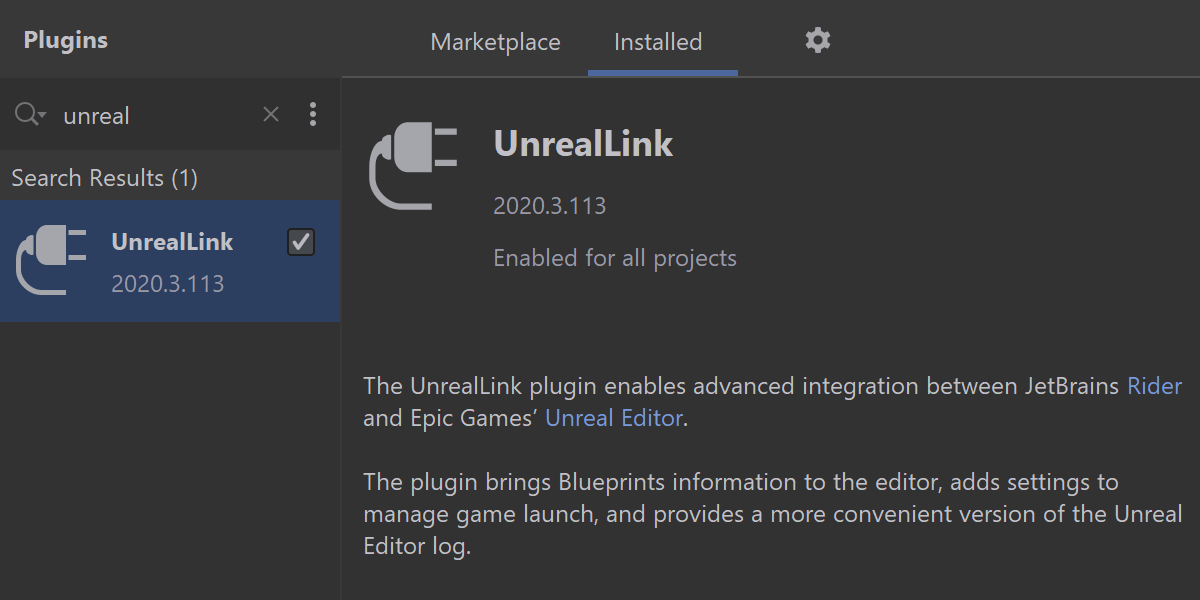
The UnrealLink/RiderLink plugin enables advanced integration between JetBrains Rider and Epic Games’ Unreal Editor. It is now hosted on JetBrains Marketplace and can be updated independently of the product build.
F# Support
F# 5 features
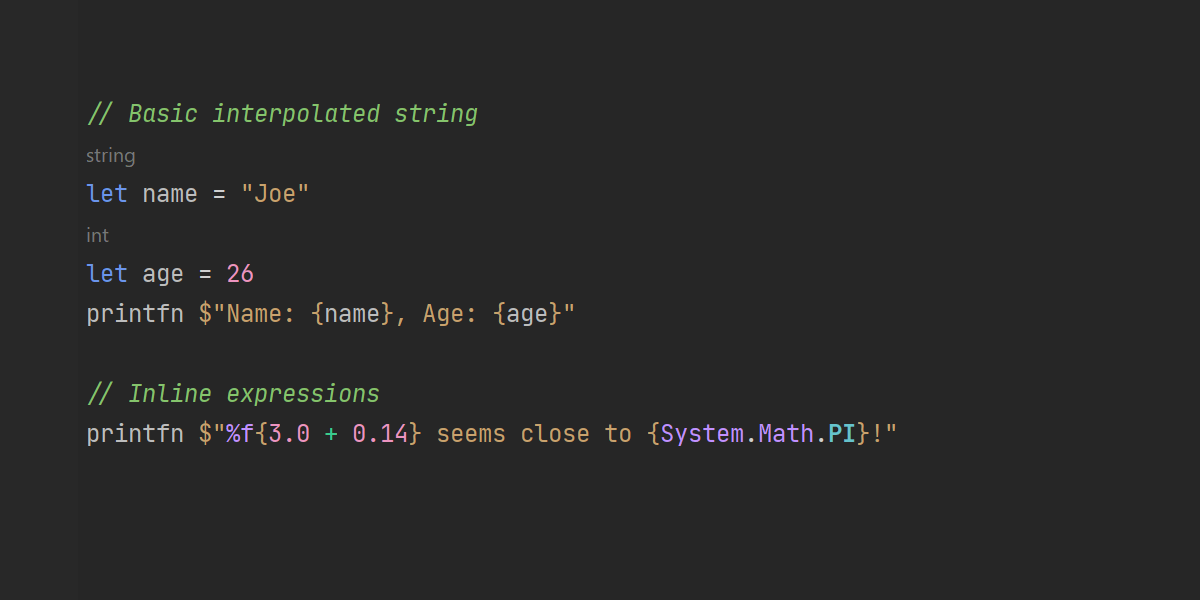
We’ve introduced support for the new string interpolation syntax. Now you can mark a string with the
$ symbol to make it interpolated and then put placeholders inside of the string literal. The “typed interpolations” syntax (%s and
%d) for placeholders is also supported.
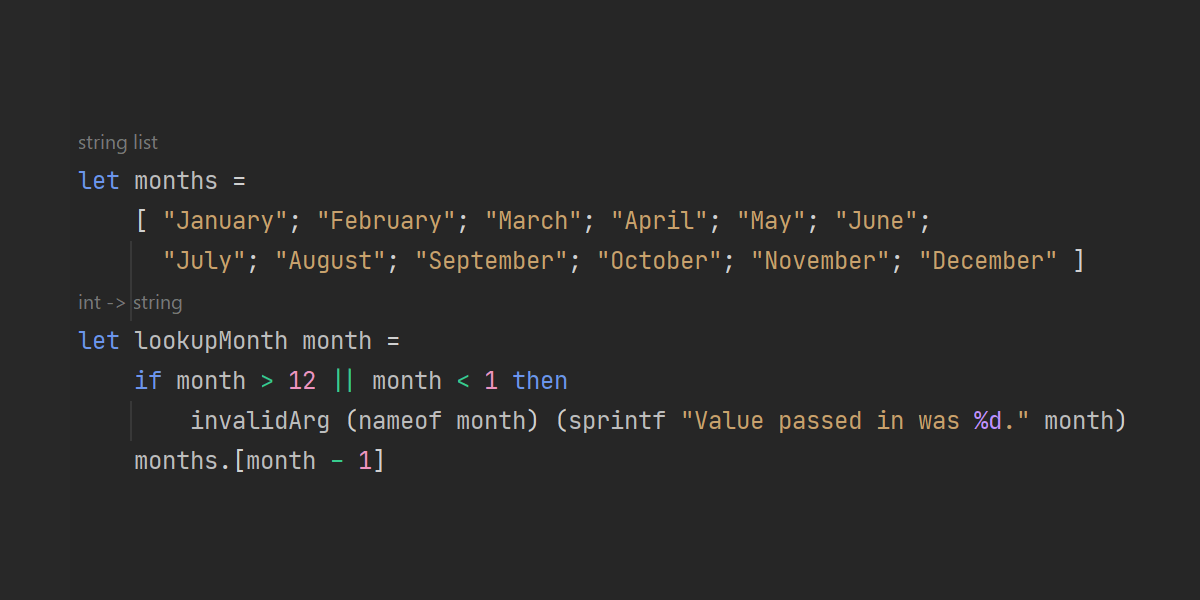
This release adds support for the nameof keyword which helps you convert almost any symbol in F# to its name.
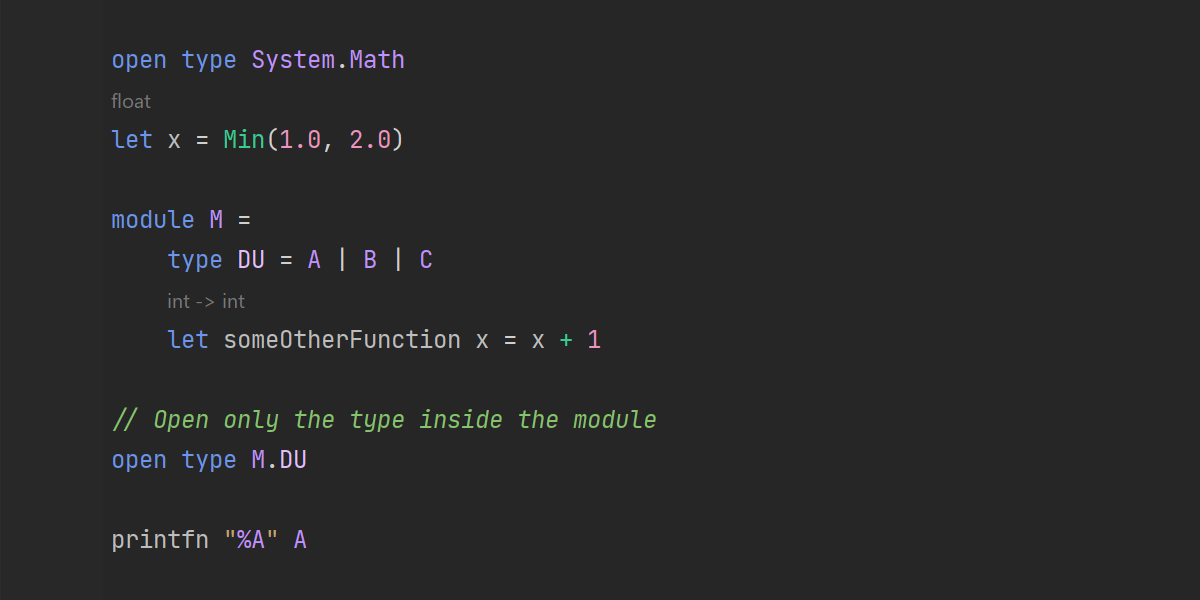
Last but not least, open type declarations are now supported too. Using the open type declaration, you can “open” any type to import static content stored inside of the type.
Other features and improvements
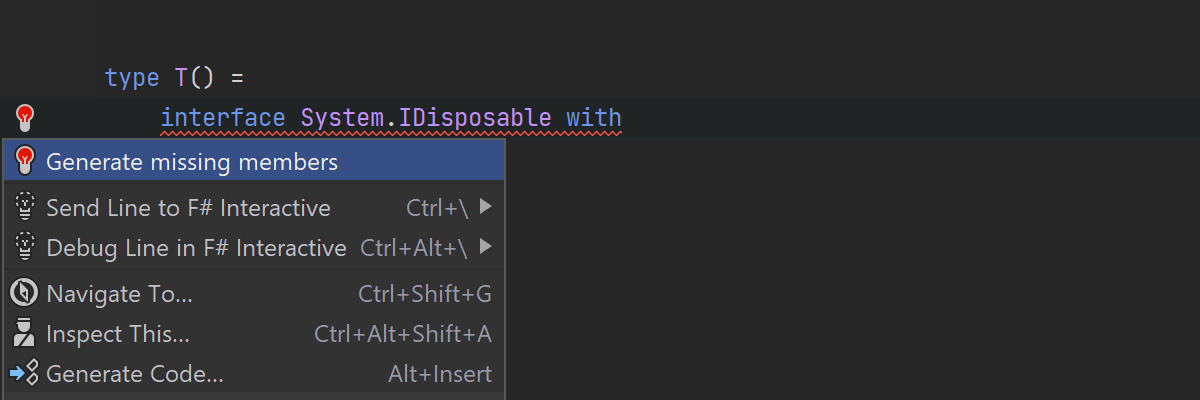
Now you can generate missing overrides in types and interface implementations, using both quick-fixes and context actions. Thanks to Matt for the idea and initial implementation!
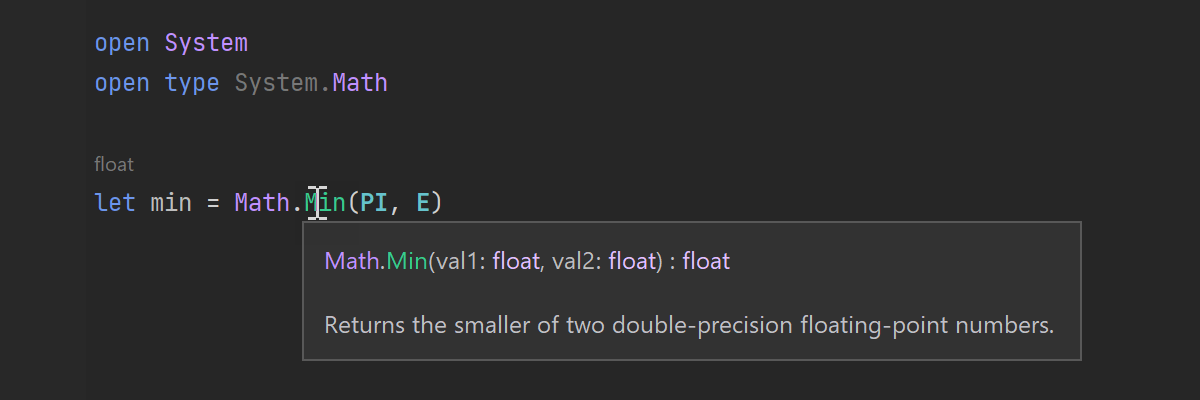
There are new syntax-highlighted tooltips to improve code readability. We’d like to thank Saul for the nice implementation.

New context actions to annotate let binding types. Again, special thanks goes to Matt.

We’ve added the ability to configure severities of analyzers provided by the ReSharper backend. Please note that most warnings / errors are still produced by FCS.
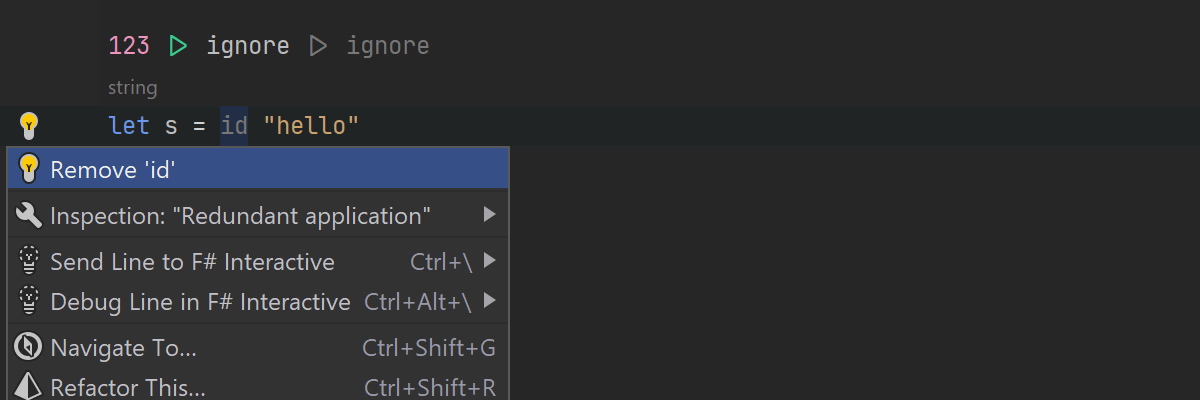
New analyzers and quick-fixes:
- Lambda can be simplified or replaced with a built-in function analyzer.
- Redundant applications analyzer, e.g. to remove a redundant Ignore call if there is nothing to ignore.
- Redundant patterns analyzer to improve your code style.
- A quick-fix to convert a namespace to a module.
Typing assist:
- Better Enter behavior in method invocations.
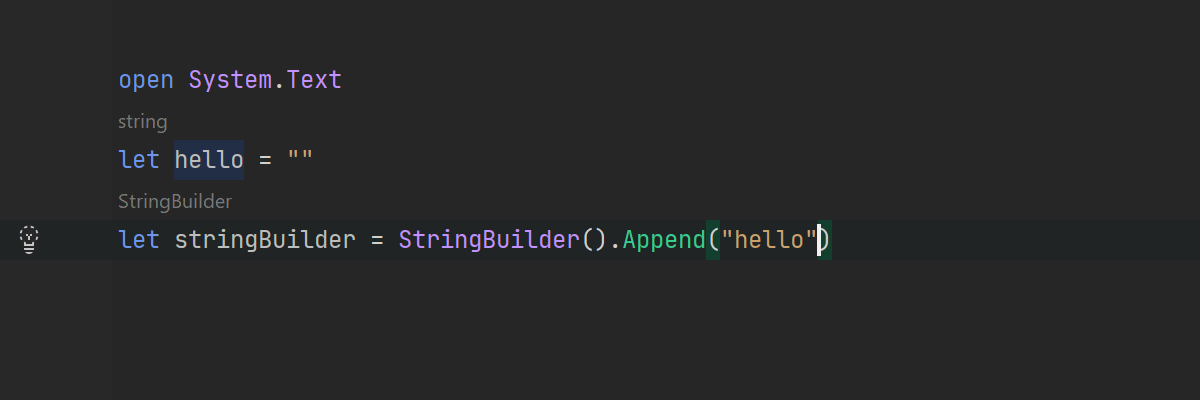
- Supporting new “Surround with Quotes”.
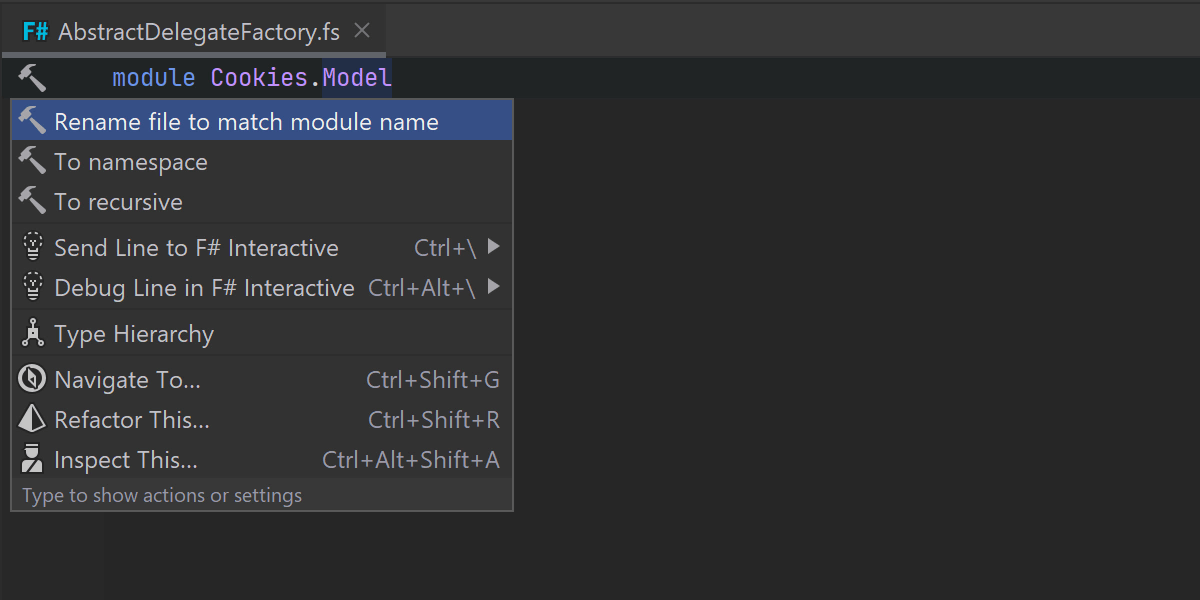
There is now an action to rename files to match a module / type name.
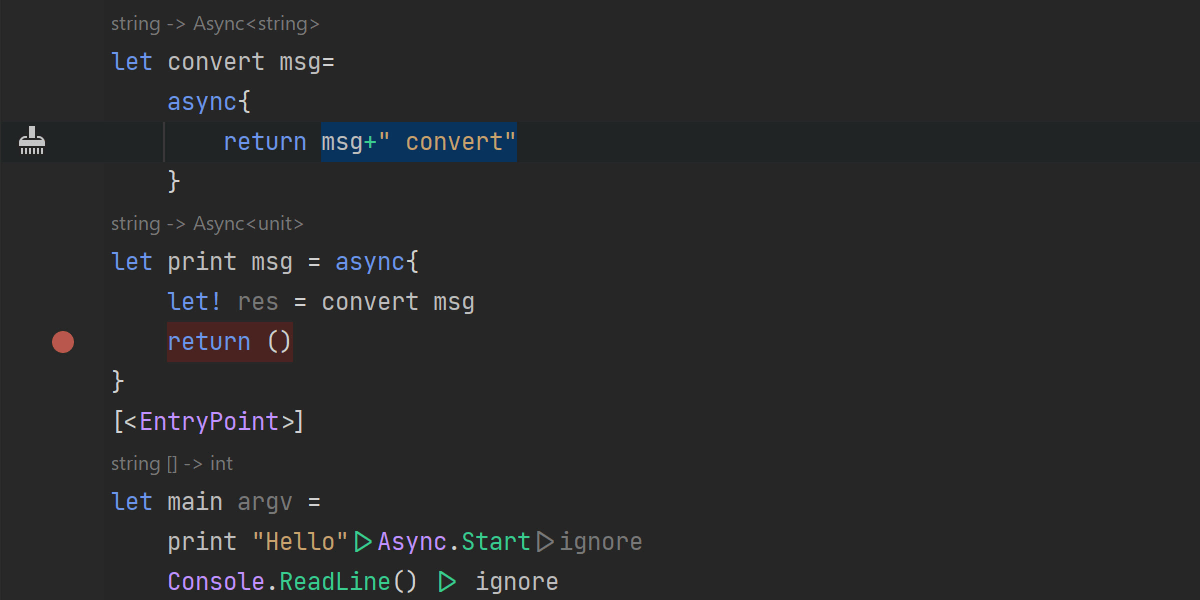
The debugger now keeps better track of local variables in async workflows.
UI/UX Improvements

New Welcome screen
We’ve redesigned the Welcome screen to make it clearer and more modern. It still has exactly the same functionality, but it is better organized. You can still manage your projects, start tutorials to learn something new about Rider, create new solutions, open existing solutions, or get a solution from VCS.
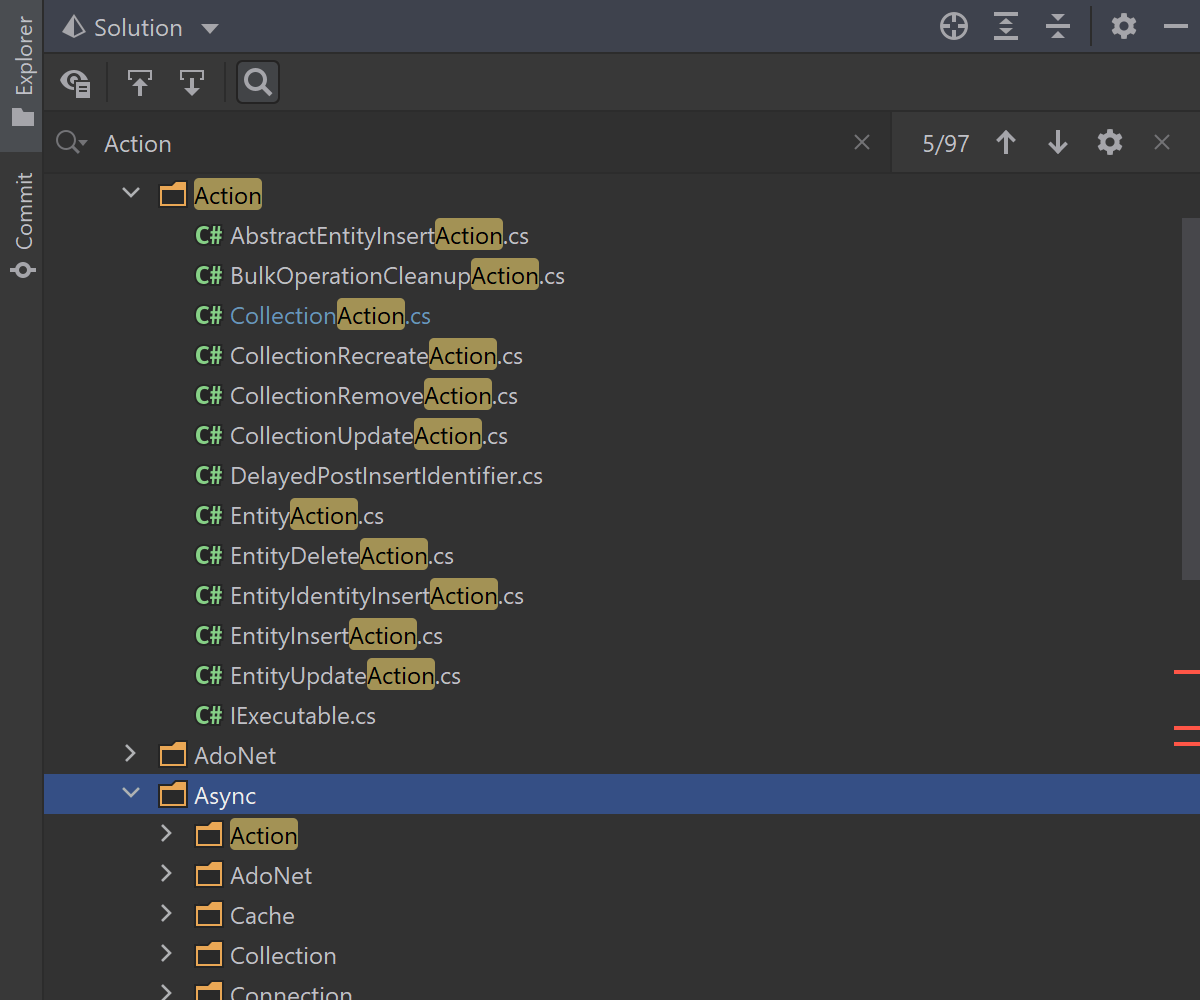
Search in Solution Explorer
The “true” search comes to the Solution Explorer view! It looks through all the nodes in the solution tree (now even in collapsed nodes) including files, folders, projects, references, analyzers, imports, and packages to give you all occurrences of a search query. You can go through them one by one using keyboard shortcuts or the icons on the toolbar. To open the search field, use the Ctrl+F shortcut or the magnifying glass icon on the toolbar.
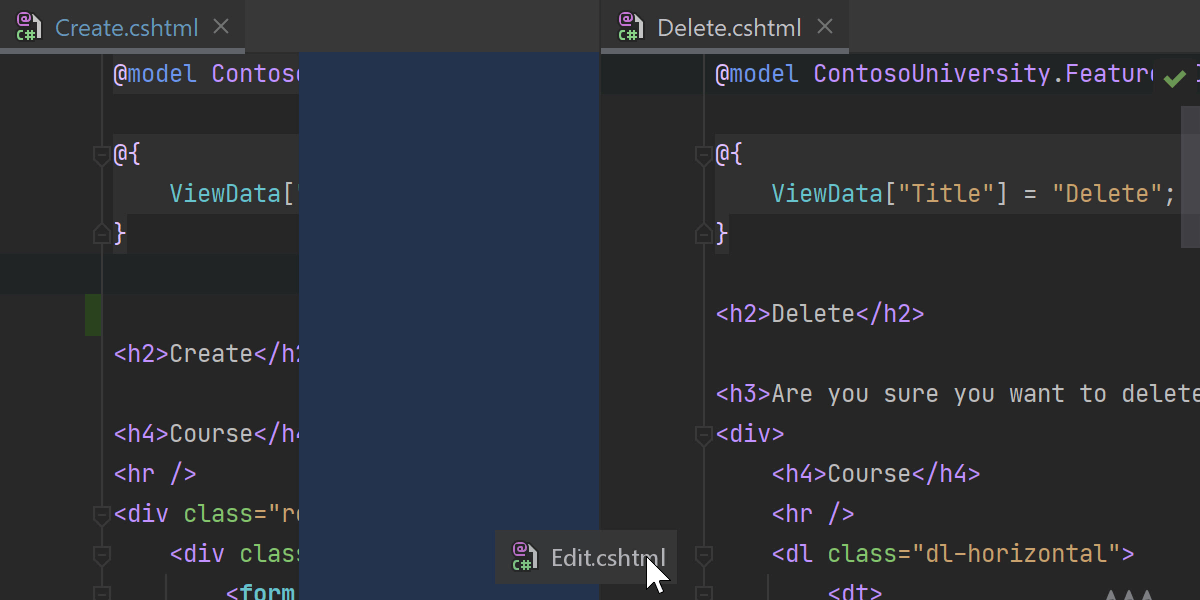
Drag and drop tabs
If you want to have several tabs open while working on a project, you can now drag and drop file tabs to split the editor either horizontally or vertically.
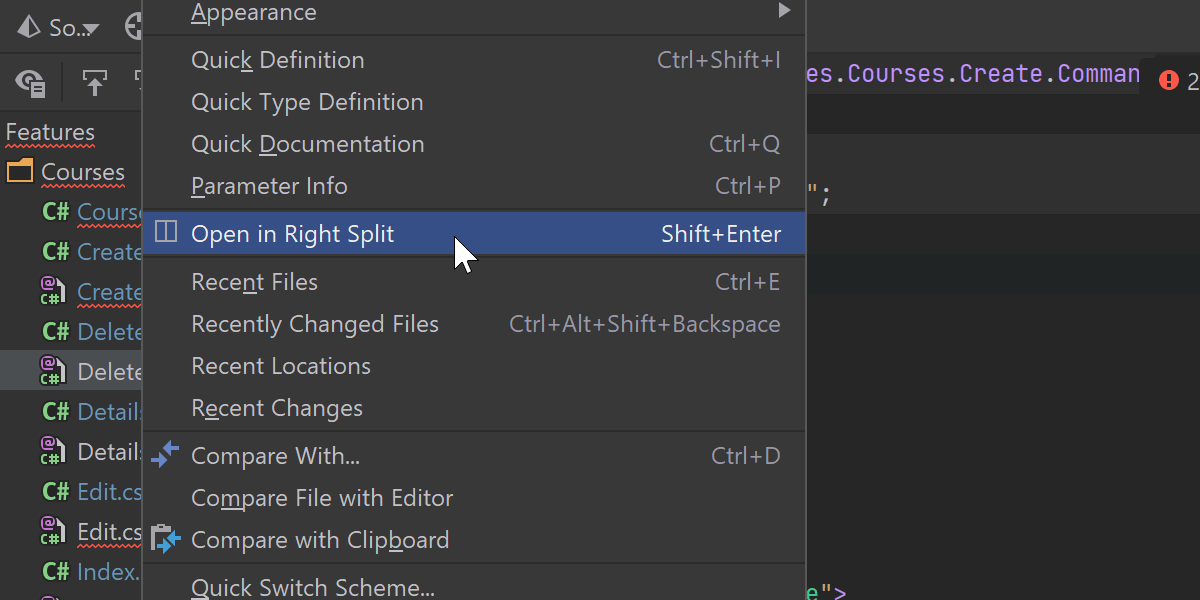
Open in Right Split
We’ve introduced the Open in Right Split action (View | Open in Right
Split or Shift+Enter) for a file that splits the editor vertically upon opening the file. Invoke the action from the
Explorer view or other navigation popups when a file is selected, such as Recent
Files, Search Everywhere, and Navbar.

Pinned tabs
There is a new pin icon for pinned tabs. Clicking on it unpins the file. You can also pin and unpin your tabs by dragging and dropping them over other pinned or unpinned files. If you tend to open a lot of tabs, you can keep all your pinned tabs in one row. To do this, go to
Preferences/Settings | Editor | General | Editor Tabs and tick the Show
pinned tabs in a separate row checkbox.

Syntax highlighting in tooltips
We’ve implemented syntax highlighting in the tooltip popup to make the content inside easier to read and understand.
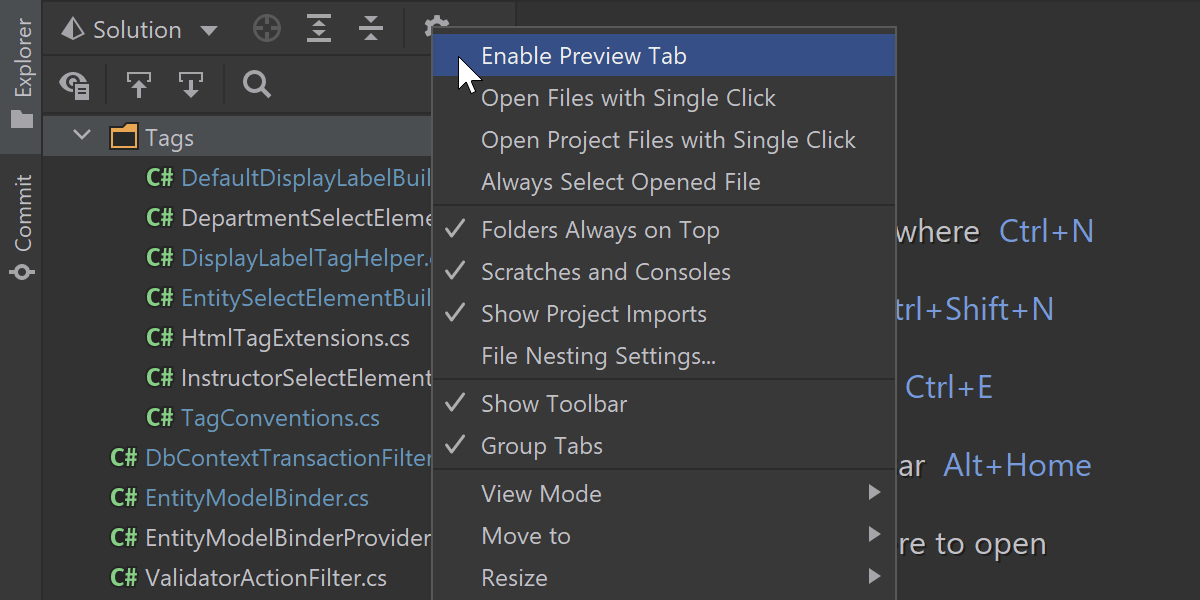
Preview tab
You can now open a file in a preview tab with a single click. When you open a file in a preview tab, its name is displayed in italic. If you start editing this file, it will cease to be a preview and will become an ordinary file. To enable this feature, click the gear icon in the Project view and select Enable Preview Tab.

Build action on Touch Bar
We’ve added the Build action to the Touch Bar for macOS users.
Version Control
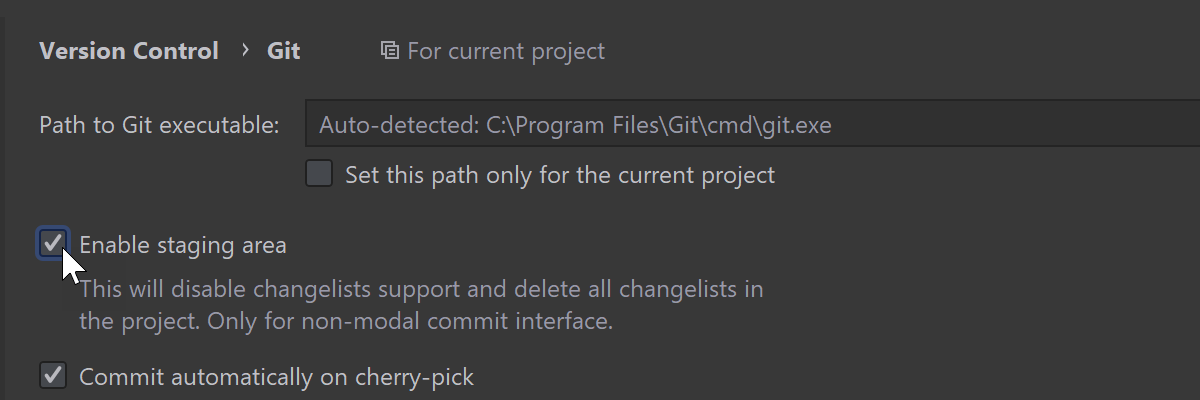
You can now stage changes directly from Rider. Click the + icon to add your files to the new
Staged node in the Commit view. You can also stage changes right from the gutter or in the
Diff view. To enable this feature, go to Preferences/Settings | Version
Control | Git and tick the Enable staging area checkbox. To learn more, read
this blog
post.
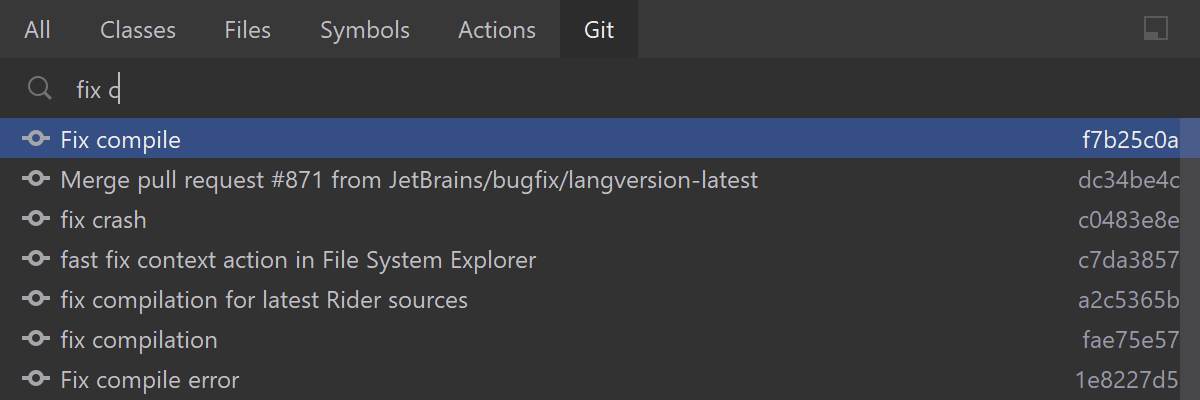
We’ve added a new Git tab to the Search Everywhere dialog. You can now find commit hashes and messages, tags, and branches in the Search Everywhere dialog.
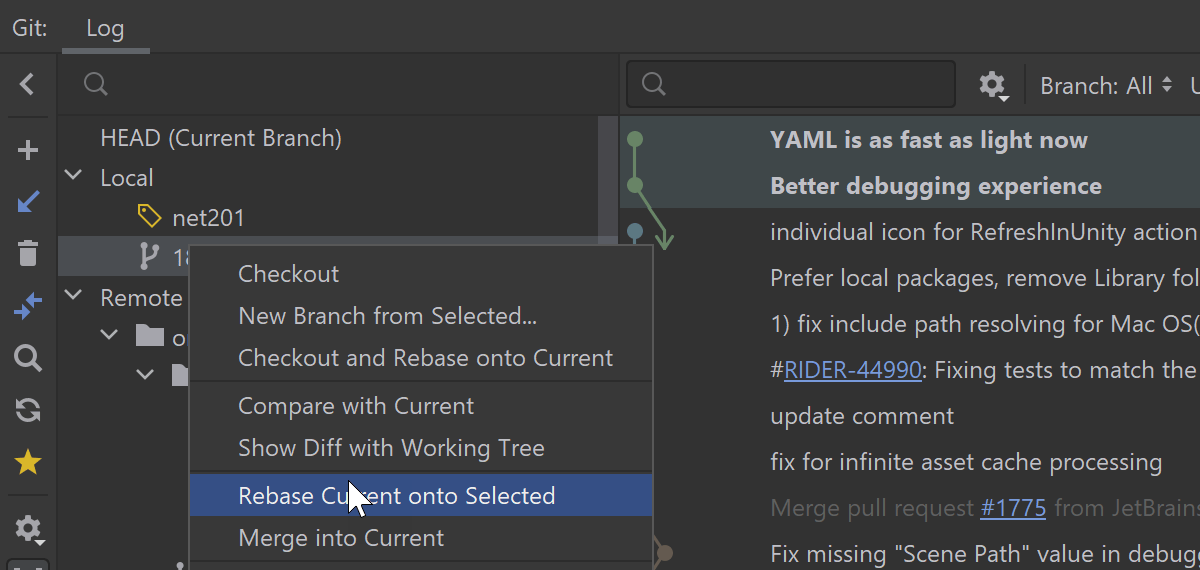
We’ve made some improvements for working with branches. Rider now shows all the actions available for the currently selected branch. The Merge into Current and Rebase Current onto Selected actions have been renamed to Pull into Current Using Merge and Pull into Current Using Rebase, respectively.
Other VCS updates:
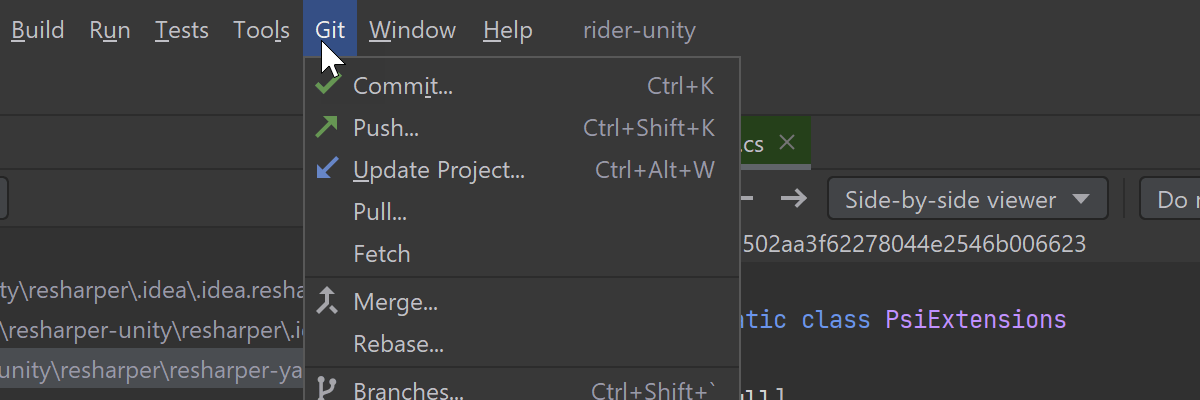
- The VCS menu is now renamed to match the name of the version control system that you are currently using.
- Patches are now created in the Git format.
Plugins
Dynamic Program Analysis (DPA)
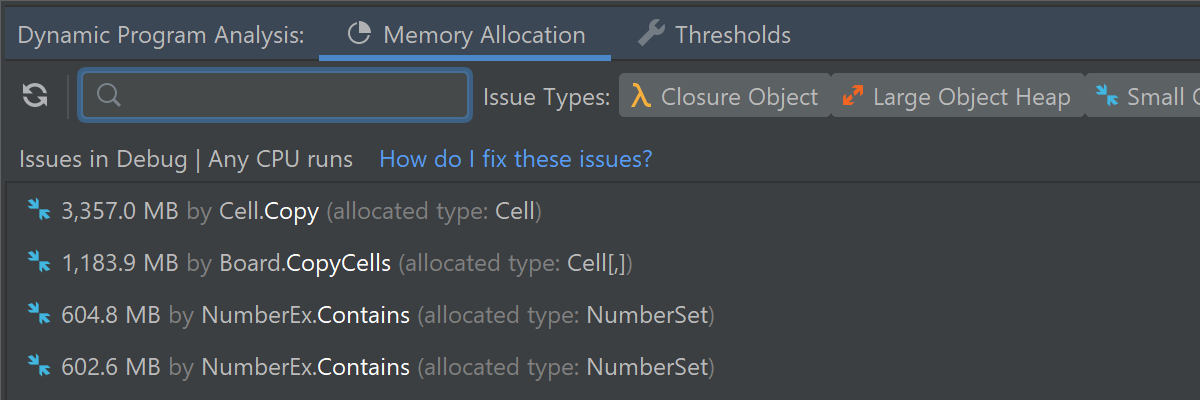
Dynamic Program Analysis plugin is now available on macOS and Linux for .NET Core applications, so it isn’t just for Windows anymore. It is available for applications targeting .NET Core 3.0 or later.
The DPA plugin is now able to analyze memory allocations when a debugger is attached to a running process.
Azure DevOps
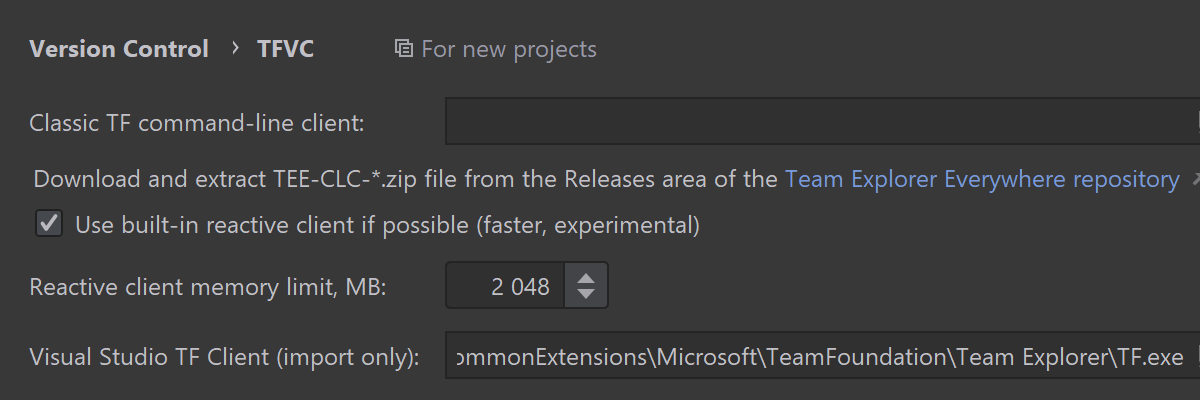
The Azure DevOps plugin can create a new server workspace or import an existing one.
dotCover
The dotCover plugin lets you perform coverage analysis of applications targeting .NET 5 on Windows, macOS, and Linux.
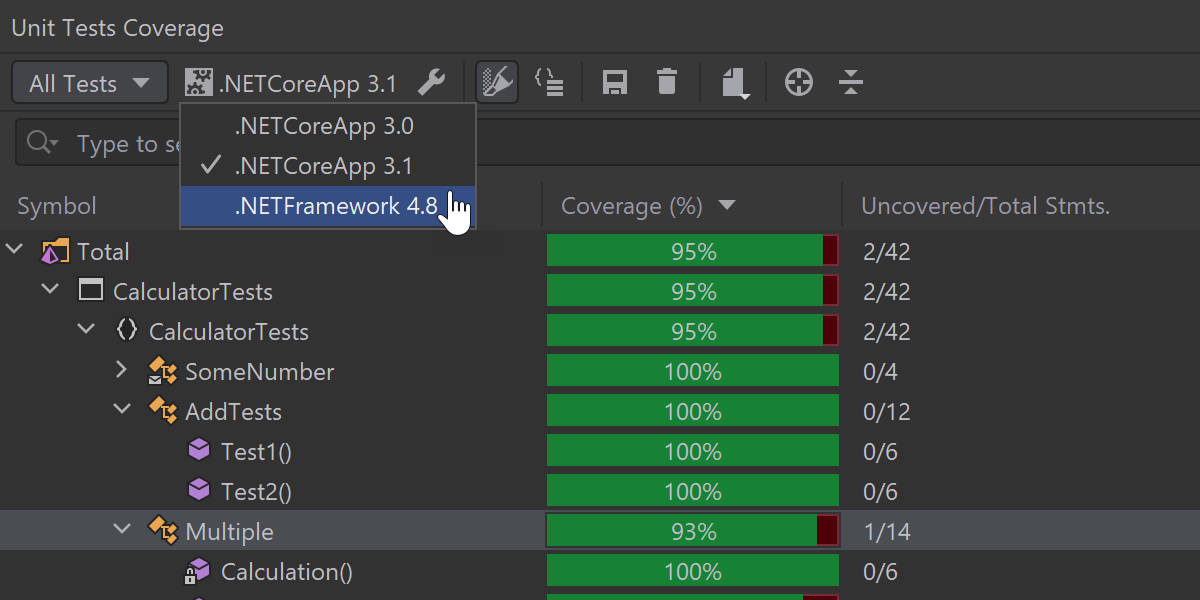
The Unit Tests Coverage window lets you filter coverage results by target framework.
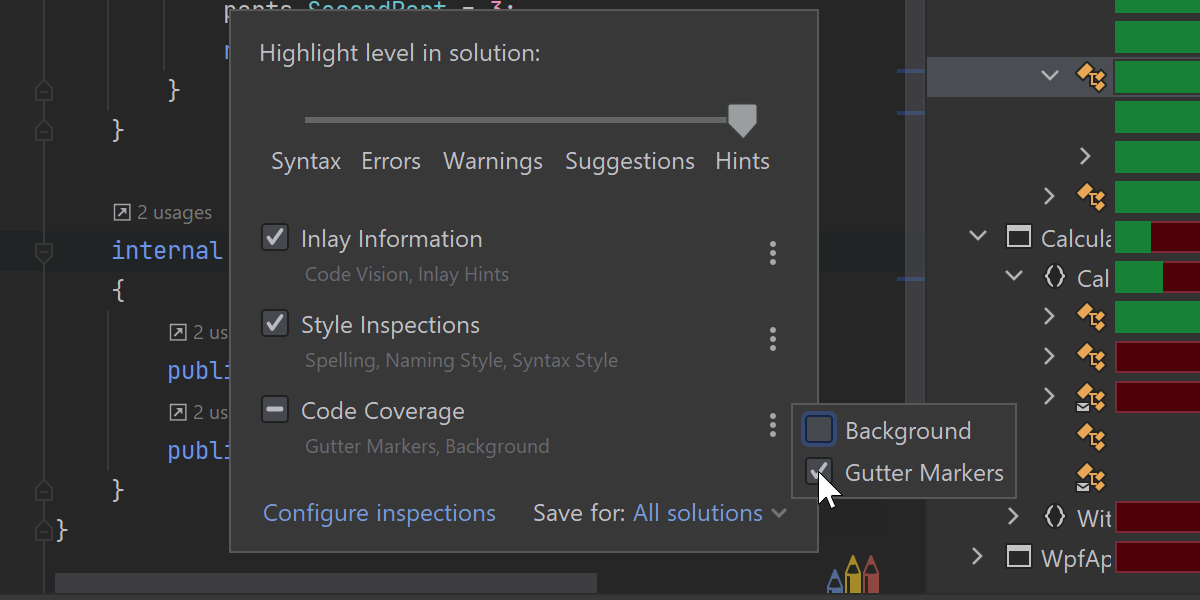
Highlighting provided by dotCover in the code editor can be toggled in the plugin settings or in the 'Configure highlighting level' popup.
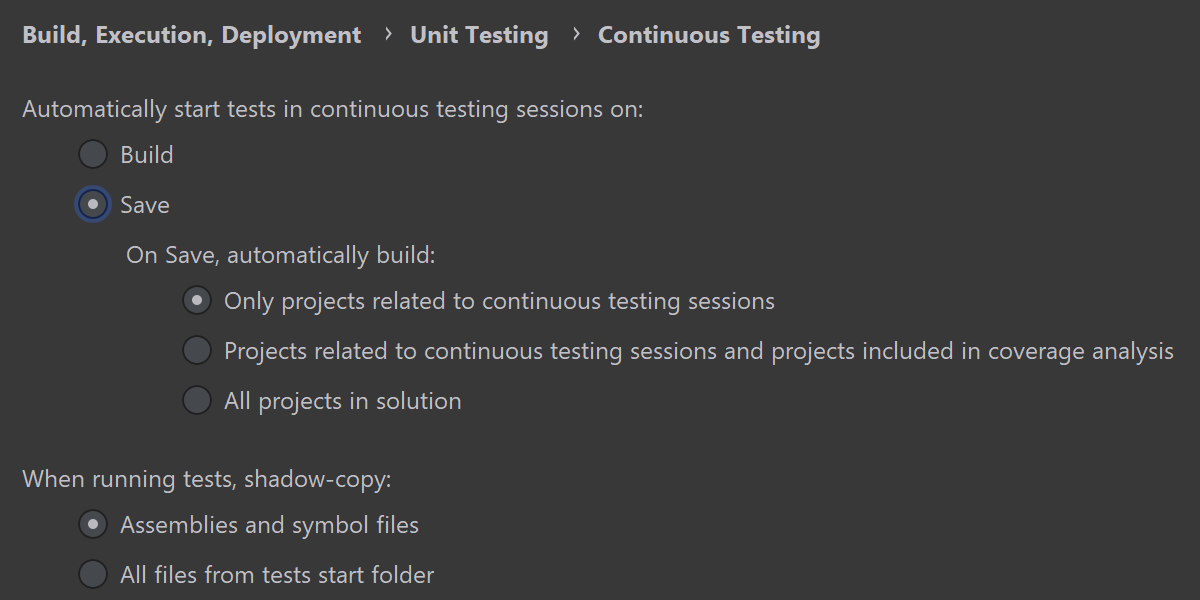
You can now define what projects should be built when a continuous testing session is triggered. This lets you speed up continuous testing sessions.
dotTrace
The performance profiler now lets you profile .NET 5 applications on Windows, macOS, and Linux.

We've added a flame graph to the performance profiler – this is a visualization of the Call Tree that lets you find slow methods more quickly.

The dotTrace plugin for Rider now has the call tree folding feature that was previously available only in the standalone version of dotTrace. It helps simplify call tree analysis by folding chains of calls that do not belong to user modules and assemblies.
Azure Toolkit for Rider

When using the Azurite storage emulator in Rider, you can now explore queue storage. You can add messages, view message content, and more.
We’ve added initial support for running the new Azurite 3.9 alpha version with a table storage emulator as well.
In Azure Functions projects, run/debug configurations are shown in the project context menu to make them more accessible. We’ve also reorganized context menus in the Azure Explorer tool window so common actions can be executed quicker.
AWS Toolkit for Rider
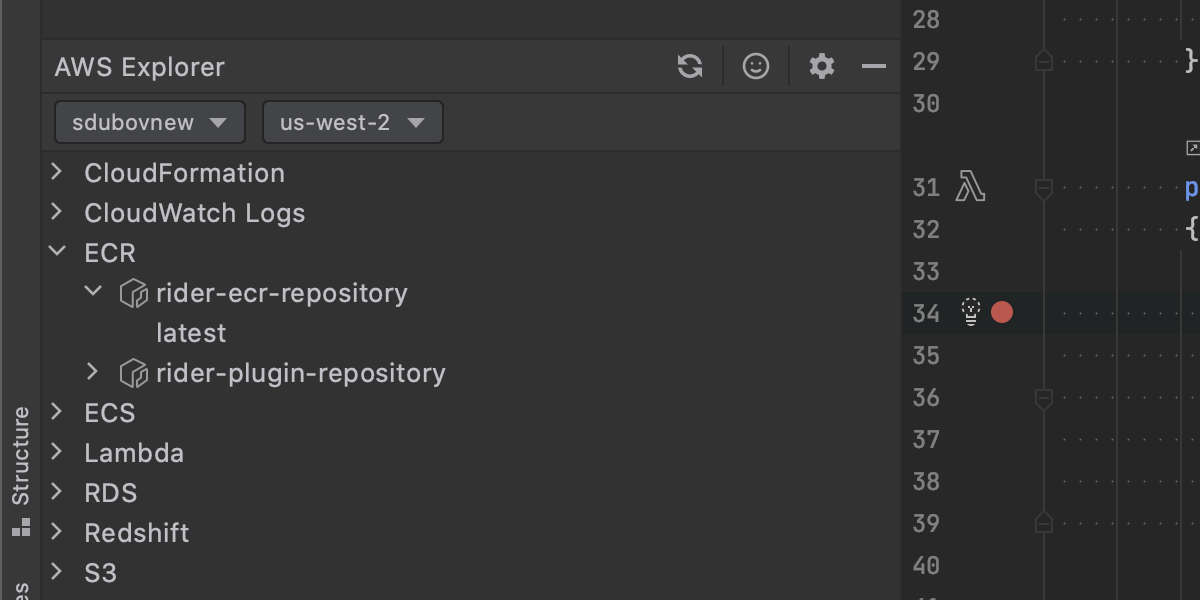
- Basic support for Amazon Elastic Container Registry.
- Support for local debugging of .NET Core 3.1 Lambda functions (requires SAM CLI version 1.4.0 or later).
- The list of S3 buckets loads significantly faster than before.
- Rider 2020.1 is now the minimal version for using the plugin; 2019.3 support has been deprecated.
- More details at the Marketplace.
Markdown
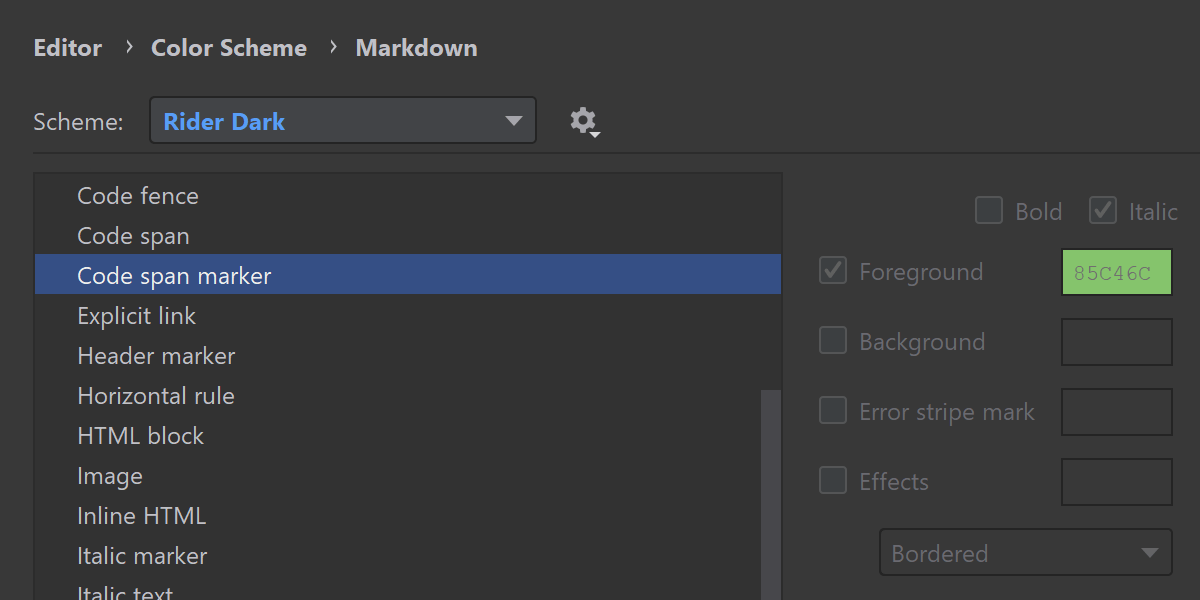
The Markdown tool now has a better preview UI and improved UX. You can customize Markdown format in
Preferences | Settings | Editor | Code Style | Markdown. The Auto-Scroll Preview button in the top-right corner of the editor allows you to sync scrolling of the preview pane and the editor. We’ve also added support for
Mermaid.js.
Code Editor
Inlay Hints
We believe in the power of inlay hints, but we also know that the environment should be kept as clean and uncluttered as possible. We’ve come up with a new "Push-to-Hint" mechanism for inlay hints to keep the best of both worlds.

In Push-to-Hint visibility mode, inlay hints aren't shown by default. They're shown if you press and hold Ctrl, and are hidden as soon as you release the Ctrl key.

We’ve provided quite granular settings: you can tell Rider which hints should always be enabled, which should be shown on push, and which you don’t really care about. Use the ‘Visibility’ setting for each hint type.
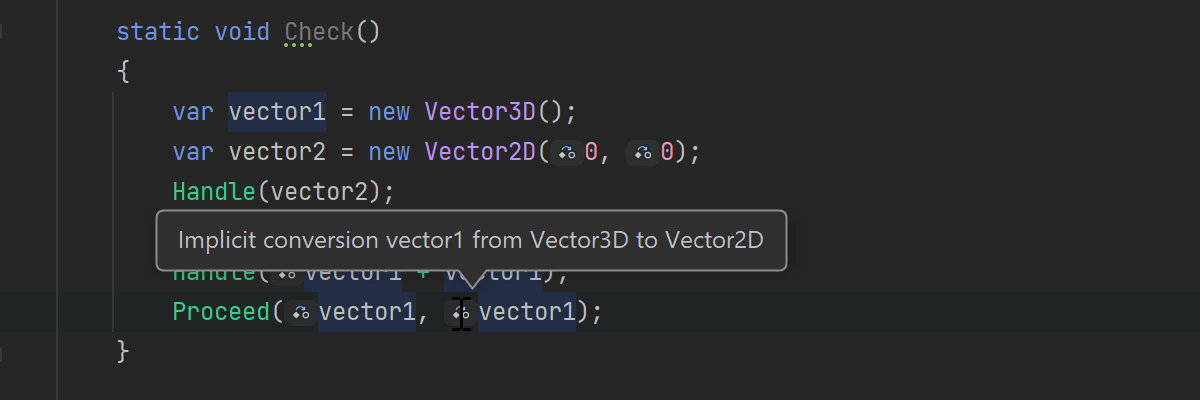
Another thing we’ve worked on here are hints for implicit type casts. Such casts can result in data loss or performance degradation, and Rider can now indicate where an implicit cast is happening.
File header

A template for a file header can now be specified in Preferences/Settings | Editor | File Header Template. You can use it to add a copyright notice, company information, current user name, etc.
Code Style & Formatting


We've added a long-awaited feature to detect and configure formatting settings from the code editor. Select a piece of code, press Alt+Enter, and then select Format Selection / Configure or Format Selection / Detect Formatting settings. Rider will show you a window with a list of all the settings that affect these particular lines. The values that are different from their defaults are highlighted, and you can also view the different ones specifically with the "Only show changed values" option.
Learn more: Auto-Detect Code Format Rules With Rider
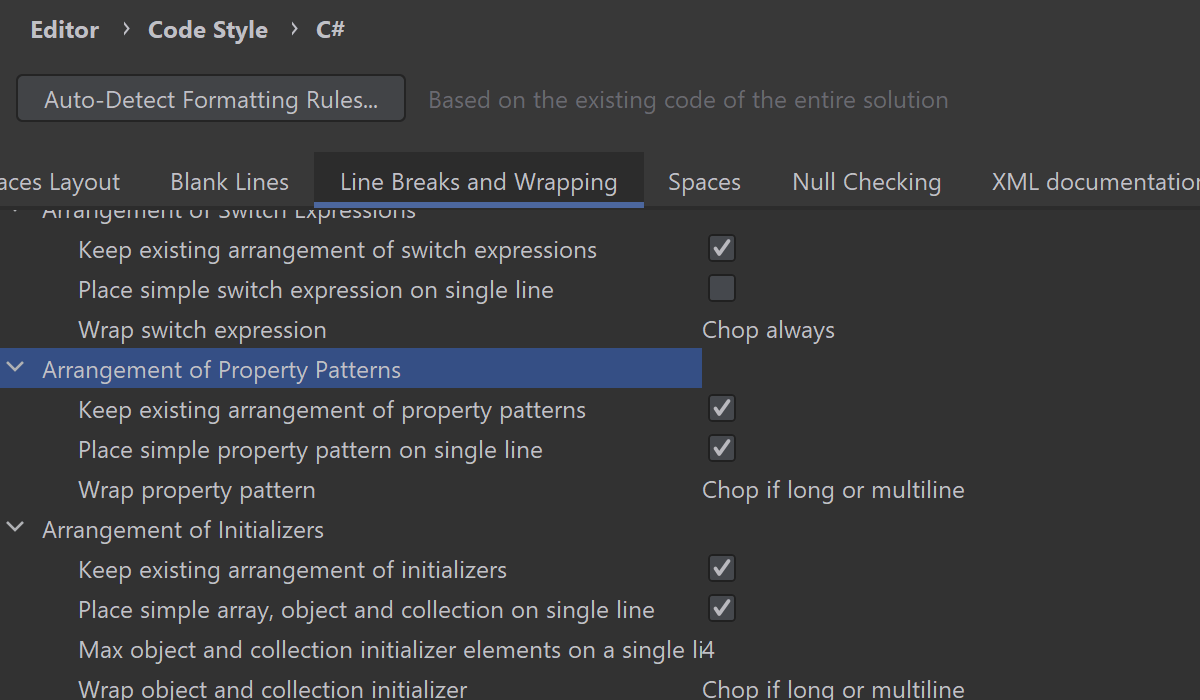
We continue to add more granular settings to the formatting engine. This is what we’ve added in this release:
- Settings for arranging property patterns let you tell Rider to place a simple pattern on a single line, and how you prefer long patterns to be wrapped. There’s also a setting to align the property patterns in columns.
- Blank lines can now be added around property or event accessors.
- For Visual Basic .NET, there’s an option to add a space after the unary +/- operator.

We’ve added an option to select a preferable syntax style for default values on the Preferences/Settings
| Editor | Code Style | C# | Syntax Style tab: default vs. default(T).
There are some updates in .editorconfig support:
- New “Spaces around ‘=’” parameter in export to .editorconfig. Its value is auto-detected for existing files and can be set manually for new files. It is set to ‘true’ by default.
- Support for reading Roslyn properties:
file_header_templates,dotnet_sort_system_directives_first, anddotnet_separate_import_directive_groups.
You can now adjust the indentation of the current line of code with the Tab key. Assign the Tab key to the Emacs Tab action to use this feature.
Avalonia Support
Code Analysis


As is typical for all the WPF-like frameworks, code analysis provides plenty of common code inspections with appropriate quick-fixes for both C# code-behind and
.axaml files including “Possible ‘System.NullReferenceException’” and
“Class/Property {...} is obsolete: Use {...}”.


In addition to the common WPF inspections, there are a lot of Avalonia-specific inspections, such as “Path to resource is case-sensitive” or “ColumnDefinitions tag can be converted to attribute” inspections with quick-fixes. For the latter, there is a context action on
ColumnDefinitions="*,Auto,*" attribute to convert it back into a <Grid.ColumnDefinitions> tag.


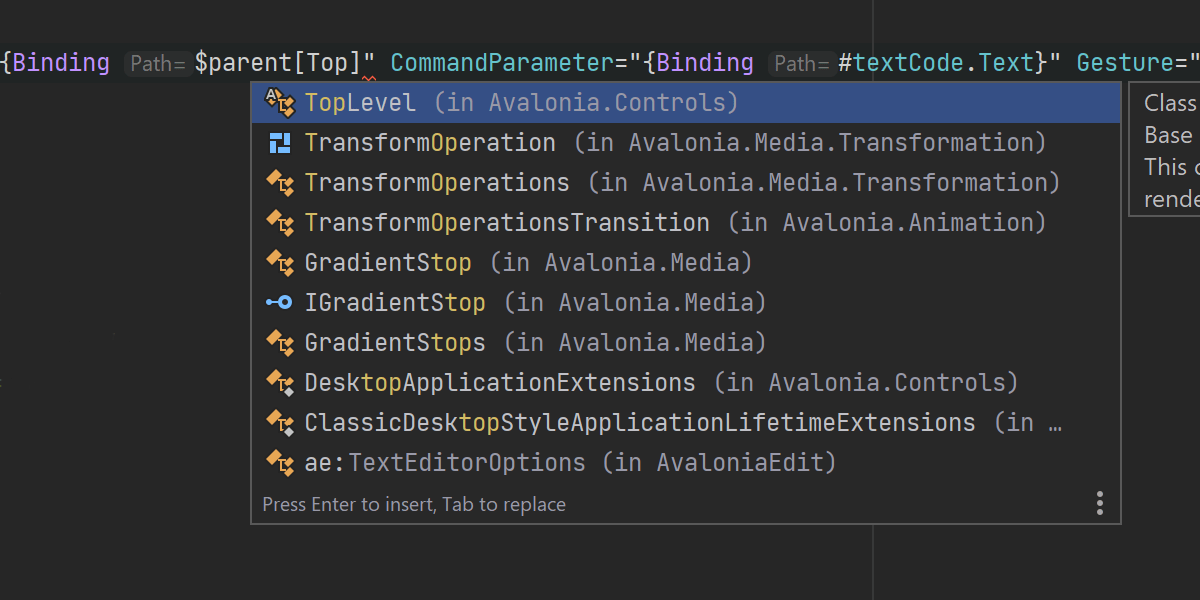
We’ve added proper support for $self, $parent, ^, and # syntax in Avalonia bindings, as well as proper validation of indexes in the
$parent[] array.


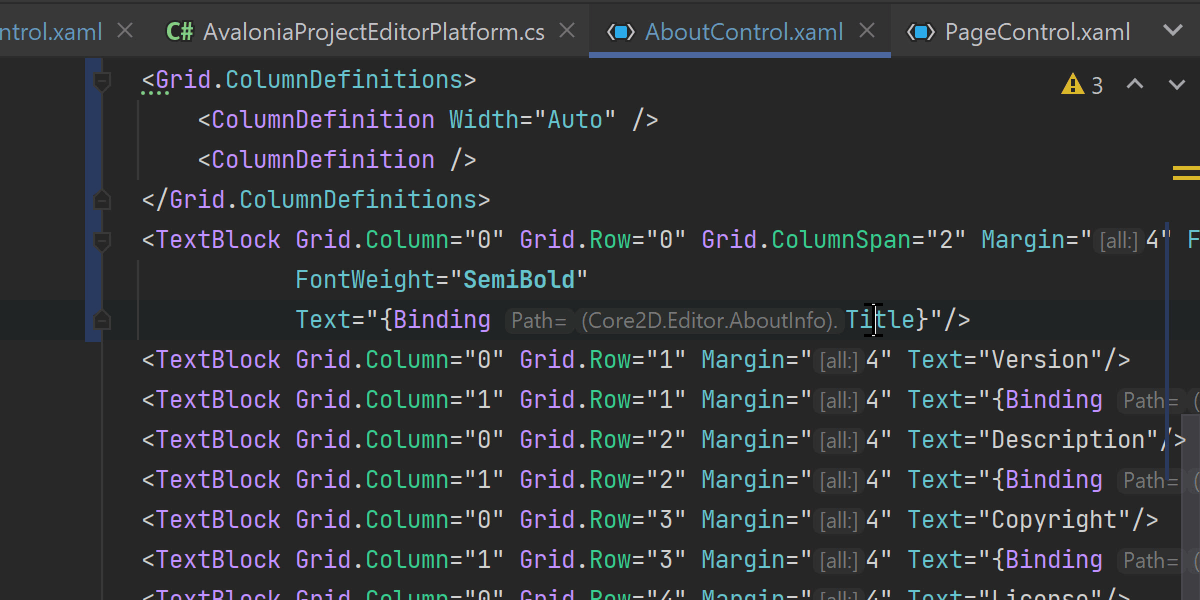
There is extended support for CompiledBinding and the x:CompileBindings extension. Rider knows that DataType is required here and prompts you to specify it for bindings in your code.
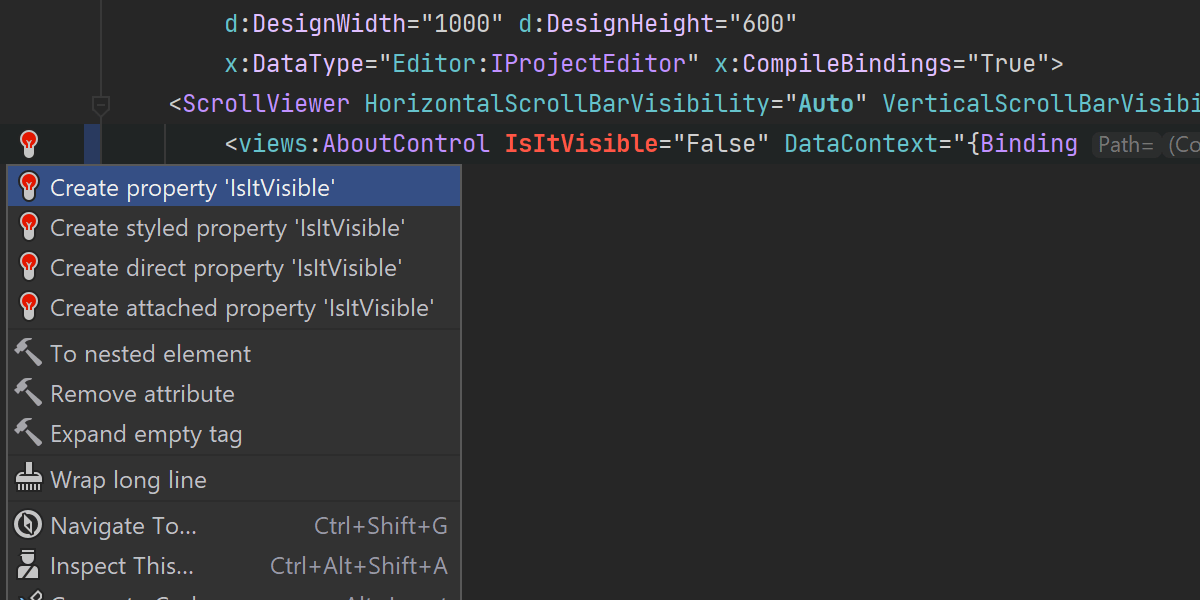
The “Create from usage” quick-fix is available for all sorts of Avalonia properties.
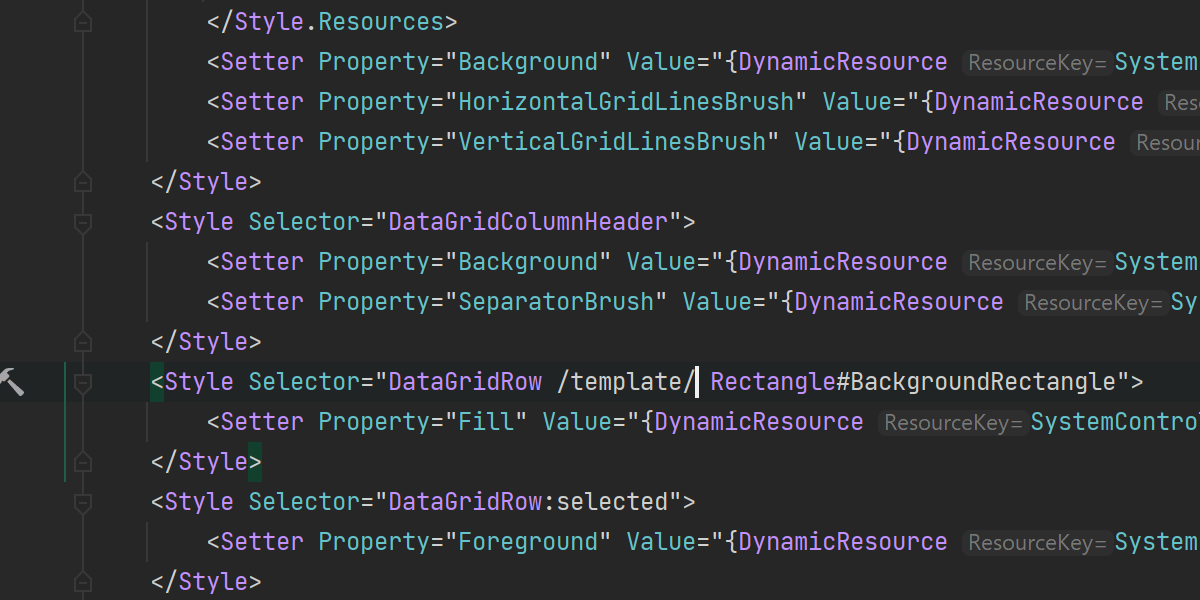
Avalonia XAML support includes understanding of the CSS-like styling system.


Inlay Hints help you better understand the code you are looking at.
Code completion
Code completion and parameter info are available for all XAML keywords, all sorts of markup extensions, x:Name,
Style properties, Source properties for StyleInclude, and lots more.
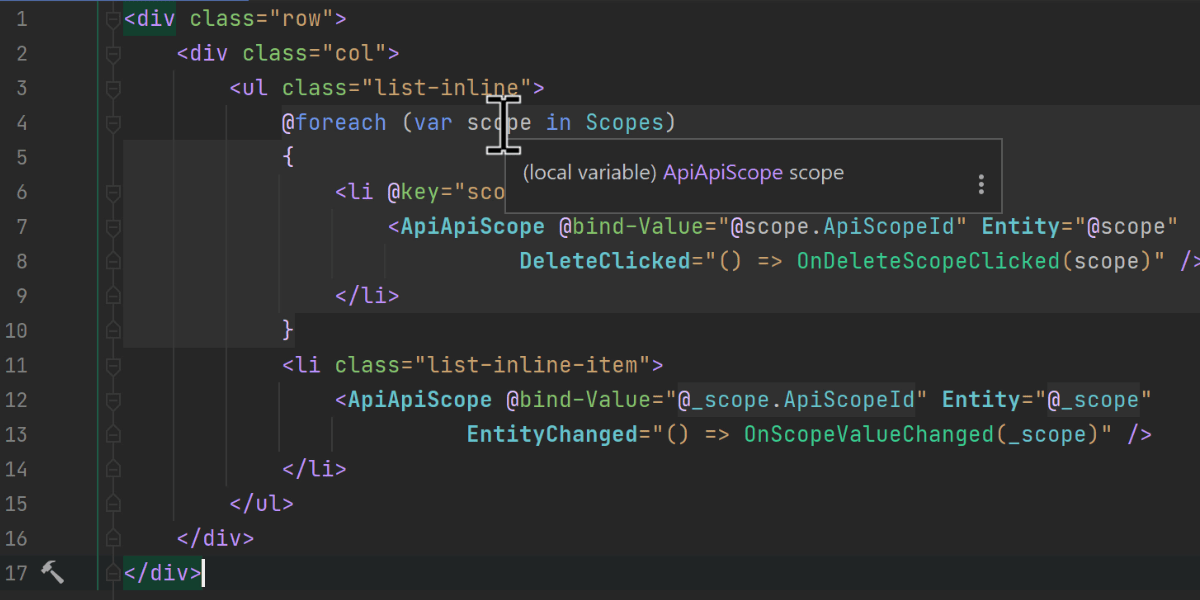
Navigation
You can easily navigate to compiled binding data type, bound property, Avalonia control type, and
x:Name declarations. Rider can also go directly from XAML to decompiled external code including style setter properties and to referenced xmlns namespaces.
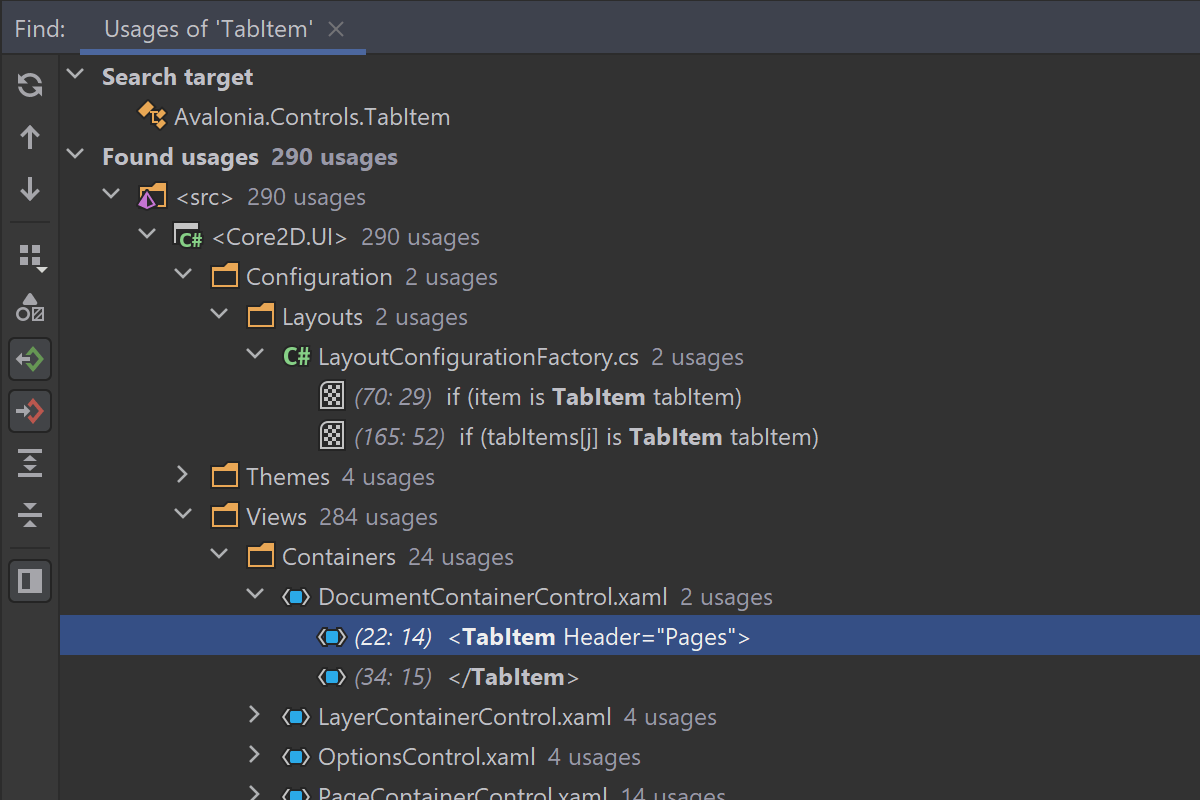
Find Usages
Find Usages helps you find all usages of method bindings, x:Name attributes,
Style classes and setters, and all sorts of properties.
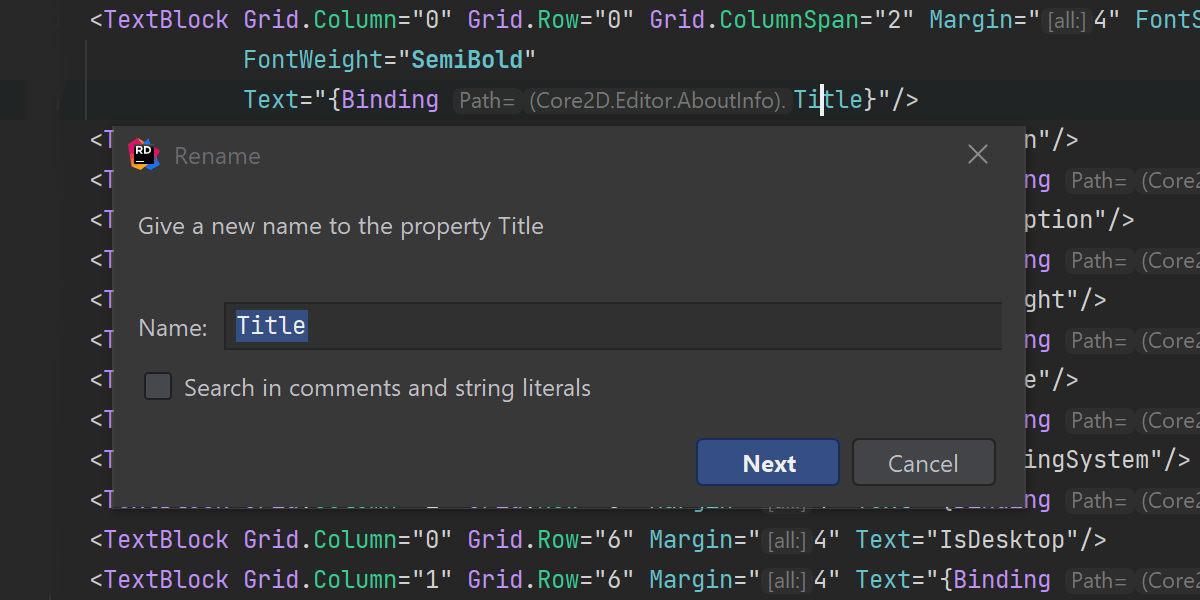
Refactorings
Rename and Safe Delete refactorings are now aware of all kinds of usages in Avalonia XAML code and update them accordingly.
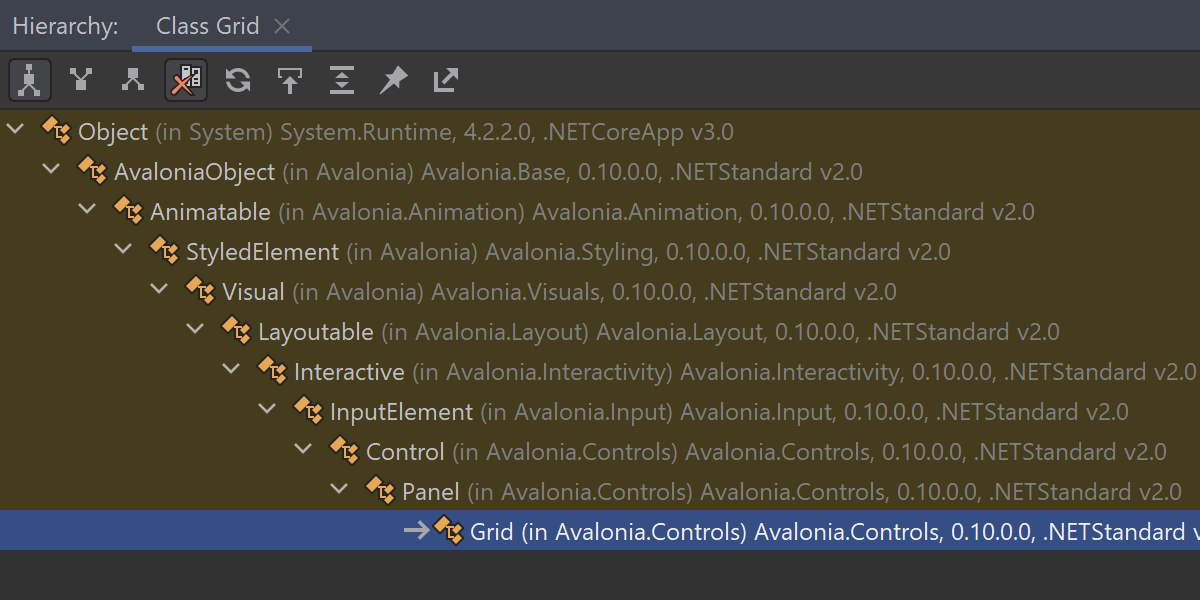
Hierarchy and code structure
You can observe the hierarchy and structure of the Avalonia XAML code.
Web Development
Blazor support
We continue to add more Blazor support. This iteration was about supporting generic type parameters and their type inference from usages, and eliminating performance setbacks on opening solutions. For the full list of fixed issues, please refer to our public bug tracker.
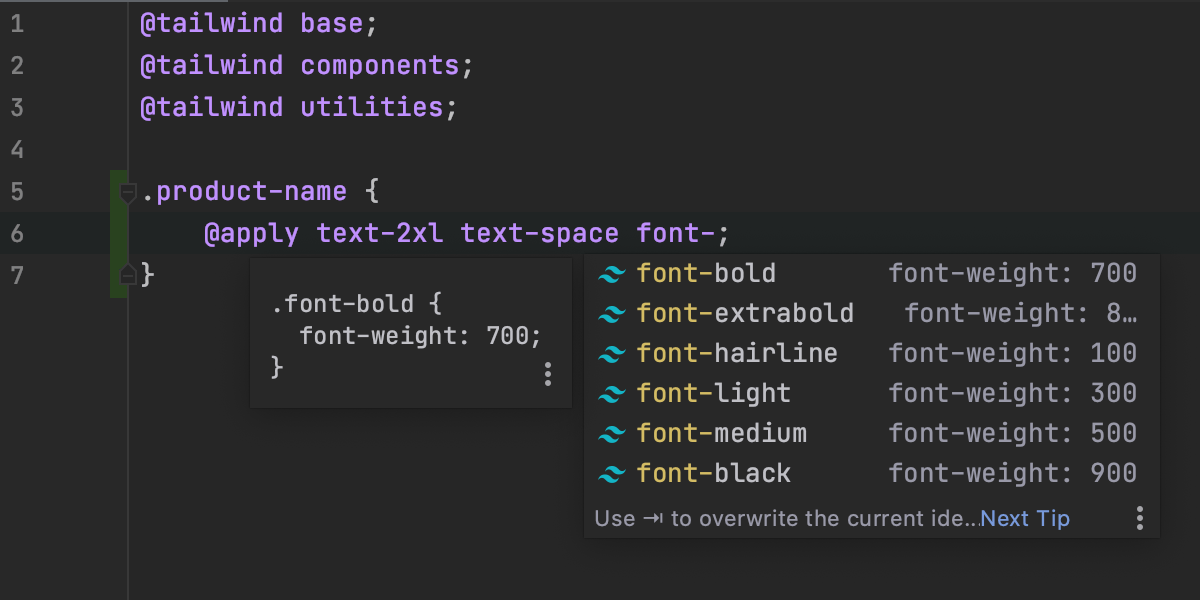
Support for Tailwind CSS
Rider can now help you work with Tailwind CSS more productively. Install the Tailwind CSS plugin from
Preferences / Settings | Plugins, and the IDE will autocomplete your Tailwind
classes, show you a preview of the resulting CSS on mouseover, and support the customizations you make using
tailwind.config.js files.
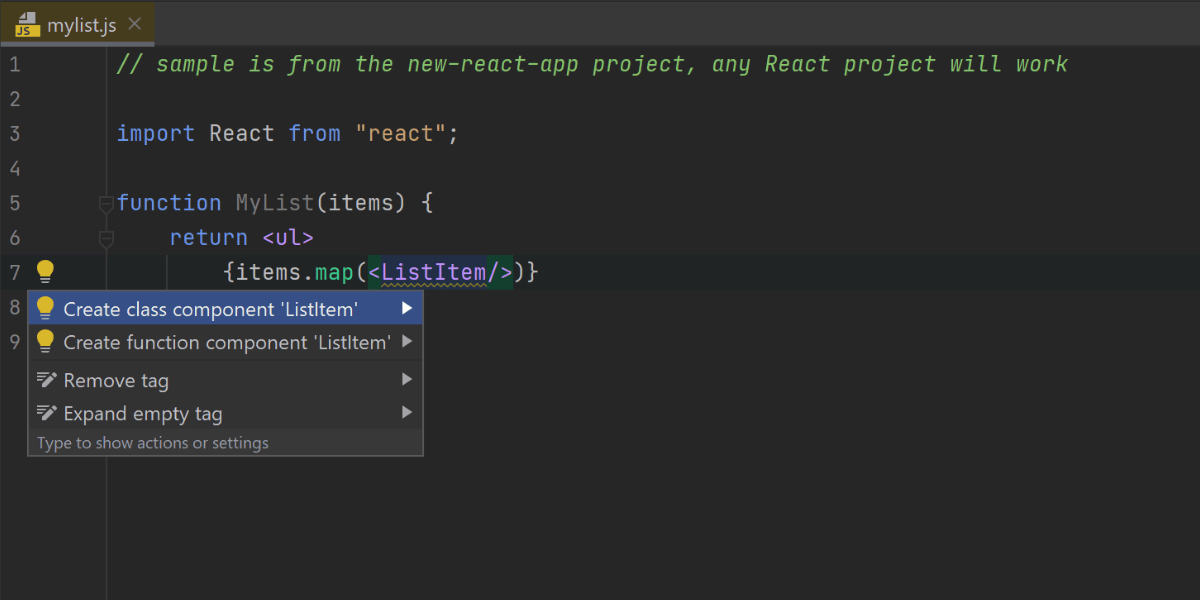
Create a React component from usage
Have an unresolved React component in your code? Place the caret on it, press Alt+Enter, and select Create class / function component from the list. Rider will create the relevant code construct for you.
Other notable improvements include:
- For JavaScript and TypeScript files, the Navigation bar now lets you jump to specific code elements in the current file (more info).
- Better formatting for template literals with CSS and HTML (this one is pretty specific but the related issue had quite a lot of votes – more info).
- Full support for pnpm (details).
Check out What’s New in WebStorm for all the web development improvements that are also available in Rider 2020.3.
Database Support
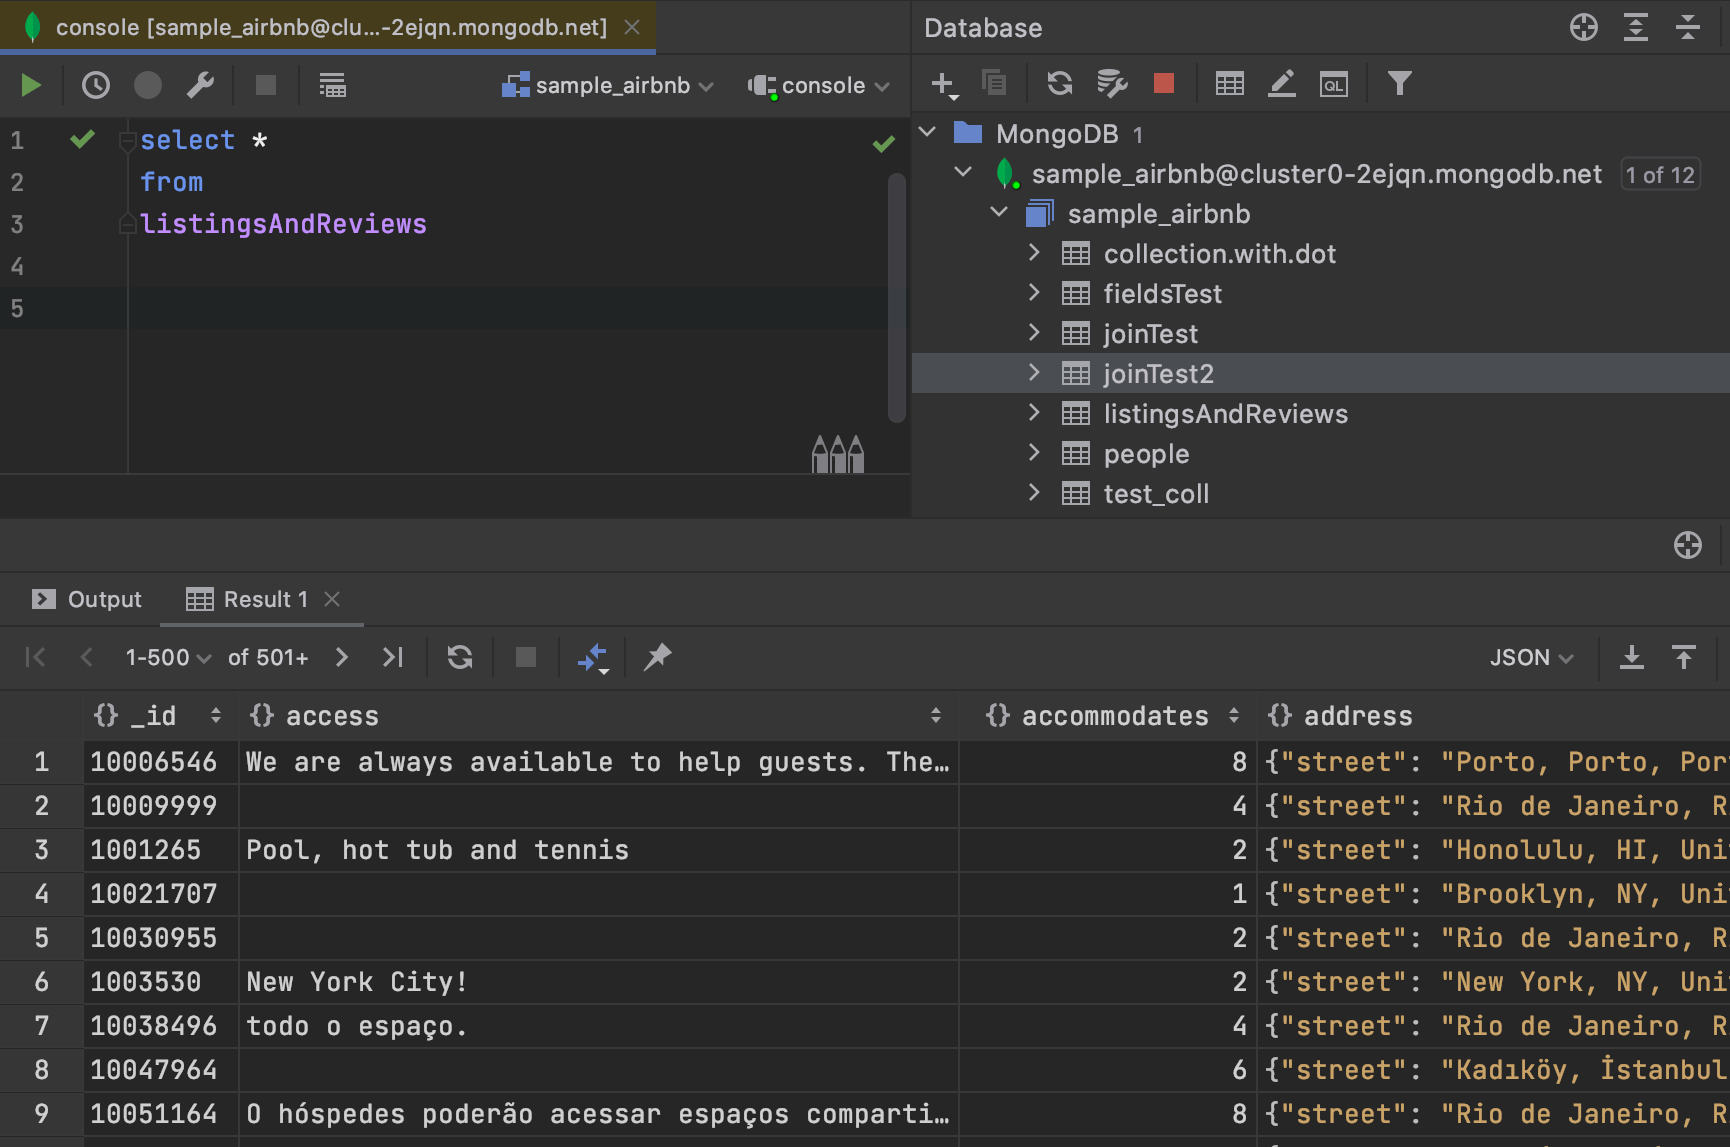
SQL for MongoDB
You can now use SQL to query MongoDB databases! We've created our own JS-SQL translator that makes this possible.
Only SELECT queries work, and the working сlauses are JOIN, WHERE, GROUP BY, HAVING, ORDER BY, LIMIT, and OFFSET. The complete post on what is supported is here.
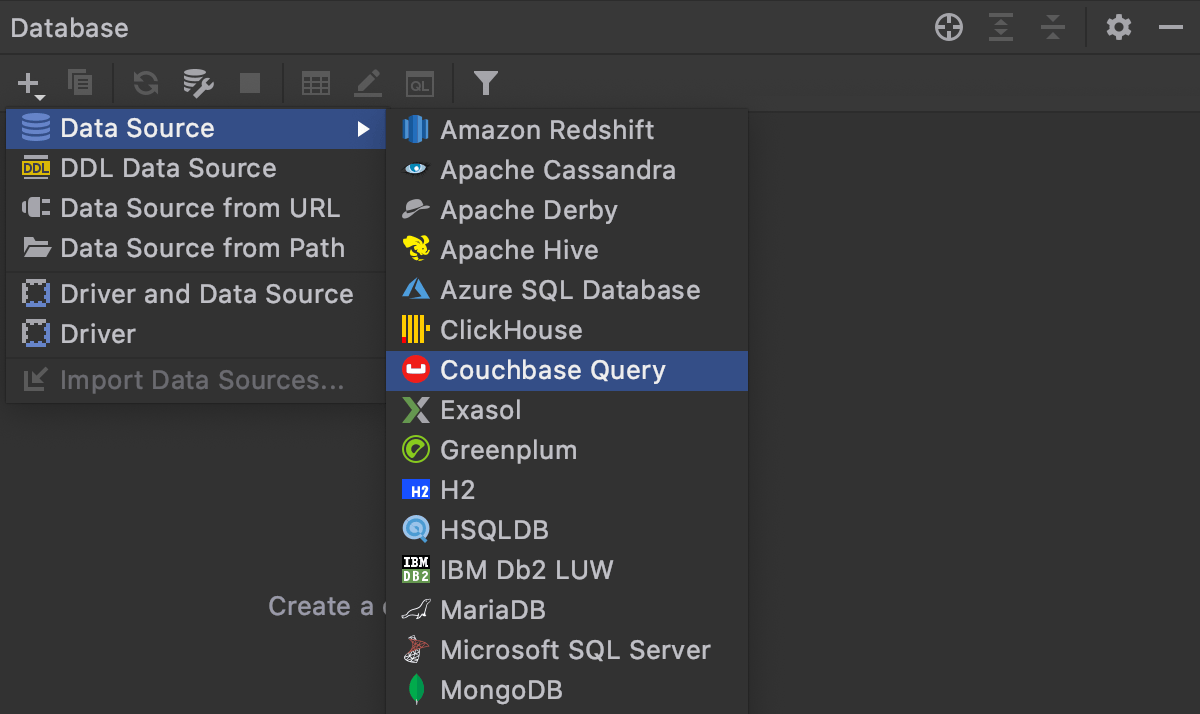
Couchbase support
We’re always happy to welcome a new database into the family, and our newest member is Couchbase! It’s important to mention that Rider supports the Couchbase Query service, not the Couchbase Analytics service.
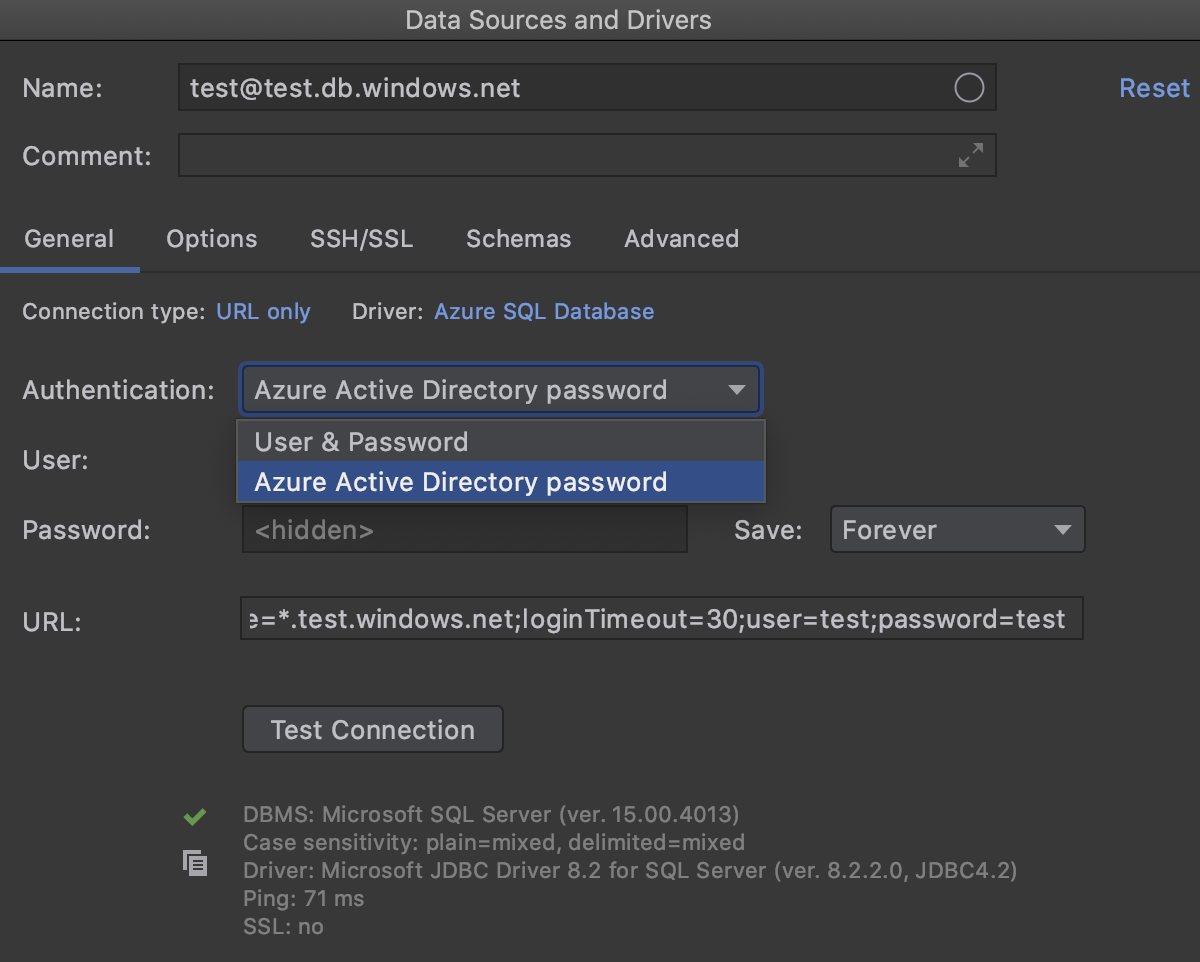
Azure AD authentication
You can now use Azure AD to log in to your database.
Check out What’s New in DataGrip for all the database improvements that are also available in Rider 2020.3.
Other Updates
Unit Testing
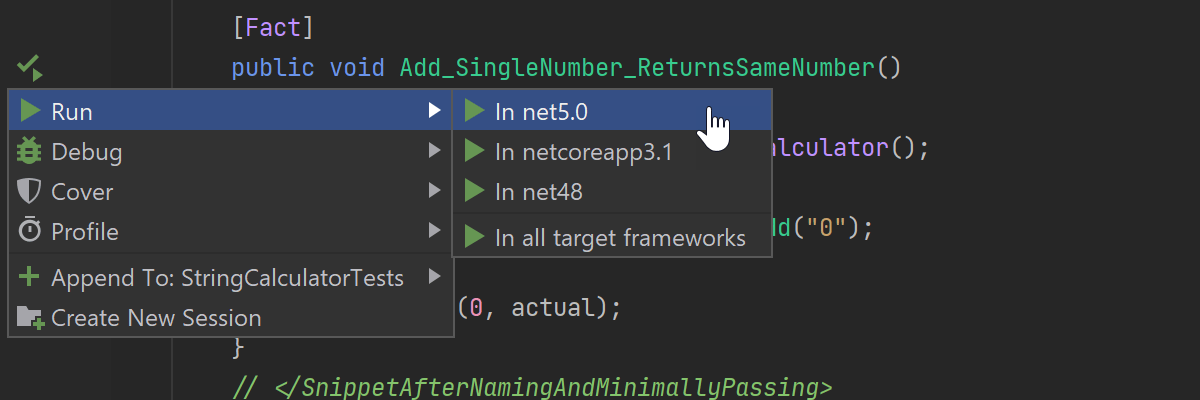
Unit tests can be launched for a specific target framework right from the code editor via the Alt+Enter menu.
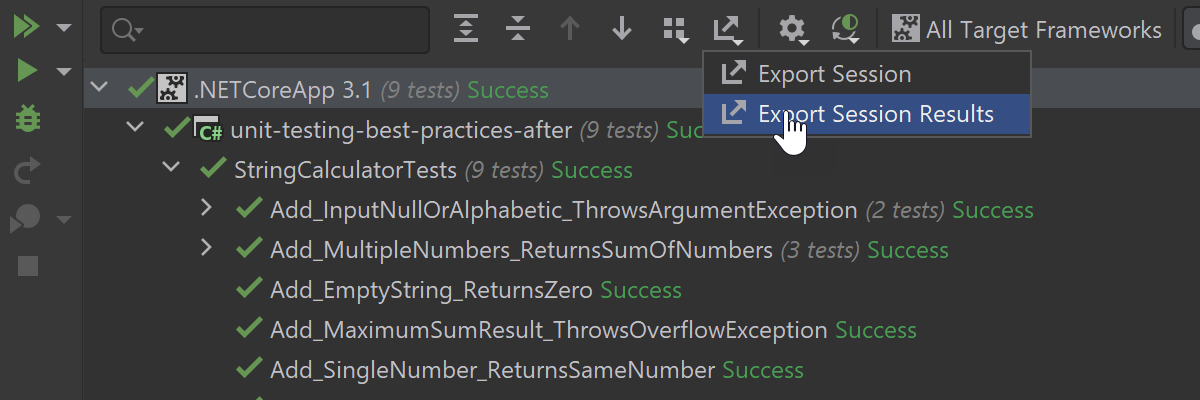
You can now export the results of unit tests execution from the Unit Test Session tab.
Xamarin
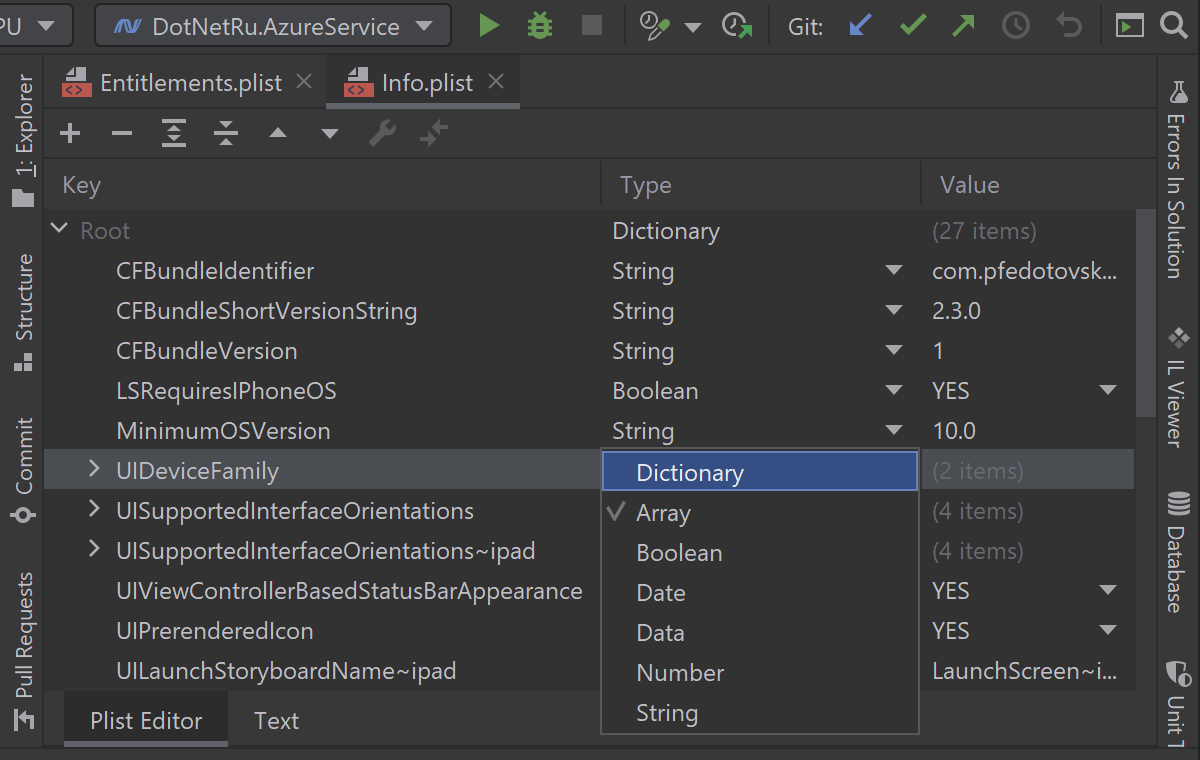
For those who spend time configuring iOS projects via “information property list” files, there's a new rich editor for Info.plist in Xamarin.iOS projects on all platforms. You don’t need to open Xcode to edit these files anymore.
Miscellaneous
- Run configurations that are stored as files are now added to solution items in the Run Configurations folder. This helps Rider work correctly with run configurations stored in custom folders.
- You can now store Run Configuration templates as files and share them through the VCS.
- We've also added an ability to evaluate simple math expressions in the Search Everywhere search field.
- The IDE theme can be automatically synced with OS settings on Windows and
macOS. Enable the Sync with OS option in
Settings | Appearance & Behavior |
                                            Appearance | Theme
. - The performance of Solution-Wide Error Analysis has improved by approximately 25% thanks to turning off greedy inspection calculation.