OpenTelemetry
The OpenTelemetry plugin displays logs, metrics, traces, and service relationships from locally running applications directly in JetBrains Rider. Its built-in OTLP receiver lets you inspect telemetry without setting up a separate observability backend.
Install the OpenTelemetry plugin
This functionality relies on the OpenTelemetry plugin, which you need to install and enable. For more information, refer to Open plugin settings.
Press Ctrl+Alt+S to open settings and then select .
Open the Marketplace tab, find the OpenTelemetry plugin, and click Install (restart the IDE if prompted).
Connect an application
Once installed, the plugin adds the OpenTelemetry tool window. By default, the plugin starts its local OTLP receiver when JetBrains Rider starts.
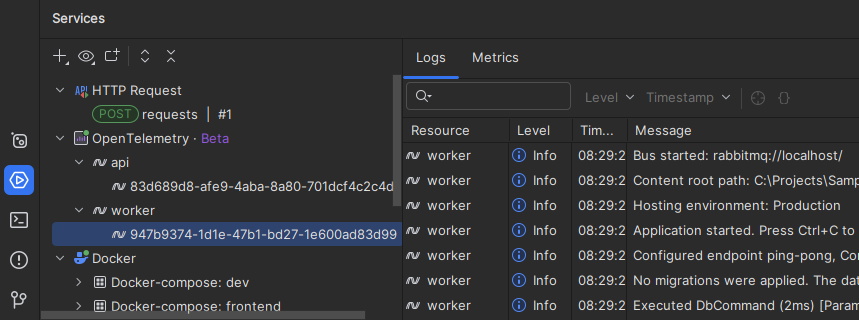
The OTLP receiver starts automatically so that it is ready before you launch an application. To start it manually instead, clear the Launch OpenTelemetry host on startup checkbox on the page of JetBrains Rider settings Ctrl+Alt+S.
To start or stop the receiver, select the OpenTelemetry node in the OpenTelemetry tool window and use the toolbar buttons.

Run or debug from the IDE
While the receiver is running, the plugin supplies OTEL_EXPORTER_OTLP_ENDPOINT and the related OTLP environment variables when you run or debug an already instrumented application from a supported run configuration. These variables point the application's exporter to the built-in receiver.
While the receiver is running, the plugin also supplies these variables to every new integrated terminal session. An instrumented application launched from that terminal can therefore connect without additional endpoint configuration. A terminal session keeps the environment it received when it opened. Open a new session if you restart the receiver on a different port.
To keep the OTLP endpoint configured in your run configurations and terminal environment, clear the Overwrite OpenTelemetry environment variables checkbox on the page of JetBrains Rider settings Ctrl+Alt+S.
Connect an application manually
You can also connect an instrumented application started outside the IDE. Start the receiver, then click Copy env vars in the empty state of the OpenTelemetry tool window. Add the copied variables to the application's environment before starting it.
The receiver uses a random available port by default. To keep the endpoint stable, select Use fixed OTLP server port and set the port on the page of JetBrains Rider settings Ctrl+Alt+S.
Explore OpenTelemetry data
The tool window groups telemetry by service and service instance. Select the top-level OpenTelemetry node to inspect data from every service, or select a service or instance to narrow the view.
The plugin keeps collected data in memory and clears it when the OTLP receiver restarts. To remove an instance earlier, use its context menu in the tree.
Logs
The Logs tab shows the timestamp, severity, service, and message for each log record. Search the message text or filter records by severity and time. Select a record to inspect its attributes.
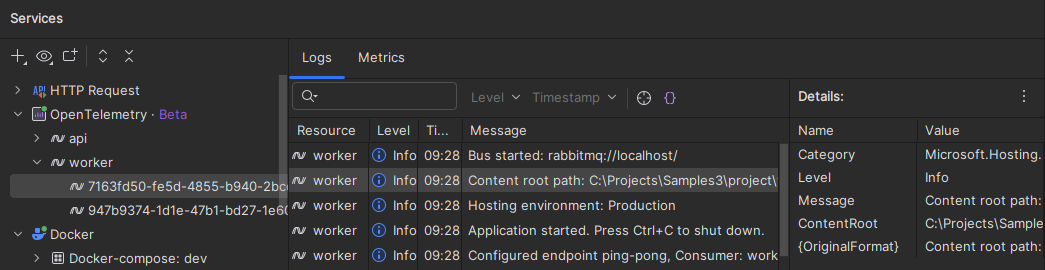
In Rider, click Navigate To Code to find the log message template in your project. Navigation is available when the record contains the {OriginalFormat} or message_template.text attribute. It does not navigate to third-party or decompiled code.
Click Open in Editor to serialize the selected record as JSON and open it as a scratch file. You can find the file later under Scratches and Consoles in the Explorer tool window.
Metrics
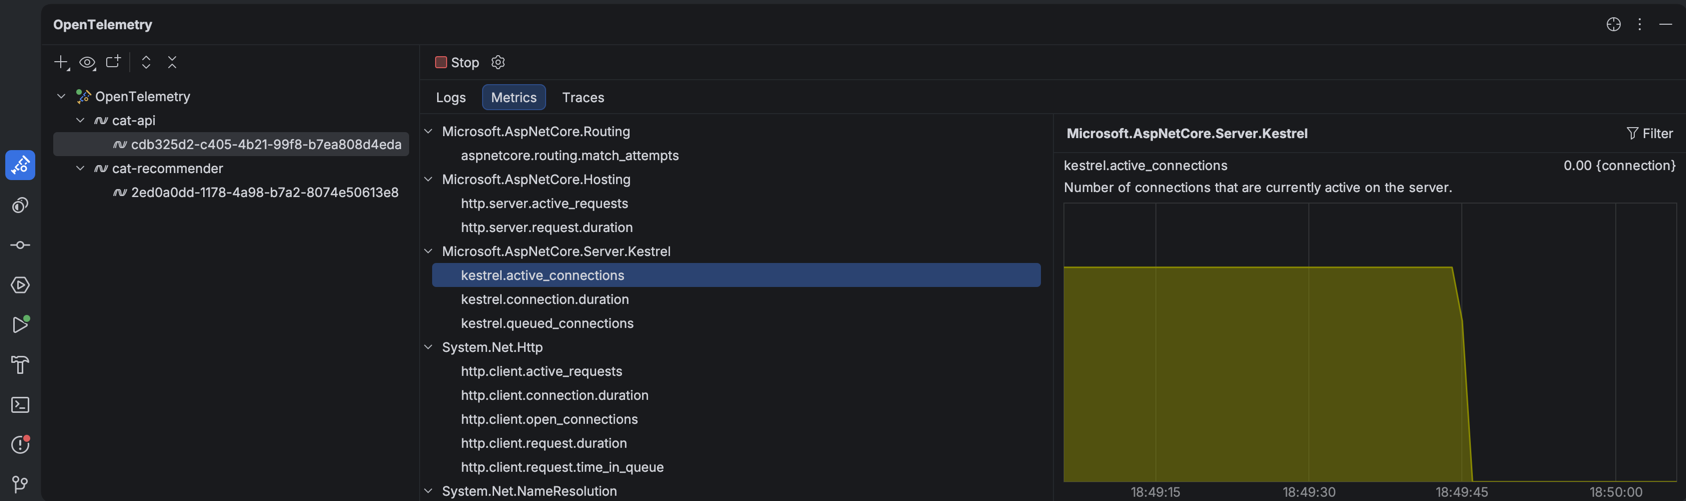
The Metrics tab organizes metrics in a tree. Select a gauge, sum, or histogram to plot its values. You can filter the chart by metric attributes.
Traces
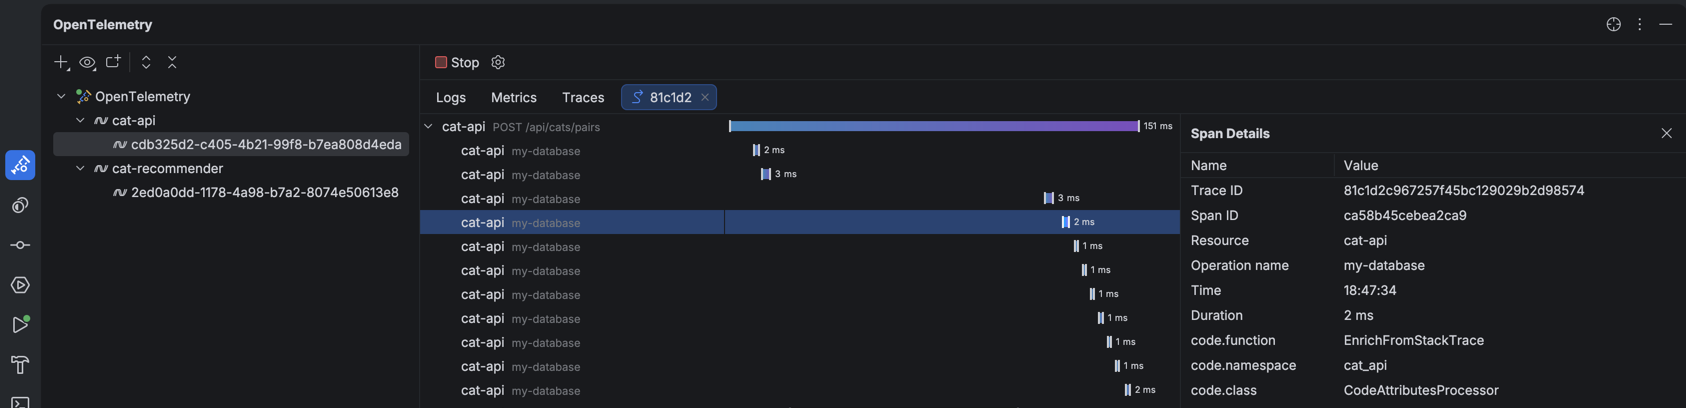
The Traces tab lists traces with their start time, duration, and services. Filter the list by time or minimum duration.
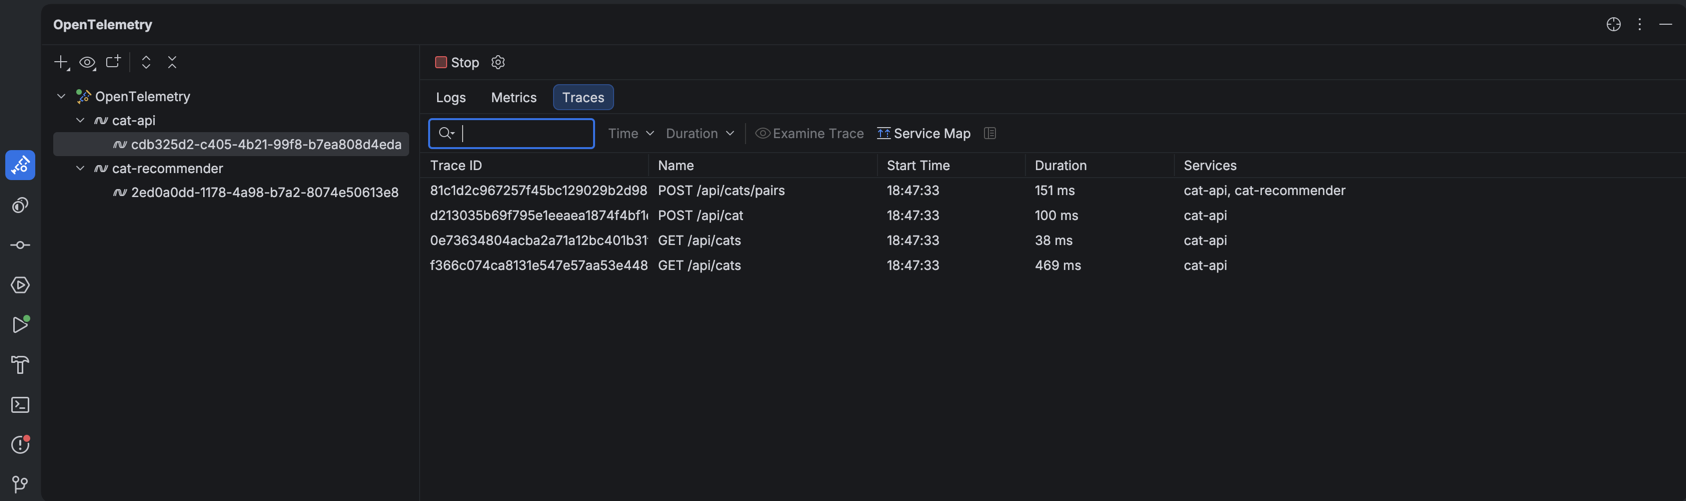
Double-click a trace, or select it and click Examine Trace, to open its span hierarchy. Select a span to inspect its operation, timing, service, and attributes.
Service Map
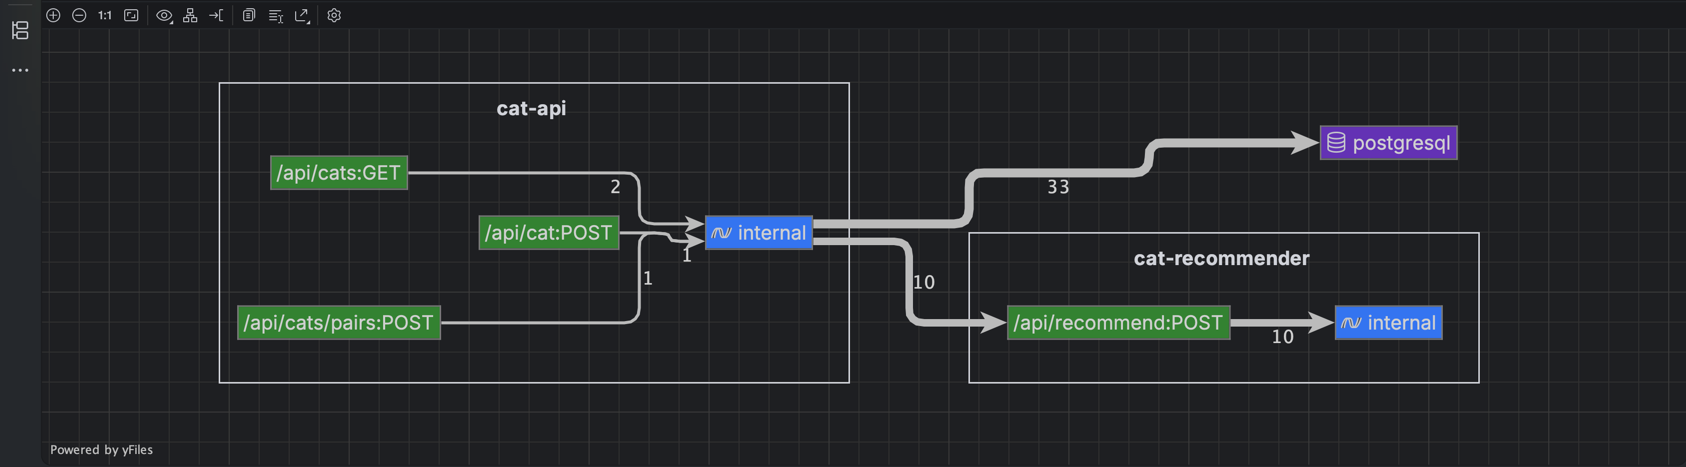
The Service Map builds a diagram from the distributed traces received by the plugin. It shows observed relationships between services, endpoints, databases, and message queues.
To open the map, open the Traces tab and click Service Map on the toolbar. The map includes only relationships present in the collected traces, so exercise the application flow you want to inspect first.
Use telemetry with coding agents
The plugin provides experimental tools through the JetBrains MCP Server. After you enable and configure the MCP Server, a compatible coding agent can query the telemetry currently held by the plugin.
get_log_recordsreturns log records and supports filters for service, message, severity, and time.get_spansreturns spans and supports filters for service, trace, span, and time.get_servicesreturns discovered services and their instances.get_service_mapreturns relationships derived from collected traces.
These tools expose only the data received by the local OTLP receiver. The agent cannot query signals that the application did not export.
Use a local OpenTelemetry Collector
If your application already sends telemetry through an OpenTelemetry Collector, add the plugin's receiver as another OTLP exporter. This lets the Collector continue sending data to your existing destinations while the plugin displays the same signals in the IDE.
Forward telemetry from an OpenTelemetry Collector
On the page of JetBrains Rider settings Ctrl+Alt+S, select Use fixed OTLP server port and note the configured port. The following example uses the default fixed port,
17011.Add an OTLP exporter that points to the plugin:
exporters: otlp/ide: endpoint: "localhost:17011" tls: insecure: trueAdd
otlp/ideto the exporters for each signal you want to inspect. Keep any existing exporters in the same pipelines.service: pipelines: traces: exporters: [otlp/ide, existing-traces-exporter] metrics: exporters: [otlp/ide, existing-metrics-exporter] logs: exporters: [otlp/ide, existing-logs-exporter]