Mixed-mode debugging in Unity
Mixed-mode debugging in Rider allows you to debug both .NET and C/C++ code in a single session. This feature is particularly useful when working with applications that involve interoperability between managed and native code, such as using DllImport to call native functions from C#.
Enable mixed-mode debugging in a run configuration
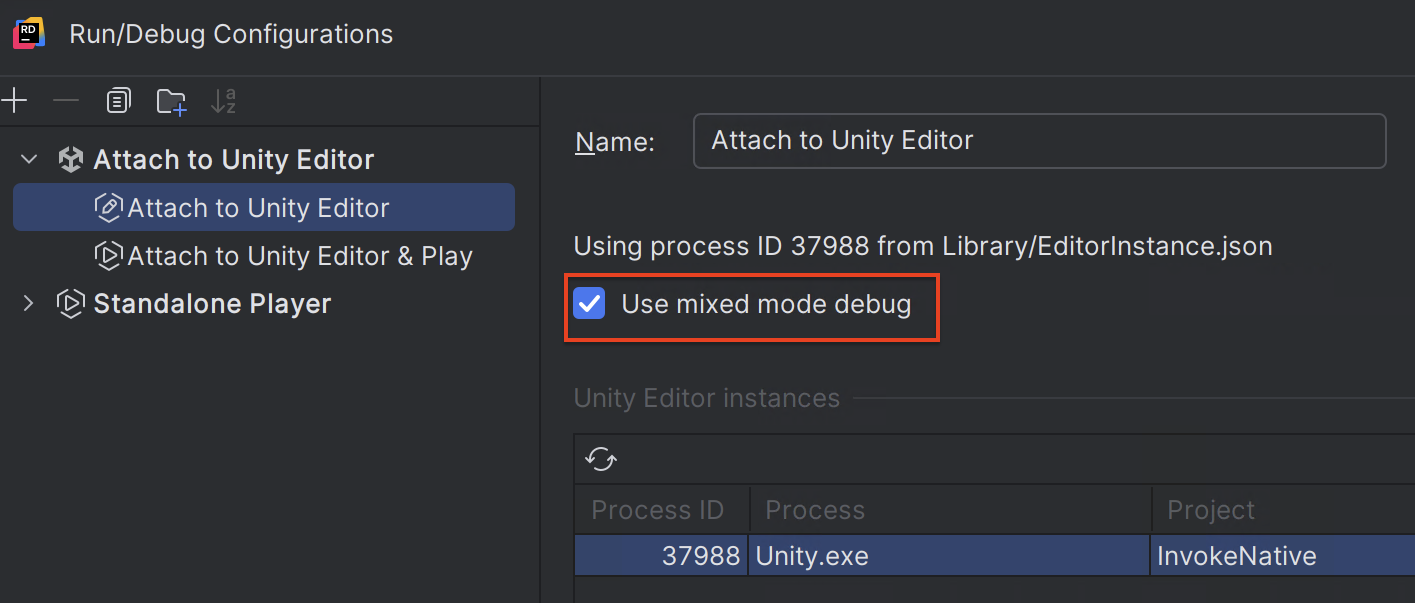
Open the desired Run/debug configuration.
Check the Enable mixed-mode debugging option in the configuration settings.

Start a debug session. Note that the first execution may take longer as the debugger has to load the required symbols for both managed and native code.
Debug a process in mixed mode
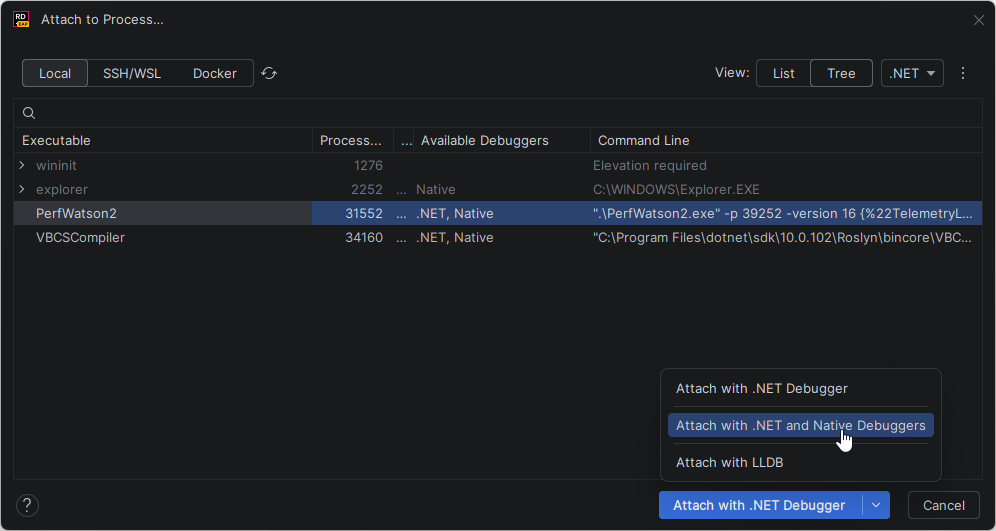
Select from the main menu.
Select the desired process and then choose Attach with .NET and Native Debuggers.

Once mixed-mode debugging is enabled, you can:
Step into native C/C++ code from C#. For example, if you're using
DllImportto declare interop methods, the debugger will seamlessly transition from C# to the corresponding native method.Set breakpoints in your native C/C++ code, and the debugger will pause execution accordingly.
Ensure that the symbols for your native libraries are loaded. You can verify the symbol status in the Modules (LLDB) tab within the debugger tool window.
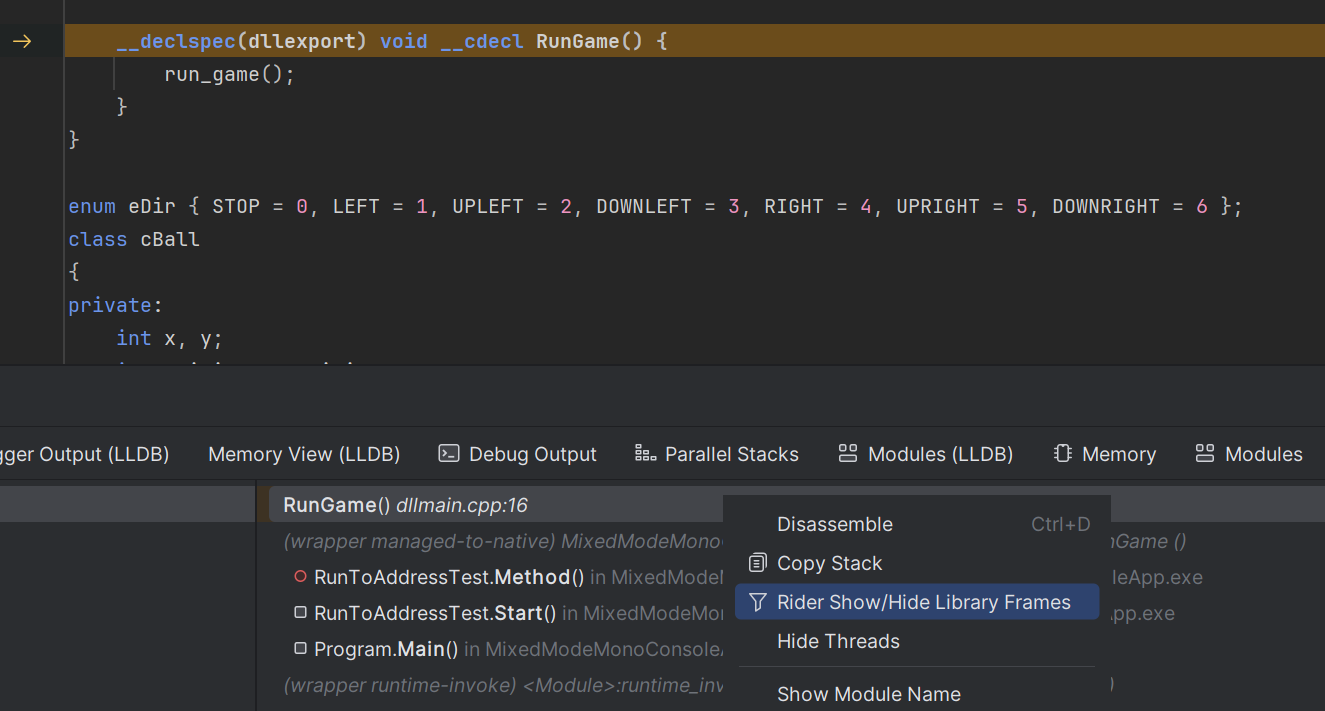
View all frames
By default, Rider filters out library frames from the call stack. To see all call stack frames, including library ones, right-click the desired thread in the Debug window and choose Show/Hide Library Frames from the context menu.
