AI providers and models
The AI providers and models segment lets you track token consumption across your organization, broken down by AI provider and model. It covers JetBrains AI and the third-party AI providers configured centrally through JetBrains Central Console. This data can help you understand provider adoption and token spending, compare usage patterns across providers, and make informed operational and budgeting decisions.
Data sources
Token usage is tracked from the following sources:
Using models from a centrally configured third-party AI provider. An organization administrator can configure connections to third-party AI providers and make models from the provider available to users in the organization. Such models then become available and can be used through different features and products such as AI Chat in JetBrains IDEs or JetBrains Air. For more information, see Providers.
Usage of AI tools through JetBrains AI. This usage is attributed to JetBrains AI as the provider, regardless of which AI tool is used. For example, the use of Codex in AI Assistant through JetBrains AI counts towards the usage of the JetBrains AI provider.
Data filtering
You can filter the data by the following criteria:
In the time range filter, select one of the predefined filters that show the last specified period, or select a custom date range. The data includes both the first and the last day of the selected period.
In the provider filter, which displays All providers by default, select the AI providers you want to show the data for. When no provider is selected, the data is shown for all providers.
In the principal filter, which displays All principals by default, search for and select users, service accounts, or groups. Selecting a group includes all of its members and members of its subgroups. Expand a group to select its subgroups.
These filters apply to both the Token usage by provider chart and the Token usage by model table.
Filters of different types are combined with a logical AND. For example, data will match both the selected date range and the user the data is attributed to.
Multiple selections of the same filter are combined with a logical OR. For example, selecting a group along with an individual user shows data for that user and all members of the group.
Filter selections are preserved across analytics segments. The filters that you set in one segment are automatically preselected when you switch to another segment.
Token usage by provider
This chart displays token consumption per AI provider for your selected time period. The displayed data shows five providers with the highest token consumption. Providers with lower consumption are grouped under the Remaining category.
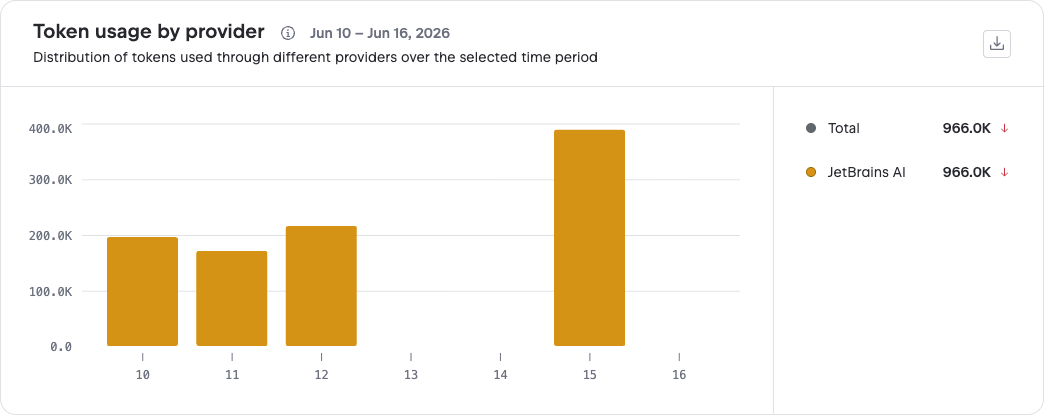
In the legend, the indicator next to each provider's token count shows the token consumption trend compared to the previous period of the same length. For example, if you select a 30-day period, it is compared to the 30 days prior to the start of your selected period.
The token consumption trend, if detected, can show one of the following indicators:
 Increase
 Decrease
 No change in consumption or not enough data for comparison
Token usage by model
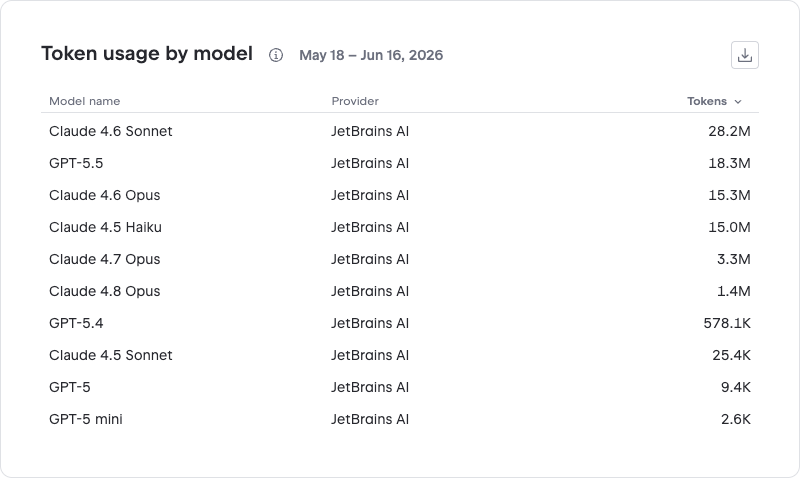
The table shows a breakdown of token usage by AI model for your selected time period. The data includes token consumption for models from all supported providers. The use of models from third-party providers through JetBrains AI is listed under JetBrains AI as the provider.
Using this data
The Providers and models segment helps you:
Identify which providers and models are most heavily used in your organization.
Optimize your AI strategy by shifting workloads to more cost-effective providers or models.
Plan budgets based on actual usage data.