MCP Server
Starting with version 2025.2, GoLand comes with an integrated MCP Server, allowing external clients such as Claude Code, Codex, VS Code, and others to access tools provided by the IDE. This gives users the ability to control and interact with JetBrains IDEs without leaving their application of choice.
Enable the MCP Server plugin
This functionality relies on the MCP Server plugin, which is bundled and enabled in GoLand by default. If the relevant features are not available, make sure that you did not disable the plugin.
Press Ctrl+Alt+S to open settings and then select .
Find the MCP Server plugin and click Enable.
Enable MCP Server
To enable the MCP server, do the following:
Go to .
Select the Enable MCP Server checkbox.
In the Enable MCP Server? dialog, review what access third-party applications will get to the projects opened in the IDE, and click Enable to continue.
Click Apply.
Once the MCP server is enabled, you can proceed to configure external clients.
External client setup
For detected external clients like Junie, VS Code, Claude Code, Codex, Air, and GitHub Copilot CLI, configuration can be performed automatically. Setting up a client means adding the address of the IDE MCP server to that client's configuration file.
To do this:
Go to .
In the Clients Auto-Configuration section, click Auto-Configure for each client you want to set up for use with the MCP server. This updates the client's configuration file automatically. The set of configured transports depends on the client.
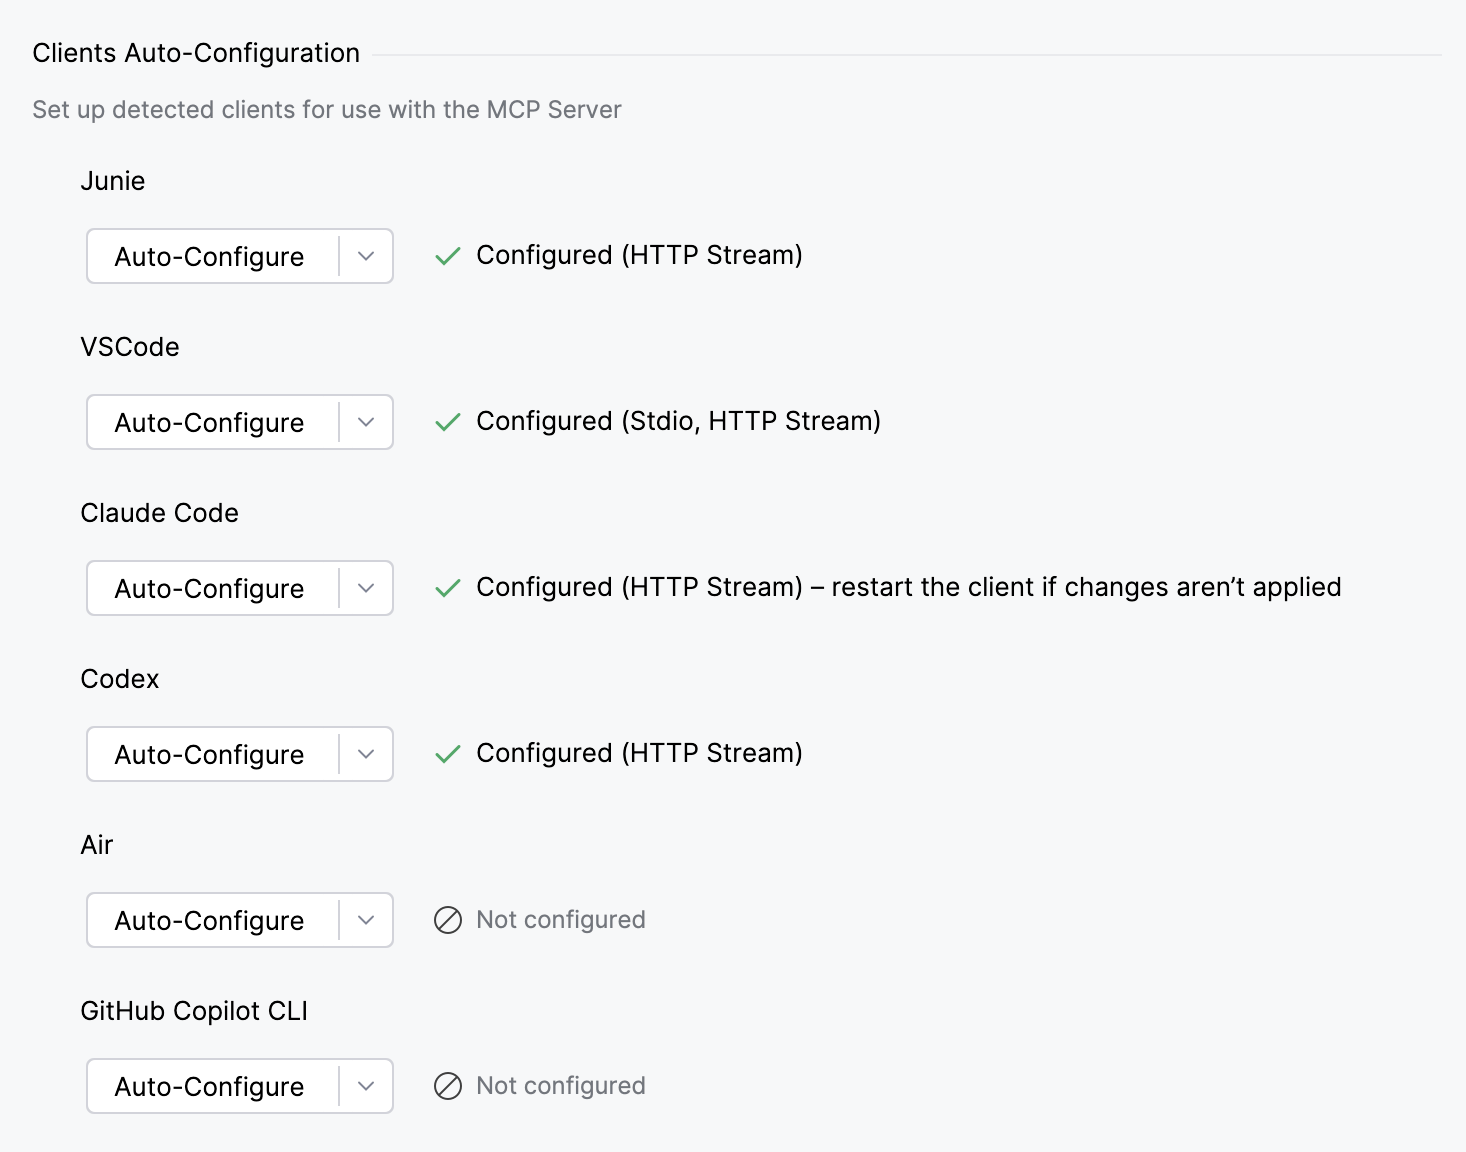
To configure a specific transport yourself, click
 next to Auto-Configure and select the required option from the list.
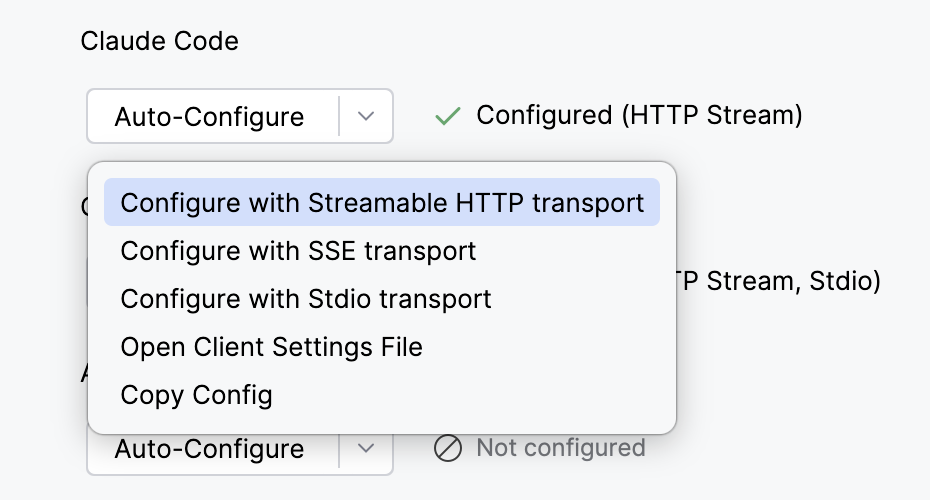
Restart your client for the configuration to take effect.
Project-level client setup
Some clients also read a configuration file from the project's working directory. For these clients, the IDE can write the connection settings directly to the configuration file in the currently opened project, so the MCP server is available only while you work on that project.
Use this option if you work with several projects and do not want the MCP server registered for every client session.
Go to .
In the Project Clients Auto-Configuration section, click Auto-Configure for each client you want to set up. This updates the client's project-level configuration file automatically.
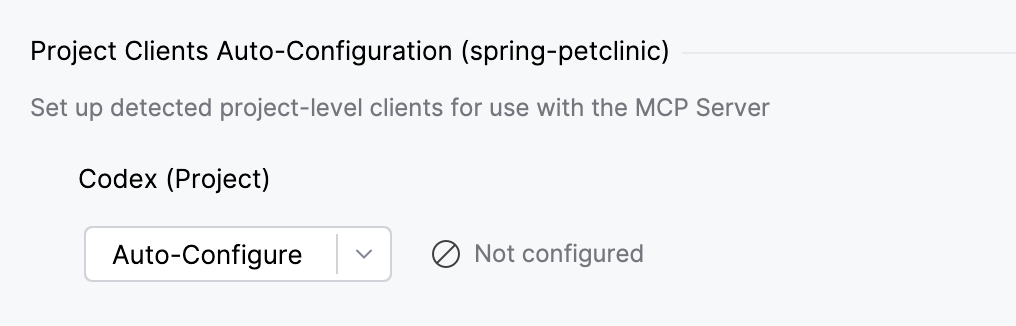
If you want to configure a specific transport mechanism, click
next to Auto-Configure and select the required option from the list.Restart your client for the configuration to take effect.
Manual client setup
If the client you want to connect is not on the list, configure it manually.
In the Manual Client Configuration section, click either Copy SSE Config, Copy Stdio Config, or Copy HTTP Stream Config depending on the connection type.
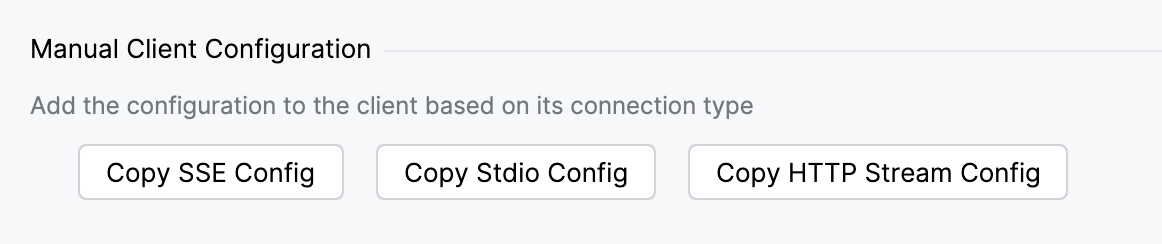
Paste the copied configuration into your client's settings or configuration file.
Restart your client for the configuration to take effect.
Execute actions without confirmation
The MCP server allows connected external clients to execute terminal commands or run configurations in the IDE without prompting for user confirmation each time.
To enable this mode:
Go to .
In the Command execution section, enable the Run shell commands or run configurations without confirmation (brave mode) setting.
Click Apply.
Show setup suggestions in terminal sessions
When Codex or Claude starts in a terminal session without a matching MCP server setup, the IDE can show a banner that suggests configuring the connection.
To control this behavior:
Go to .
In the Terminal Sessions section, select or clear the Show setup suggestions for Codex and Claude terminal sessions checkbox.
Click Apply.
Supported tools
The MCP Server exposes a set of tools that allow external clients to interact with your IDE and project – for example, to analyze code, modify files, run configurations, or execute terminal commands.
You can view and manage the full list of available tools in . For each tool, select or clear the Enabled checkbox to control whether the tool is exposed to external clients.
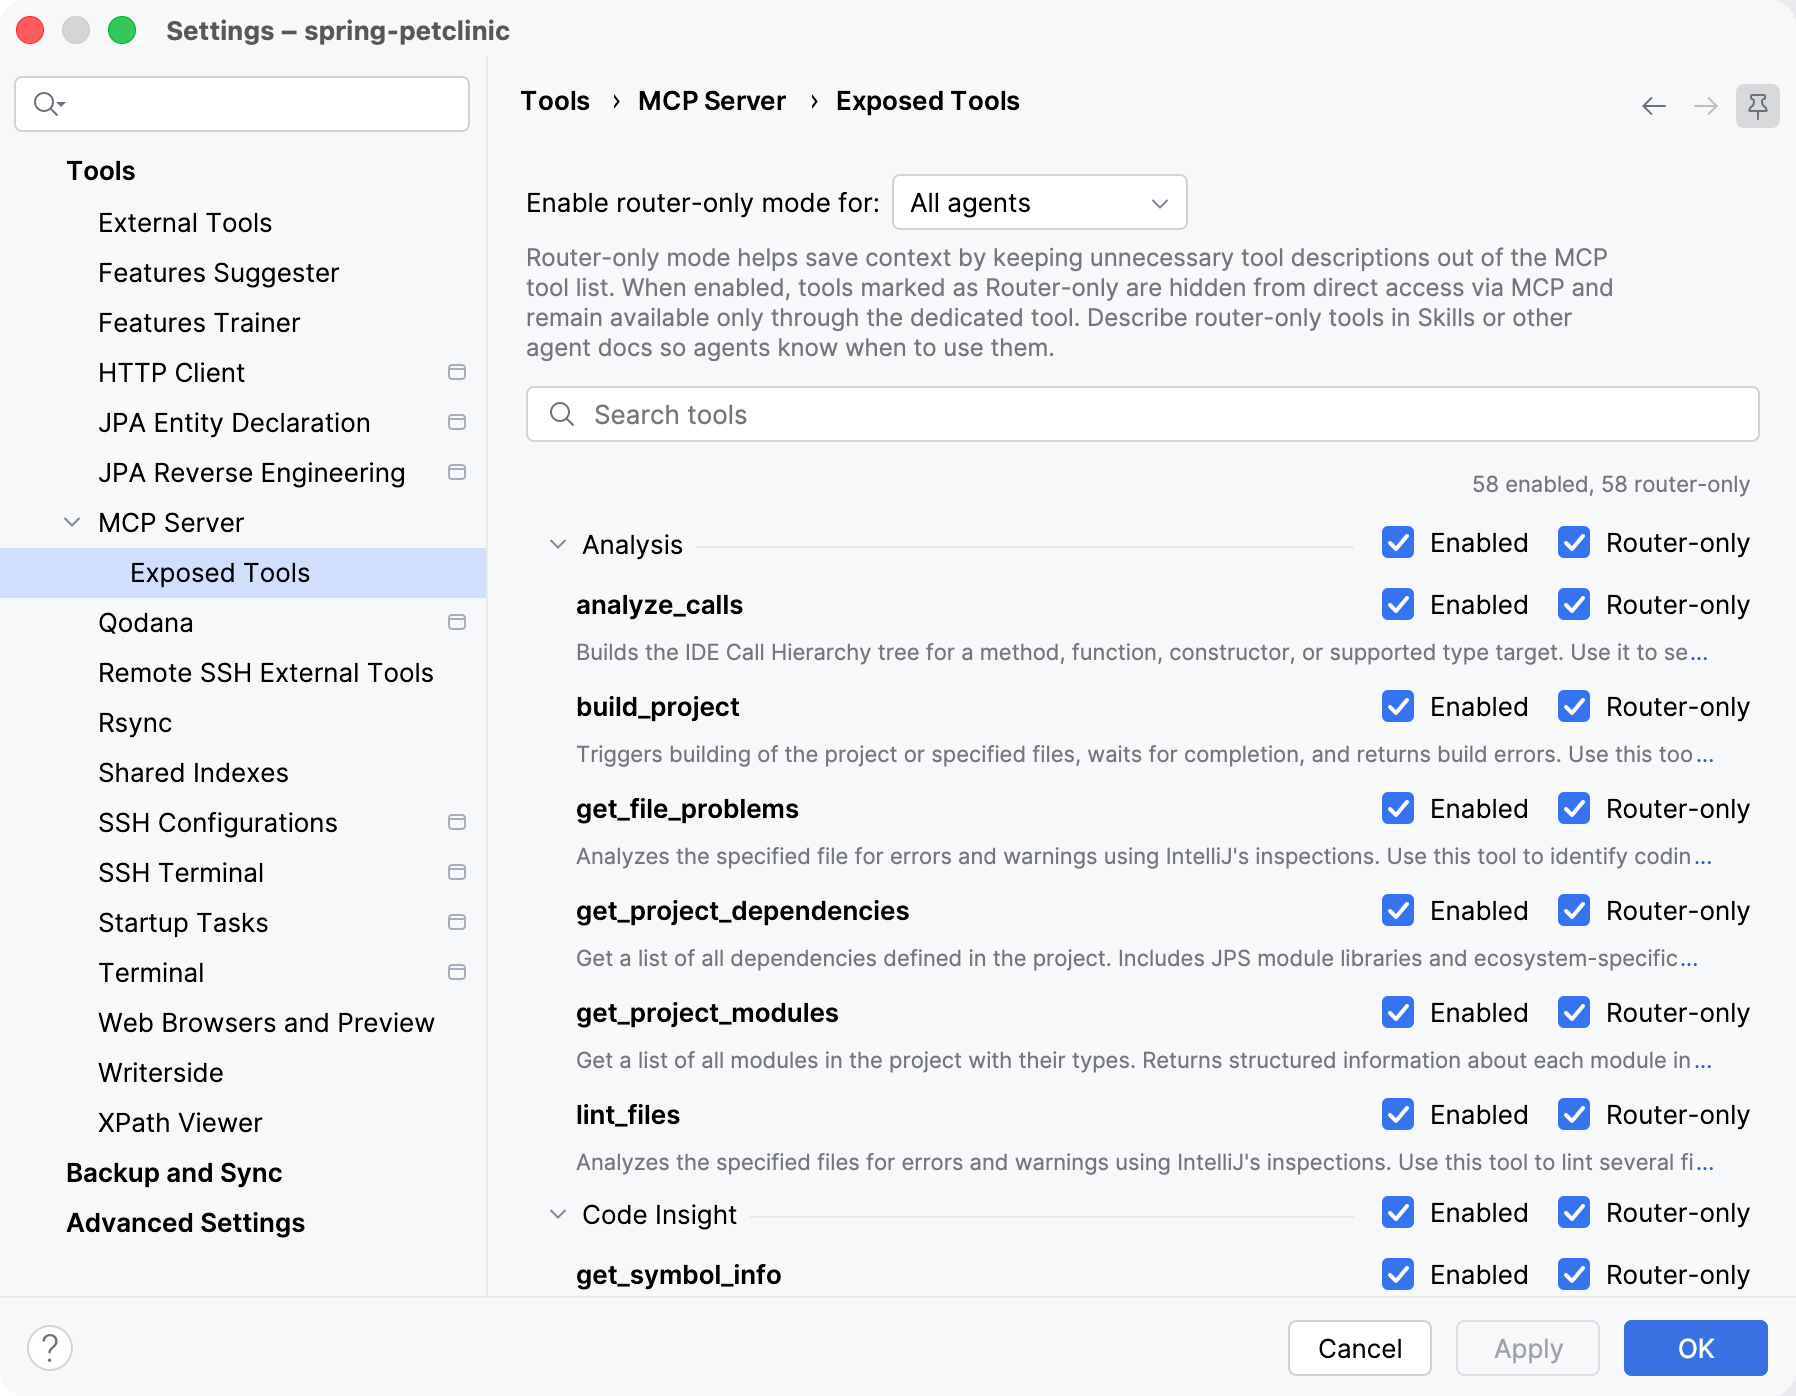
You can also select the Router-only checkbox for a tool. Router-only tools are hidden from the direct MCP tool list and remain available only through the dedicated router tool. This keeps unnecessary tool descriptions out of the tool list and saves context. Use the Enable router-only mode for setting to specify when router-only mode applies, for example, for All agents, or ACP agents only.
Below you can find the list of tools provided by the MCP server.
Analysis tools
- analyze_calls
Builds the IDE Call Hierarchy tree for a method, function, constructor, or supported type target. Use it to see who calls a symbol (
INCOMING_CALLS) or what the symbol calls (OUTGOING_CALLS).Prefer this tool over usage search, text search, or regex search when evaluating dependencies by actual calls. It uses IDE call hierarchy data, so it provides more precise call relationships with less noise and fewer follow-up calls than primitive searches.
Pass
symbolFqnas a fully qualified name, for examplecom.example.Service.run. If the name is ambiguous, the tool returns exact signatures; pass one of them back assymbolFqn. If you only know a short name or fragment, usesearch_symbolfirst to find the target.The result is an expandable text tree. Each node includes
filePathandtreePath;filePathis project-relative when possible. PasstreePathback to render the subtree. UsechildOffsetto continue after a truncated … and n more line.depth,maxChildren, andmaxNodesbound the rendered tree. Symbols can come from project sources, source jars, or decompiled binary jar dependencies when the IDE can resolve them.Parameters:
symbolFqn(required): Plain fully qualified symbol name, or an exact signature returned by an ambiguity error or copied from a rendered child node. If you only know a short name or fragment, usesearch_symbolfirst and pass the best fully qualified callable name here. Examples:com.example.Service.run,com.example.Service.run(String), ororg.assertj.core.api.Assertions.assertThat(String). Do not pass a file path, line, column, or a separate target signature.analysisKind(required): Call analysis direction. UseINCOMING_CALLSto show callers ofsymbolFqn, orOUTGOING_CALLSto show symbols called fromsymbolFqn.depth: Maximum number of call levels to render below the requested subtree root. Defaults to 5. Use 0 to render only the subtree root.maxChildren: Maximum number of direct children rendered for each node. Defaults to 50.maxNodes: Maximum total number of rendered call nodes. Defaults to 1000.treePath: Optional path to a subtree root, copied exactly from a previousanalyze_callsresult. Null or omitted means the root path[]. Each component is an exact signature, not a display name.childOffset: Offset for paging direct children of the node addressed bytreePath. Defaults to 0.timeout: Timeout in milliseconds.projectPath: The project path. Always provide this value if known to reduce ambiguous calls. If only the current working directory is known, you can use it as the project path.
- build_project
Triggers building of the project or specified files, waits for completion, and returns build errors. Use this tool to build the project or compile files and get detailed information about compilation errors and warnings.
You have to use this tool after performing edits to validate if the edits are valid.
Parameters:
rebuild: Whether to perform a full rebuild of the project. Defaults to false. Effective only whenfilesToRebuildis not specified.filesToRebuild: If specified, only compile files with the specified paths. Paths are relative to the project root.timeout: Timeout in milliseconds.projectPath: The project path. Always provide this value if known to reduce ambiguous calls. If only the current working directory is known, you can use it as the project path.
- get_file_problems
Analyzes the specified file for errors and warnings using IntelliJ inspections. Use this tool to identify coding issues, syntax errors, and other problems in a specific file.
Returns a list of problems, including severity, description, and location information.
Parameters:
filePath: Path relative to the project root.errorsOnly: Whether to include only errors or both errors and warnings.timeout: Timeout in milliseconds.projectPath: The project path. Always provide this value if known to reduce ambiguous calls. If only the current working directory is known, you can use it as the project path.
- get_project_dependencies
Returns a list of all dependencies defined in the project. Provides structured information about library names.
Parameters:
projectPath: The project path. Always provide this value if known to reduce ambiguous calls. If only the current working directory is known, you can use it as the project path.
- get_project_modules
Returns a list of all modules in the project with their types. Provides structured information about each module, including its name and type.
Parameters:
projectPath: The project path. Always provide this value if known to reduce ambiguous calls. If only the current working directory is known, you can use it as the project path.
- lint_files
Analyzes the specified files for errors and warnings using IntelliJ inspections. Use this tool to lint several files after editing them. Returns per-file problems with severity, description, and location information.
Batch responses may include file entries with
timedOut: trueand emptyproblemswhen individual files exceed the available budget. File entries with anotAnalyzedReasonindicate files that could not be analyzed, for example files outside project content roots, excluded files, or unsupported file types. A top-levelmore: truemeans the batch is incomplete.Parameters:
files(required): List of project-relative files to analyze. Duplicate paths are ignored after normalization.min_severity: Minimum severity to include:warningorerror. Defaults towarning.timeout: Timeout in milliseconds.projectPath: The project path. Always provide this value if known to reduce ambiguous calls. If only the current working directory is known, you can use it as the project path.
Code Insight tools
- get_symbol_info
Retrieves information about the symbol at the specified position in the specified file. Provides the same information as IntelliJ IDEA's Quick Documentation feature. The information may include the symbol's name, signature, type, documentation, and other details, depending on the programming language.
If the position references a symbol, the tool will return a code snippet with the symbol's declaration, if available. Use this tool to understand a symbol's declaration, semantics, and location.
Parameters:
filePath: Path relative to the project root.line: 1-based line number.column: 1-based column number.projectPath: The project path. Always provide this value if known to reduce ambiguous calls. If only the current working directory is known, you can use it as the project path.
Database-specific tools
To guarantee strictly read-only access for an AI agent, use a database user with properly restricted (read-only) privileges and configure the data source to use that user.
- cancel_sql_query
Cancel a running query using its unique ID.
Parameters:
sessionId: Query session ID.
- create_database_connection
Creates a new database connection (data source) by name, DBMS (
dbms), JDBC URL (url), and a flag to check the connection (needToCheckDs). All parameters are required. Returns connection diagnostic information.Parameters:
name(required): Unique name of the database connection.dbms: Name of the database management system (DBMS).url: Fully formed JDBC URL of the database connection, for examplejdbc:postgresql://<host>:<port>/<database>.needToCheckDs: Whether to test the connection right after the data source is created or edited. Set tofalsewhen configuring multiple connections in a batch — the per-connection probe is expensive, andtest_database_connectioncan be called explicitly for the connections that matter.projectPath: The project path. Always provide this value if known to reduce ambiguous calls. If only the current working directory is known, you can use it as the project path.
- edit_database_connection
Edits an existing database connection (data source) identified by
connectionId. Updates the connection's DBMS driver and JDBC URL; the connectionnameis preserved. Returns connection diagnostic information.Parameters:
connectionId: Unique connection ID.dbms: Name of the database management system (DBMS).url: Fully formed JDBC URL of the database connection, for examplejdbc:postgresql://<host>:<port>/<database>.needToCheckDs: Whether to test the connection right after the data source is created or edited. Set tofalsewhen configuring multiple connections in a batch — the per-connection probe is expensive, andtest_database_connectioncan be called explicitly for the connections that matter.projectPath: The project path. Always provide this value if known to reduce ambiguous calls. If only the current working directory is known, you can use it as the project path.
- execute_sql_query
Execute a SQL query against the given database connection.
The tool reports execution status: success or error. For errors, it also provides an error description.
If the query returns data, it is appended to the tool response in CSV format.
Parameters:
connectionId: Unique connection ID.queryText: SQL query to be executed.
- fetch_query_result
Fetches rows from an already executed query by its ID, starting at the given row offset. Returns the same shape as
execute_sql_query: theresultSetIdand the rendered result in CSV format.Use this tool to paginate over a
resultSetIdpreviously returned byexecute_sql_queryorpreview_table_data.Parameters:
resultSetId(required): The opaque result-set ID returned by a previousexecute_sql_queryorpreview_table_datacall.offset(required): Row offset to start fetching from. Defaults to 0.projectPath: The project path. Always provide this value if known to reduce ambiguous calls. If only the current working directory is known, you can use it as the project path.
- get_database_object_description
Retrieves the structure of a database object (columns, types, keys, indexes) within a particular schema as a hierarchical text representation.
In case of ambiguity returns definitions of all applicable objects.
Parameters:
connectionId: Unique connection ID.databaseName: Name of the database the schema belongs to. Can be empty if the DBMS has no databases but only schemas.schemaName: Name of the schema.kind: Set this parameter to a particular object kind code to list only objects of that kind. Set it to null to retrieve all objects in the schema.objectName: Object name of the specified kind (e.g., table or view name). May not be empty.projectPath: The project path. Always provide this value if known to reduce ambiguous calls. If only the current working directory is known, you can use it as the project path.
- introspect_schema
Introspects a database schema, loading its metadata (tables, columns, and indexes) into the local model. Use this when a schema's
isIntrospectedflag is false and you need to investigate the schema's structure, or to refresh stale metadata. Returns the schema identifier with the updated introspection status.Parameters:
connectionId: Unique connection ID.databaseName: Name of the database the schema belongs to. Can be empty if the DBMS has no databases but only schemas.schemaName: Name of the schema.projectPath: The project path. Always provide this value if known to reduce ambiguous calls. If only the current working directory is known, you can use it as the project path.
- list_database_connections
Retrieves a list of configured database connections or data sources in the project. For each connection returns its unique ID, name, DBMS, and driver name.
- list_database_schemas
Retrieves a list of database schemas in the specified database connection.
For each schema, the tool returns the schema's own name as well as the database name (empty if not applicable).
Parameters:
connectionId: Unique connection ID.selectedOnly: True if only the schemas selected in the database tree should be listed; false if all schemas should be listed.
- list_recent_sql_queries
This feature is not available in free subscription plans.
Retrieves a list of recent, including currently running, queries for the given database connection.
For each query returns:
Unique ID of a query session.
Time spent on running the query (in milliseconds).
The current state of the query. For example, running, cancelling, finished, and so on.
Completion status of the query. For example, success, finished with error, cancelled, and so on.
Text of the query.
Parameters:
connectionId: Unique connection ID.
- list_schema_object_kinds
Retrieves a list of supported schema object kinds for the given database connection. For each object kind, returns the object kind unique code and human-readable name.
Parameters:
connectionId: Unique connection ID.
- list_schema_objects
Retrieves a list of database objects within the given schema. For each object, returns the object name within the schema and its kind.
Parameters:
connectionId: Unique connection ID.schemaName: Name of the schema.databaseName: Name of the database the schema belongs to. Can be empty if the DBMS has no databases but only schemas.kind: Set this parameter to a particular object kind code to list only objects of that kind. Set it to null to retrieve all objects in the schema.
- preview_table_data
Returns preview data of the table, view, materialized view, or other table-like object using a given database connection.
The tool returns table content in CSV format.
Parameters:
connectionId: Unique connection ID.schemaName: Name of the schema.databaseName: Name of the database the schema belongs to. Can be empty if the DBMS has no databases but only schemas.tableName: Name of the table.maxRowCount: Maximum number of rows to return. Default is100.
- test_database_connection
Returns connection diagnostic info:
Flag indicating if the connection is problematic: yes, no, or unknown.
Detailed information about the database connection such as DBMS type, version, and JDBC driver.
Summary of the connection attempt result. In case of a failure, contains a DBMS-provided error description.
Parameters:
id: Unique connection ID.
Execution tools
- execute_run_configuration
Run either an existing run configuration by name or a temporary run configuration created from a code location (
filePath+line) in the current project, then wait up to the specified timeout for it to finish. Use this tool with either a configuration name returned byget_run_configurations, or with a run point (filePath+line) returned byget_run_configurations(filePath = ...).Optional launch overrides (
programArguments,workingDirectory,envs) are applied only for this run and are not persisted. Do not pass these override parameters unless you explicitly need to change the configured launch values for this run. Missing/null override parameters keep existing run configuration values unchanged. For string overrides (programArguments,workingDirectory), missing/null or empty string ("") keeps the existing value unchanged. Pass a whitespace-only string such as" "to clear an existing value for this launch.Pass either
configurationName, orfilePathtogether withline. These modes are mutually exclusive.Behavior:
When
waitForExit=true, waits up totimeoutmilliseconds for process termination. If the timeout expires, the process keeps running in the background andexitCodeis omitted from the result.When
waitForExit=false, waits only for the process to start, then returns immediately without applyingtimeout.fullOutputPathpoints to a temp file with the full raw output and may continue growing while the process is alive.
Returns the execution result including current output snapshot, optional exit code, and optional
fullOutputPath.Parameters:
configurationName: Name of the existing run configuration to execute.filePath: File path relative to the project root. Provide together withlineto create and execute a temporary run configuration from code context.line: 1-based line number forfilePath. Provide together withfilePathand do not combine withconfigurationName.timeout: Timeout in milliseconds.waitForExit: Whether to wait for process termination. If false, the tool returns immediately after the process starts and ignorestimeout.programArguments: Optional program arguments override for this launch only. Missing/null or empty string keeps the existing value; whitespace-only string clears it.workingDirectory: Optional working directory override for this launch only. Missing/null or empty string keeps the existing value; whitespace-only string clears it.envs: Optional environment variable overrides for this launch only. Missing/null keeps existing env unchanged; when provided, values are merged over existing env.projectPath: The project path. Always provide this value if known to reduce ambiguous calls. If only the current working directory is known, you can use it as the project path.
- get_run_configurations
Returns either project run configurations or executable code locations, depending on the input.
Without
filePath, this tool lists the project's existing run configurations. The result includes configuration names and, when available, launch details such as program arguments, working directory, environment variables, andsupportsDynamicLaunchOverrides.supportsDynamicLaunchOverridesis the source-of-truth capability flag for one-time launch overrides (programArguments,workingDirectory,envs) inexecute_run_configurationandxdebug_start_debugger_session. Only pass those override parameters when this flag istruefor the selected configuration.With
filePath, this tool discovers executable entry points (run points) in that file, such as test methods, main methods, or other executable entry points where the IDE shows a Run gutter icon. The result containsfilePathandrunPoints; use the returned line numbers withexecute_run_configurationto run from code.Parameters:
filePath: Optional file path relative to the project root. When provided, returns run points (executable entry points) in the file instead of project-wide run configurations.projectPath: The project path. Always provide this value if known to reduce ambiguous calls. If only the current working directory is known, you can use it as the project path.
File tools
- create_new_file
Creates a new file at the specified path within the project directory. Optionally, writes the provided text into the file.
Parameters:
pathInProject: Path where the file should be created relative to the project root.text(optional): Content to write into the new file.overwrite: Whether to overwrite an existing file. If set tofalse, an exception is thrown in case of a conflict.projectPath: The project path. Always provide this value if known to reduce ambiguous calls. If only the current working directory is known, you can use it as the project path.
- get_all_open_file_paths
Returns the paths of all files opened for editing in the active editor or any other open editors, relative to the project root. Use this tool to explore currently open editors.
Parameters:
projectPath: The project path. Always provide this value if known to reduce ambiguous calls. If only the current working directory is known, you can use it as the project path.
- list_directory_tree
Provides a tree representation of the specified directory in the pseudo-graphic format, similar to the
treeutility. Use this tool to explore the contents of a directory or the entire project. Prefer this tool over command-line utilities likelsordirfor directory listing.Parameters:
directoryPath: Path relative to the project root.maxDepth: Maximum recursion depth.timeout: Timeout in milliseconds.projectPath: The project path. Always provide this value if known to reduce ambiguous calls. If only the current working directory is known, you can use it as the project path.
- open_file_in_editor
Opens the specified file in the JetBrains IDE editor. Requires a
filePathparameter containing the path to the file to open. The file path can be absolute or relative to the project root.Parameters:
filePath: Path relative to the project root.projectPath: The project path. Always provide this value if known to reduce ambiguous calls. If only the current working directory is known, you can use it as the project path.
Formatting tools
- reformat_file
Reformats the specified file in the JetBrains IDE. Use this tool to apply code formatting to a file identified by its path.
Parameters:
path: Path relative to the project root.projectPath: The project path. Always provide this value if known to reduce ambiguous calls. If only the current working directory is known, you can use it as the project path.
Go profiler tools
Starting with version 2026.3, you can use these tools to run Go applications with the profiler, capture profiles, and analyze saved profiles. Enable the bundled MCP server before using them.
A profiling session identifies a run and has an ID such as s1. You can inspect output and capture profiles for runs started from the IDE or through MCP. Only stop_profiled_run is restricted to MCP-launched runs. Profile capture requires a running application with a ready profiler.
Profiles captured through MCP are saved as PPROF files in the configured profile directory and added to Recent profiles and the session's profile list. They are not opened automatically in the Go Optimization tool window.
Each session has one CPU recording shared by MCP tools and the IDE toolbar. You can stop an agent-started recording from the IDE, and an agent can stop a recording you started from the IDE. Starting another CPU recording while one is active returns an error.
- run_with_profiler
Launches an existing local Go Build run configuration with the profiler. The configuration needs to build and run an application. Test configurations and configurations with a remote run target are not supported.
The launch follows the MCP server's command-execution confirmation settings. If the configuration is already running, stop that run or enable parallel runs in the configuration before starting another instance.
Parameters:
runConfig: Required string. The exact name of the run configuration. Useget_run_configurationsto list existing configurations.projectPath: The project path. Always provide this value if known to reduce ambiguous calls. If only the current working directory is known, you can use it as the project path.
Returns an object with
session, the session ID, andprofiles, a map of available profile names to sample types. The map includes only profiles available in the running application:Profile name
Sample types
cpusamples,cpuheap,heap_gc,allocsalloc_objects,alloc_space,inuse_objects,inuse_spaceblock,mutexcontentions,delaygoroutinegoroutinegoroutineleakgoroutineleakThe result describes available types, not collected profile data. Use
take_profileor the CPU recording tools to capture data.- stop_profiled_run
Stops the application for an active session launched by
run_with_profiler, without another confirmation dialog. To stop a run you started from the IDE, use the IDE controls.Parameters:
session: Required string. The session ID returned byrun_with_profiler.projectPath: The project path. Always provide this value if known to reduce ambiguous calls. If only the current working directory is known, you can use it as the project path.
Waits up to 30 seconds for the process to stop. On success, returns
Profiled run stopped for session '<id>'. If the process does not stop within that time, returns an error.- list_profiled_runs
Lists running and recently stopped profiler sessions, including runs started from the IDE. The list retains all running runs and the five most recently stopped runs until you close the project. A listed run may still be starting or may have failed before the profiler became ready.
Parameters:
projectPath: The project path. Always provide this value if known to reduce ambiguous calls. If only the current working directory is known, you can use it as the project path.
Returns
runswithsession,name,isRunning, andexitCodewhen available. The list is ordered by the most recent start or stop.- get_profiled_run_output
Reads captured standard output and standard error for a running or retained stopped session. IDE system messages are excluded. Each run retains up to 1,000,000 characters; older lines are dropped when the buffer is full. Output is cleared when you close the project.
Parameters:
session: Required string. A session ID fromrun_with_profilerorlist_profiled_runs.startLine: Optional integer. A zero-based line index. Defaults to the earliest retained line. An index outside the available range returns an error.maxLines: Integer from 1 to 1000. Defaults to 200.projectPath: The project path. Always provide this value if known to reduce ambiguous calls. If only the current working directory is known, you can use it as the project path.
Returns
output,startLine,endLine,availableStartLine,availableEndLine,isRunning, andexitCodewhen available. End indexes are exclusive. PassendLineas the nextstartLineto continue reading. If the last line is incomplete, reread that line's index to get text appended to it.- take_profile
Captures a profile from a running session and saves it as a PPROF file.
Parameters:
session: Required string. A session ID fromrun_with_profilerorlist_profiled_runs.kind: Required string. An available profile name, such ascpu,heap, orheap_gc. Refer torun_with_profilerfor the profile names.duration: Integer from 1 to 300, in seconds. Required forcpu. Omit it for all other profile kinds.projectPath: The project path. Always provide this value if known to reduce ambiguous calls. If only the current working directory is known, you can use it as the project path.
Returns
session,kind,pathto the saved file, andsummaryas described inprofile_summaryfor the profile's default sample type. If the summary cannot be built,summaryErrorexplains why. The profile remains saved atpath.For example,
{"session":"s1","kind":"cpu","duration":30}records a 30-second CPU profile. Canceling a timed CPU capture cancels that recording without saving a profile.- start_cpu_recording
Starts CPU recording for a running session. Use this with
stop_cpu_recordingto record a workload without specifying its duration in advance.Parameters:
session: Required string. A session ID fromrun_with_profilerorlist_profiled_runs.projectPath: The project path. Always provide this value if known to reduce ambiguous calls. If only the current working directory is known, you can use it as the project path.
Returns
CPU recording started for session '<id>'.- stop_cpu_recording
Stops the session's current CPU recording and saves the profile. The application keeps running. The recording can have been started from the IDE or through MCP. Returns an error if no CPU recording is active.
Parameters:
session: Required string. A running session ID with an active CPU recording.projectPath: The project path. Always provide this value if known to reduce ambiguous calls. If only the current working directory is known, you can use it as the project path.
Returns
session,kind,pathto the saved file, andsummaryas described inprofile_summaryfor the profile's default sample type. If the summary cannot be built,summaryErrorexplains why. The profile remains saved atpath.- list_profiles
Lists saved profiles from recent history, open tabs, or a running session.
Parameters:
scope:recent(default),open, orsession. Therecentscope lists Recent profiles history, which retains up to 20 entries. Theopenscope lists profile tabs in the Go Optimization tool window, with the selected tab first. Thesessionscope lists profiles captured for a running session. Recent and session profiles are listed newest first.session: String required whenscopeissession. Omit it for other scopes. Stopped sessions are not supported by this scope.limit: Integer from 1 to 200. Defaults to 5.projectPath: The project path. Always provide this value if known to reduce ambiguous calls. If only the current working directory is known, you can use it as the project path.
Returns
scopeandprofiles. Each entry containspath,kindwhen known, andselectedfor theopenscope.- profile_summary
Summarizes a saved profile with totals, CPU use, and up to five functions with the highest costs.
take_profileandstop_cpu_recordingalready return this summary. Use this tool to analyze another file or sample type, or retry a failed summary.Parameters:
profile: Required string. Path to a PPROF file, such as a path returned bytake_profile,stop_cpu_recording, orlist_profiles.sampleType: Optional string, such ascpuorinuse_space. Defaults to the profile's declared default sample type, or its last sample type if no valid default is declared.projectPath: The project path. Always provide this value if known to reduce ambiguous calls. If only the current working directory is known, you can use it as the project path.
Each sample counts toward the deepest project function in its call stack. If no project function is found, it counts toward the deepest non-SDK Go function, or the leaf (innermost) function if neither is found. The first two choices exclude generated code.
A project function's cost includes library and runtime calls, but calls to other project functions count toward those functions. To include calls to other project functions, use
profile_top_frameswithsortBy=cumulative.Returns
totalsfor every sample type, with itssampleType,total, andunit. If the profile records a duration, the result includesduration. For CPU profiles with a duration,cpuPercentshows CPU time as a percentage of elapsed time. Values above 100 indicate work on more than one CPU core.The
hottestlist contains up to five functions, ordered by the largest absolute cost.shownPercentis the magnitude of their net cost as a percentage of the profile's total. Each function includes:functionandfile: The function name and recorded source path.costandcostPercent: The attributed cost and its percentage of the profile's total.selfPercent: The share of the function's cost spent in its own code.callees: Up to three directly called functions, ordered by absolute cost. Each has afunctionname and apercentof at least 5% of the parent function's cost before rounding. Only samples attributed to the parent count.lines: Up to three lines with the highest absolute costs, each with a one-basedlinenumber,cost, andsourcetext when available. The list is empty if the profile has no line information.pathandpathPercent: The highest-cost call path, with at most six callers, and its share of the function's cost. Paths use theprofile_call_pathsnotation. A low percentage means the cost is spread across multiple paths.
In comparison profiles,
selfPercent, callee percentages, andpathPercentcan exceed 100 because costs with opposite signs can offset each other. For shared result conventions, refer to Read profile analysis results.- profile_top_frames
Ranks functions in a saved profile, like
go tool pprof -top. Theselfvalue measures work in the function itself;cumulativealso includes functions it calls. If a function has a high cumulative value but a low self value, userootto examine the functions it calls.Parameters:
profile: Required string. Path to a PPROF file, such as a path returned bytake_profile,stop_cpu_recording, orlist_profiles.root: Optional nonempty string. A case-insensitive function-name substring. Restricts results to frames under the matching functions. Returns an error if nothing matches.sampleType: Optional string, such ascpuorinuse_space. Defaults to the profile's declared default sample type, or its last sample type if no valid default is declared.sortBy:self(default) orcumulative. Sorts by the largest absolute value first.limit: Integer from 1 to 200. Defaults to 10.projectPath: The project path. Always provide this value if known to reduce ambiguous calls. If only the current working directory is known, you can use it as the project path.
Returns
frameswith function names, source paths, start lines, self and cumulative values, and their percentages. The result includes availablesampleTypes,totalFramesbefore the limit, andshownPercentfor the returned frames. Withroot, it also reportsmatchedRoots,scopedTotal, andscopedPercent; frame percentages use that scoped total.If the profile records a duration, the result includes
duration. For CPU profiles with a duration,cpuPercentshows CPU time as a percentage of elapsed time. Values above 100 indicate work on more than one CPU core. For shared result conventions, refer to Read profile analysis results.- profile_call_paths
Finds the callers of matching functions. Use it after
profile_top_frameswhen a function has a high cost and you need to find the callers that cause it. Each path ends at its first matching function from the stack root, so nested matches count under the outer match.Parameters:
profile: Required string. Path to a PPROF file, such as a path returned bytake_profile,stop_cpu_recording, orlist_profiles.target: Required nonempty string. A case-insensitive function-name substring. Returns an error if nothing matches.sampleType: Optional string, such ascpuorinuse_space. Defaults to the profile's declared default sample type, or its last sample type if no valid default is declared.depth: Integer from 1 to 64. The maximum number of callers retained above the target. Defaults to 12. A recursive function counts as one caller. Longer paths drop callers from the stack root and start with….limit: Integer from 1 to 50. Defaults to 5.projectPath: The project path. Always provide this value if known to reduce ambiguous calls. If only the current working directory is known, you can use it as the project path.
Returns
paths, ordered by the largest absolute cumulative value, andmatchedTargets. Each path contains function names separated by>, its cumulative value, and its percentage oftargetTotal. The result also includestargetPercent,shownPercent, andtotalPathsbefore the limit.Repeated calls are combined:
×3marks three occurrences, and×3-19marks a range across combined paths. Theindirectsuffix marks a loop through omitted functions. Useprofile_top_frameswithrootto inspect them. For shared result conventions, refer to Read profile analysis results.- profile_source_lines
Ranks source lines in matching functions by cumulative cost, like
go tool pprof -list. Use it afterprofile_top_framesto locate expensive lines within a function. Paths and line numbers refer to the profiled build; your current source files can differ.Parameters:
profile: Required string. Path to a PPROF file, such as a path returned bytake_profile,stop_cpu_recording, orlist_profiles.function: Required nonempty string. A case-insensitive function-name substring. Combines all matching functions. Returns an error if nothing matches or the profile has no line information or samples for the matching functions and selected sample type.sampleType: Optional string, such ascpuorinuse_space. Defaults to the profile's declared default sample type, or its last sample type if no valid default is declared.limit: Integer from 1 to 200. The maximum number of lines across all matching functions. Defaults to 20.projectPath: The project path. Always provide this value if known to reduce ambiguous calls. If only the current working directory is known, you can use it as the project path.
Returns
functionswith function names, source paths, andlines. Each line contains its one-based line number,self,cumulative, andsourcetext when available. The tool selects the lines with the largest absolute cumulative values before grouping them by function and file.totalLinescounts lines before the limit. For shared result conventions, refer to Read profile analysis results.
Read profile analysis results
The analysis tools read saved PPROF files and do not require a running session. Results include the selected sampleType, the complete profile's total, and the unit used for values: ms for time, MB for memory (1 MB = 1,048,576 bytes), or the profile's original unit for other measurements. Values are rounded to two decimal places.
In profile_summary and profile_source_lines, source contains the current saved line, with indentation but without the newline. This text can differ from the profiled build. The field is absent if the source is unavailable or the file match is ambiguous. An empty string represents a blank line.
Generic type arguments appear as [...], and the analysis combines instantiations of the same generic function. Function-name queries use the same shortened form. For example, Sum[go.shape.int] matches Sum[...].
For a comparison profile, the result includes diff=true. Positive values mean the measured value grew, and negative values mean it shrank. Percentages use absolute values, so use the signed values to distinguish increases from decreases.
Inspection Generator MCP Tools
- validate_inspection_kts
Validates an inspection.kts script against specification examples. Compiles the inspection and runs it against positive/negative examples. Returns compilation status and detailed verification results.
Positive examples should trigger the inspection (problems expected). Negative examples should NOT trigger the inspection (no problems expected on forbidden lines).
Returns overall success, per-example results, and aggregation statistics.
Parameters:
inspectionKtsCode: The inspection.kts script content to compile and validate.pathToSpecification: Path to specification with examples to validate against.projectPath: The project path. Always provide this value if known to reduce ambiguous calls. If only the current working directory is known, you can use it as the project path.
Inspection KTS MCP tools
- generate_inspection_kts_api
Returns the Inspection KTS API documentation for the target language. Provides available classes and functions that can be used when writing inspection.kts files.
Parameters:
language: Target language: 'Java' or 'Kotlin'.wrapInTags: If true, wraps the API content in<API>and<api.kt>tags.projectPath: The project path. Always provide this value if known to reduce ambiguous calls. If only the current working directory is known, you can use it as the project path.
- generate_inspection_kts_examples
Returns example inspection.kts templates for the target language to guide code generation. Provides XML-wrapped examples showing how to write inspections using the InspectionKts API.
Parameters:
language: Target language: 'Java' or 'Kotlin'.includeAdditionalExamples: If true, includes additional curated examples besides templates.projectPath: The project path. Always provide this value if known to reduce ambiguous calls. If only the current working directory is known, you can use it as the project path.
- generate_psi_tree
Creates a PSI tree for the provided Java or Kotlin code and returns it as indented text. Use this tool to understand the PSI structure of code snippets when writing inspections. The output shows element types and their hierarchy, with hints about when
node.children()is needed.Parameters:
code: Source code snippet to parse.language: Target language: 'Java' or 'Kotlin'.projectPath: The project path. Always provide this value if known to reduce ambiguous calls. If only the current working directory is known, you can use it as the project path.
- run_inspection_kts
Compiles an inspection.kts script and runs it against a target file. Returns compilation errors if any, or the list of problems found by the inspection. Use this tool to test inspection.kts scripts during development.
Parameters:
inspectionKtsCode: The inspection.kts script content to compile and run.contextPath: Relative path of the target file inside project to analyze (for example, src/my/package/Example.kt).targetFileContent: The content of the target file to analyze. If not provided, the file must exist in the project.projectPath: The project path. Always provide this value if known to reduce ambiguous calls. If only the current working directory is known, you can use it as the project path.
Patch tools
- apply_patch
Applies a patch in the Codex
apply_patchformat or the unified Git diff format. Supports Add, Delete, and Update operations, with an optional move-to path for updates. Paths must stay inside the project directory.Parameters:
input: Patch text in theapply_patchformat or the unified Git diff format.patch: Alias ofinputfor compatibility with clients that send{patch: ...}.projectPath: The project path. Always provide this value if known to reduce ambiguous calls. If only the current working directory is known, you can use it as the project path.
Read tools
- read_file
Reads a file in the project directory or from any project dependency or other project source root. Can read sources inside Jar/Jrt files and decompile Java class files inside Jar/Jrt files or on disk. Returns numbered lines (1-indexed) as text.
Modes:
slicelinesline_columnsoffsetsindentation
Mode details:
sliceusesstart_lineandmax_lines.linesusesstart_line/end_line(inclusive).line_columnsusesstart_line/start_columnandend_line/end_column(endis exclusive;end_linedefaults tostart_line).offsetsusesstart_offset/end_offset(endis exclusive).indentationusesstart_linewithmax_levels/include_*.
max_linescaps the total output in all modes;context_linesapplies to range modes (per side).Parameters:
file_path: Path to the file. Supports project-relative paths, paths with '..', absolute paths, archive entries like /path/lib.jar!/pkg/Foo .class, and URLs such as file://, jar://, and jrt://. Any path returned from the other tools can be passed as is (e.g. paths fromsearch_*tools).mode: Read mode:slice,lines,line_columns,offsets, orindentation.start_line: 1-based line number to start reading from.max_lines: Maximum number of lines to return (slice uses as line count; all modes cap output).end_line: 1-based end line forlines/line_columnsmode (inclusive forlines; exclusive forline_columns).start_column: 1-based start column forline_columnsmode.end_column: 1-based end column for range read (exclusive).start_offset: 0-based start offset for offsets mode (requiresend_offset).end_offset: 0-based end offset for offsets mode (exclusive).context_lines: Number of context lines to include around the range (per side).max_levels: Indentation mode: maximum indentation levels to include (0 = only anchor block).include_siblings: Indentation mode: include sibling blocks at the same indentation level.include_header: Indentation mode: include header comments/annotations directly above anchor.projectPath: The project path. Always provide this value if known to reduce ambiguous calls. If only the current working directory is known, you can use it as the project path.
Refactoring tools
- rename_refactoring
Renames a symbol (variable, function, class, etc.) in the specified file. Use this tool to perform rename refactoring operations.
Unlike a simple text search-and-replace, the
rename_refactoringtool is a context-aware utility that understands the code's structure. It intelligently updates all references to the specified symbol throughout the project, ensuring code integrity and preventing broken references. It is always the preferred method for renaming programmatic symbols.The tool returns a success message if the rename operation was successful, or an error message if the file or symbol cannot be found, or if the rename operation fails.
Parameters:
pathInProject: Path relative to the project root.symbolName: Name of the symbol to rename.newName: New name for the symbol.projectPath: The project path. Always provide this value if known to reduce ambiguous calls. If only the current working directory is known, you can use it as the project path.
Search tools
- search_file
Searches for files by glob pattern within the project. Use this tool when you need to match file paths using glob syntax.
Glob patterns are relative to the project root.
Examples:
"**/*.kt""src/**/Foo*.java""build.gradle.kts"
Patterns without
'/'are treated as"**/pattern".pathsare optional additional glob filters relative to the project root.Parameters:
q: Glob pattern to search for.paths: Optional list of project-relative glob patterns to filter results. Supports!excludes. Trailing/expands to**. Patterns without/are treated as**/pattern. Empty strings are ignored.includeExcluded: Whether to include excluded/ignored files in results.limit: Maximum number of results to return.projectPath: The project path. Always provide this value if known to reduce ambiguous calls. If only the current working directory is known, you can use it as the project path.
- search_regex
Searches for regex matches within project files. Use this tool when you need regex search with snippet results. Results include match coordinates when available (1-based line/column, 0-based offsets).
Paths are glob patterns relative to the project root.
Examples:
["src/**", "!**/test/**"]["**/*.kt"]["foo/"]
Parameters:
q: Regex pattern to search for.paths: Optional list of project-relative glob patterns to filter results. Supports!excludes. Trailing/expands to**. Patterns without/are treated as**/pattern. Empty strings are ignored.limit: Maximum number of results to return.projectPath: The project path. Always provide this value if known to reduce ambiguous calls. If only the current working directory is known, you can use it as the project path.
- search_symbol
Searches for symbols (classes, methods, fields). Use this tool for semantic lookup by identifier fragments. Results include match coordinates when available (1-based line/column, 0-based offsets).
Paths are glob patterns relative to the project root.
By default, this searches project symbols only. If you don't find a suitable result, try again with
include_external=trueto search SDK and library symbols too.Parameters:
q: Symbol query text.paths: Optional list of project-relative glob patterns to filter results. Supports!excludes. Trailing/expands to**. Patterns without/are treated as**/pattern. Empty strings are ignored.include_external: Whether to include SDK and library symbols. Disabled by default; if nothing suitable is found, try again withinclude_external=true.limit: Maximum number of results to return.projectPath: The project path. Always provide this value if known to reduce ambiguous calls. If only the current working directory is known, you can use it as the project path.
- search_text
Searches for a text substring within project files. Use this tool for fast text search with snippet results. Results include match coordinates when available (1-based line/column, 0-based offsets).
Paths are glob patterns relative to the project root.
Examples:
["src/**", "!**/test/**"]["**/*.kt"]["foo/"]
Parameters:
q: Text to search for.paths: Optional list of project-relative glob patterns to filter results. Supports!excludes. Trailing/expands to**. Patterns without/are treated as**/pattern. Empty strings are ignored.limit: Maximum number of results to return.projectPath: The project path. Always provide this value if known to reduce ambiguous calls. If only the current working directory is known, you can use it as the project path.
Skill Search tools
- skill_search
Performs a unified project search with an explicit mode:
file: glob path search.text: literal content search.regex: regex content search.symbol: semantic symbol lookup.
Symbol search is project-focused by default. If you do not find a suitable symbol, try again with
include_external=trueto search SDK and library symbols too.Parameters:
mode(required): Search mode:file,text,regex, orsymbol.q(required): Search query. Formode=filethis is a glob pattern.paths: Optional project-relative glob filters. Supports!-excludes and a trailing/.include_external: Whether to include SDK and library symbols formode=symbol. Disabled by default; if nothing suitable is found, try again withinclude_external=true.includeExcluded: Whether to include excluded or ignored files. Supported only formode=file.limit: Maximum number of results to return.projectPath: The project path. Always provide this value if known to reduce ambiguous calls. If only the current working directory is known, you can use it as the project path.
Terminal tools
- execute_terminal_command
Executes a specified shell command in the IDE's integrated terminal. Use this tool to run terminal commands within the IDE environment.
Important features and limitations:
Checks if a process is running before collecting output.
Limits output to 2000 lines (truncates any excess).
Times out after the specified timeout, with a notification.
Requires user confirmation unless Brave Mode is enabled in the settings.
Returns possible responses:
Terminal output (truncated if over 2000 lines).
Output with an interruption notice if the command times out.
Error messages for various failure cases.
Parameters:
command: Shell command to execute.executeInShell: Whether to execute the command in the user's default shell (bash, zsh, etc.). Useful if the command is a shell script or if it is important to preserve the real environment of the user's terminal. If set tofalse, the command will be started as a process.reuseExistingTerminalWindow: Whether to reuse an existing terminal window to avoid creating multiple terminals.timeout: Timeout in milliseconds.maxLinesCount: Maximum number of lines to return.truncateMode: How to truncate the text: from the start, in the middle, at the end, or do not truncate at all.projectPath: The project path. Always provide this value if known to reduce ambiguous calls. If only the current working directory is known, you can use it as the project path.
Universal tools
- execute_tool
Universal tool executor that dynamically invokes a specific IDE MCP tool from a command-line string.
Parameters:
command(required): Command-line string with the tool name and arguments.projectPath: The project path. Always provide this value if known to reduce ambiguous calls. If only the current working directory is known, you can use it as the project path.
VCS tools
- get_repositories
Retrieves the list of VCS roots in the project. Use this tool to identify all repositories in a multi-repository project.
Parameters:
projectPath: The project path. Always provide this value if known to reduce ambiguous calls. If only the current working directory is known, you can use it as the project path.
- git_status
Retrieves the Git status for one or more repositories in the current project. Returns porcelain-style index and worktree status codes and summary counters. By default, all Git repositories are returned.
Parameters:
repositoryPathRelativeToProject: Optional path relative to the project root used to select a single containing repository.includeUntracked: Whether to include untracked files.includeIgnored: Whether to include ignored files.limit: Maximum number of entries returned per repository.projectPath: The project path. Always provide this value if known to reduce ambiguous calls. If only the current working directory is known, you can use it as the project path.