Attach to running Go processes with the debugger
In GoLand, you can attach the debugger to a running Go process on a local machine, on a remote machine, or in the Docker container.
Attach to a process on a local machine
You can debug an application that you launched from the command line. In this case, the application runs outside the IDE but on the same local machine. To debug the application, you need to open the project in the IDE and attach the debugger to the running process.
You can use the example Go application on GitHub to follow these steps.
Step 1. Install the gops package
Open the Terminal tool window () and run the following command:
go install github.com/google/gops@latestClick (Ctrl+Alt+F5). In the notification window, click the Invoke 'go get gops' link.
Step 2. Build and run the application
Open the Terminal tool window () and build the application with compiler optimizations and inlining disabled:
go build -gcflags="all=-N -l" -o myAppgo build -gcflags="all=-N -l" -o myApp.exeRun the compiled executable.
./myApp.\myApp.exe
Step 3. Attach to and debug the running process
Click the gutter next to the line of code where you want to set the breakpoint. In the provided example, place the breakpoint on the line 23 (
message := fmt.Sprintf("Hello %s!", r.UserAgent())). Read more about breakpoints in Breakpoints.Click or use the shortcut Ctrl+Alt+F5.
In the Attach with Debugger To window, select your application process and press Enter.
Trigger the event associated with the breakpoint in your application. If using the provided code example, open the http://localhost:8080/ link in a browser.
Attach to a process on a remote machine
You can connect to Delve on a remote computer to debug a Go process running there. The following example uses a Linux remote computer and an SSH tunnel.
To install Delve, you can use the following command:
Step 1. Build the application on the remote computer
In a terminal on the remote computer, open the application directory and run:
go build -gcflags="all=-N -l" -o myAppThis command compiles the myApp executable and disables compiler optimizations and inlining.
Step 2. Run Delve on the remote machine
You have two options to launch the debugger on the host machine:
Start the application with Delve. myApp is the executable built in Step 1.
dlv --listen=127.0.0.1:2345 --headless=true --api-version=2 exec ./myAppIf you need to pass arguments to the binary as-is, add the double dash sign (
--) to the previous command and then necessary options (for example,-- --config=/path/to/config/file).You run the process, and the debugger attaches to the running process.
<PID>is the process identifier of your application on the remote computer. Use a tool such aspson that computer to find it.dlv --listen=127.0.0.1:2345 --headless=true --api-version=2 attach <PID>
Forward the debugger port
In a terminal on your local computer, start an SSH tunnel:
ssh -N -L 2345:127.0.0.1:2345 user@remote-hostReplace
userandremote-hostwith your SSH username and the remote computer's address. Keep the SSH connection open while debugging.Connect GoLand to
127.0.0.1:2345as described below. The tunnel forwards this connection to Delve on the remote computer.
Step 3. Start the debugging process on your local computer
Open the code of your application and place a breakpoint. In the provided code example, set the breakpoint on line 23 (
message := fmt.Sprintf("Hello %s!", r.UserAgent())). Read more about breakpoints in Breakpoints.Click . Alternatively, click the list of run/debug configurations on the toolbar and select Edit Configurations.
In the Run/Debug Configurations dialog, click the Add button (
 ) and select Go Remote.
In the Host field, type
127.0.0.1to use the SSH tunnel.In the Port field, type the debugger port that you configured on Step 2 (for example,
2345).Click Debug.
Trigger the event at the breakpoint in your application. If you used the provided code example, open the
http://<host_address>:8080/link in a browser.The video below shows the debugger workflow, but predates the SSH tunnel setup. Use the listener address and tunnel from the steps above. In the video, the dark-themed IDE is on the local computer, and the light-themed IDE is on the remote computer.
Attach to a process in the Docker container
You can attach the debugger to a Go process that runs inside a Docker container. For more information about Docker, refer to Docker.
The following steps use Docker on your local computer. Publish the debugger port on 127.0.0.1 so other computers cannot connect to it.
For example purposes, you can use the following Dockerfile for this Go application.
Step 1. Create a Dockerfile configuration
Click . Alternatively, click the list of run/debug configurations on the toolbar and select Edit Configurations.
In the Run/Debug Configurations dialog, click the Add button (
) and select .In the Dockerfile field, click the Browse icon (
 ) and navigate to Dockerfile in the file browser. If you use the example from this section, navigate to this Dockerfile.
In the Container name field, type the container name (for example,
debugging-tutorial).In the Run/Debug Configurations dialog, click Modify and select Bind ports and Run options.
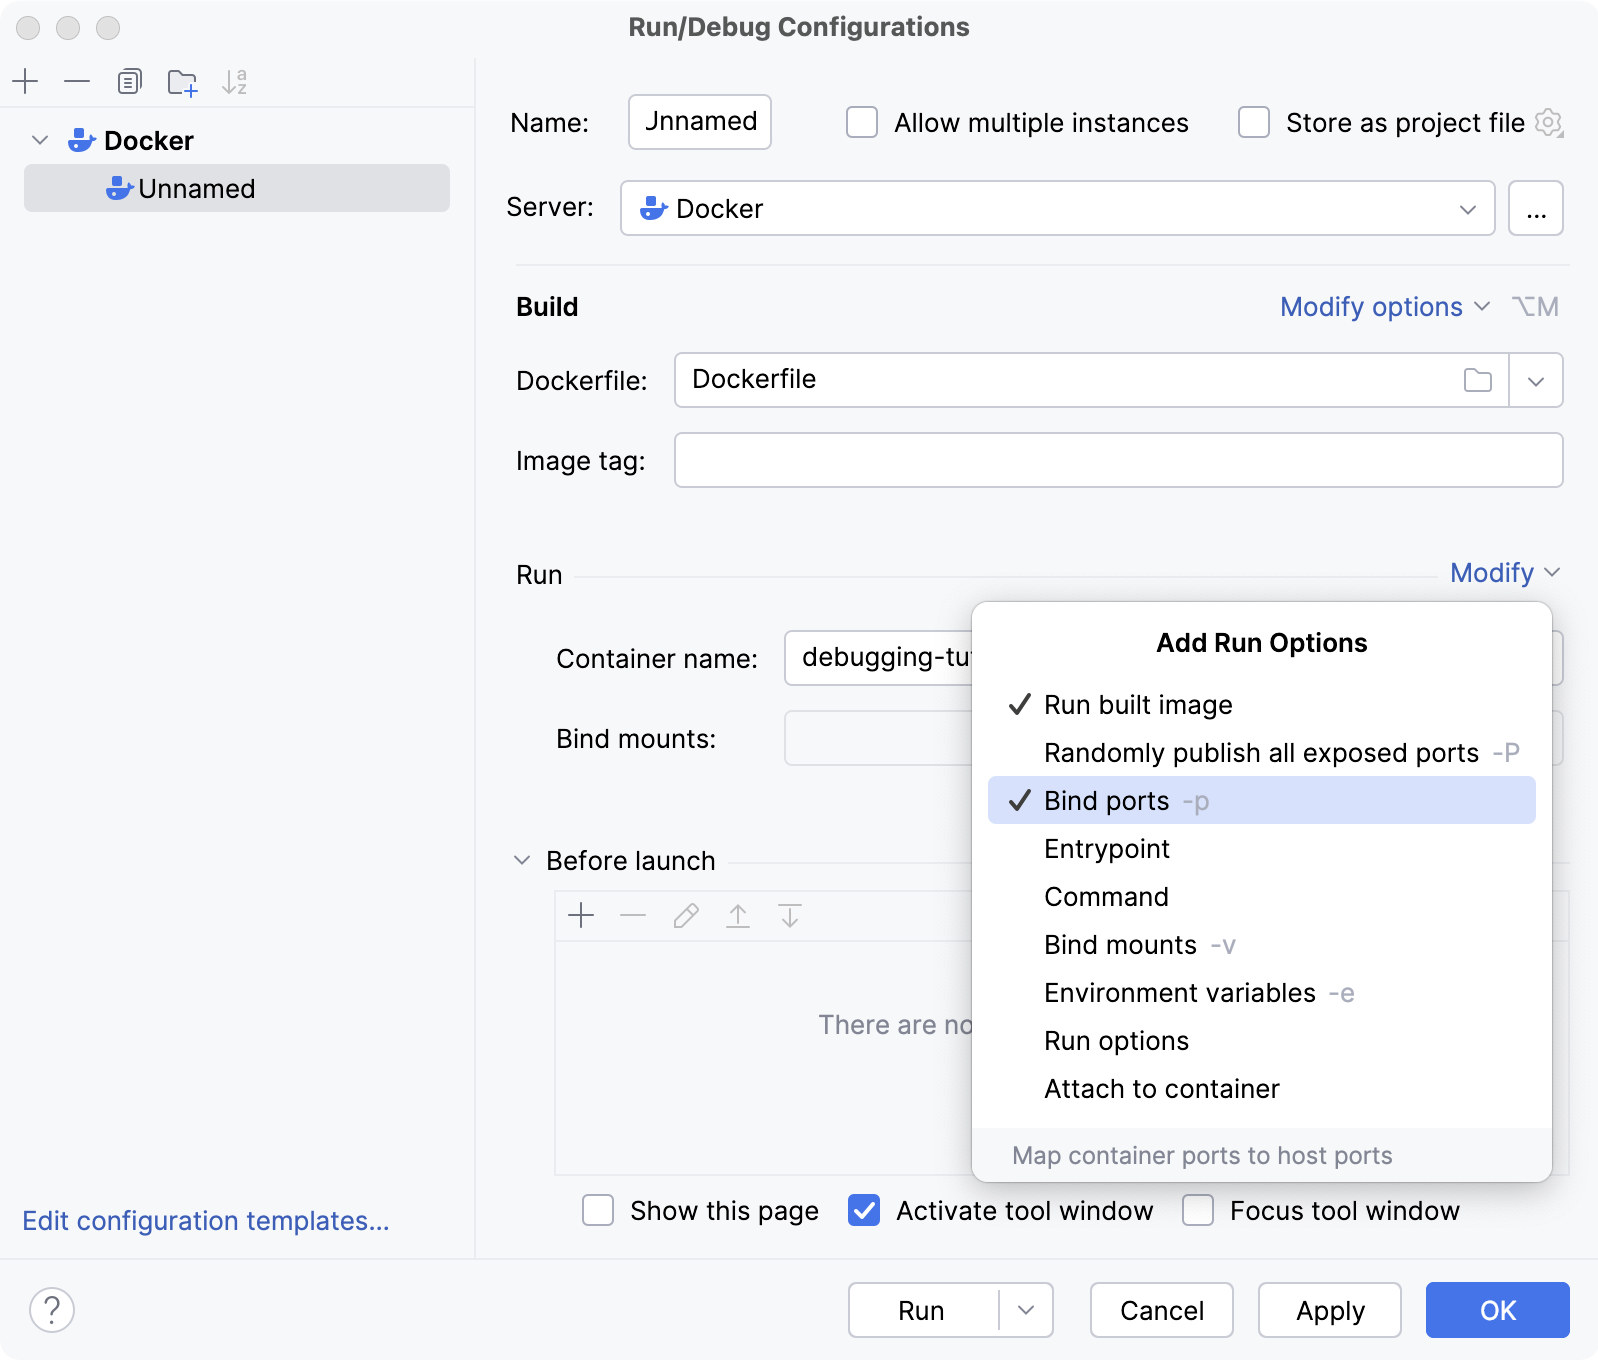
In the Bind ports field, click Browse (
).In the Port Bindings dialog, click the Add button (
). In the Host port column, type 8080. Click the Container port column, type8080. Additionally, create the same binding for the port40000. Set Host IP to127.0.0.1for each binding.In the Run options field, specify command-line options for Docker. For the example provided in the Dockerfile, disable the security profile and add the
SYS_PTRACELinux capability.--security-opt="apparmor=unconfined" --cap-add=SYS_PTRACEClick Run.
Step 2. Create the Go Remote run/debug configuration
Click . Alternatively, click the list of run/debug configurations on the toolbar and select Edit Configurations.
In the Run/Debug Configurations dialog, click the Add button (
) and select Go Remote.In the Host field, type the host IP address (for example,
localhost).In the Port field, type the debugger port that you configured. In this example, it is
40000.Click OK.
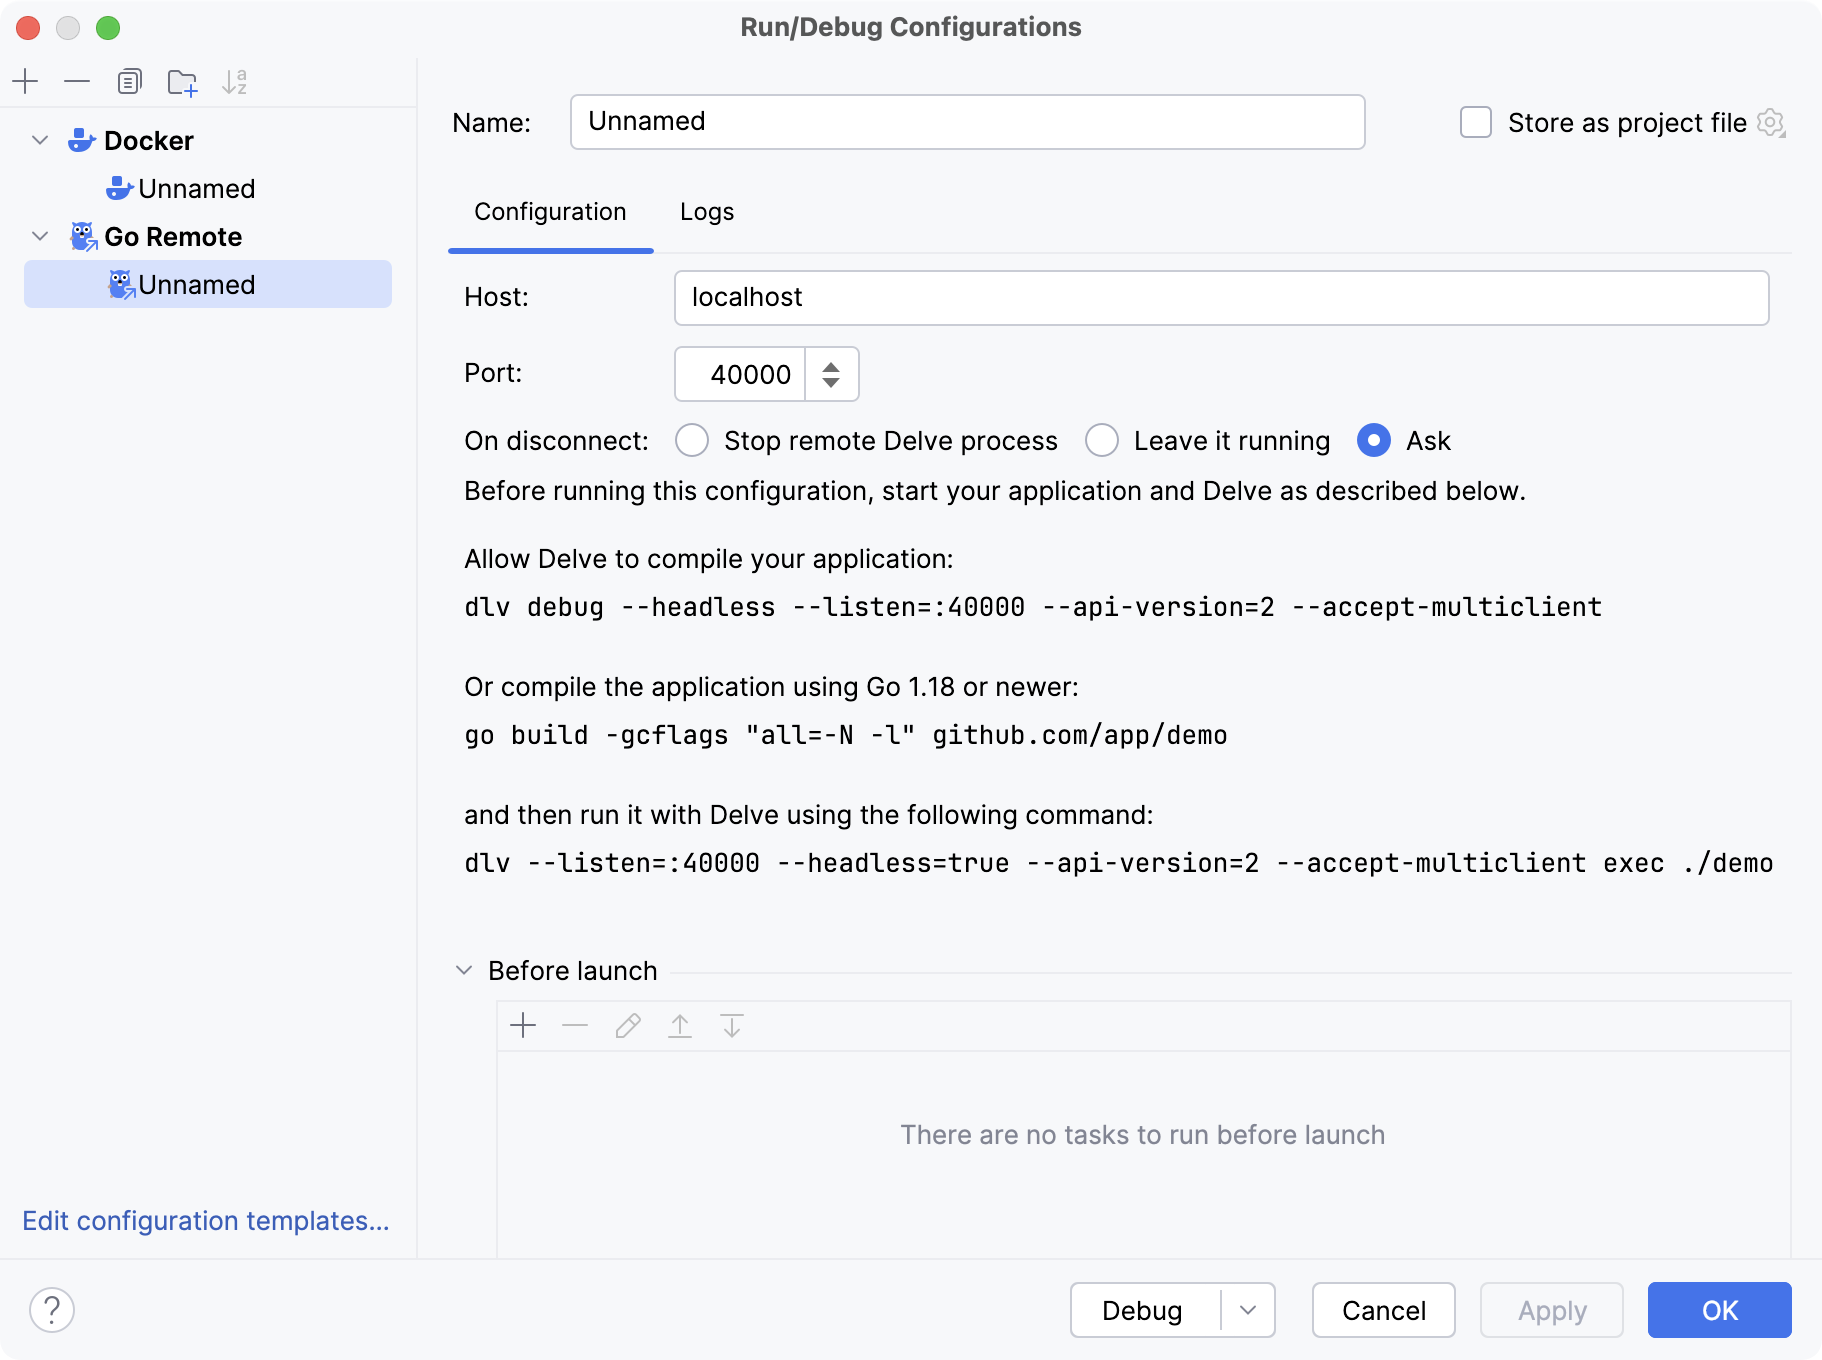
Step 3. Start the debugging process
In the Services tool window (), expand . Ensure that the created container is running and listens to the preconfigured debugger port.
Click the gutter near the line of code to place the breakpoint. For example, in the provided code example, put the breakpoint on the line 23 (
message := fmt.Sprintf("Hello %s!", r.UserAgent())).Read more about breakpoints in Breakpoints.
From the list of run/debug configurations on the toolbar, select the created Go Remote configuration and click the Debug <configuration_name> button (
 ). Alternatively, press Alt+Shift+F9 to select the created Go Remote configuration.
Trigger the event at the breakpoint in your application. If you used the provided code example, open http://localhost:8080/ in a browser.
The following video demonstrates how to run a container and connect the debugger. It predates the loopback port bindings in the steps above. Use those bindings to keep the debugger port private.
Productivity tips
Disconnect from the remote debugger
The On disconnect setting in Go Remote determines how GoLand disconnects:
Stop remote Delve process: stops Delve without asking whether to keep it running.
Leave it running: keeps Delve running. If the application is still running, GoLand clears its breakpoints and resumes execution before closing the connection.
Ask (default): if Delve was started with
--accept-multiclient, the Stop Remote Delve dialog asks whether to stop it. Otherwise, GoLand stops Delve without this dialog.
Press Ctrl+F2 to end the debugging session.
If the Stop Remote Delve dialog opens, choose whether to stop Delve. To save your choice in the run configuration, select the checkbox that disables future prompts.
If you stop Delve while it is attached to an existing remote process that is still running, the Kill Remote Process dialog asks whether to terminate that process. Choose whether to stop the application or leave it running.
To reconnect to the same Delve server, start it with --accept-multiclient. Before disconnecting, set On disconnect to Leave it running in the run configuration, or decline to stop Delve when prompted.