Datalore Cloud status page
At Datalore, we believe in keeping you informed. On the Datalore Status page, you can track the availability of our cloud services and view past and current incidents.
View the current service status
The Current status is the default view when you open the Status page. You can find two types of information there:
Status of Datalore Cloud’s key components – Website, Storage, and Notebooks
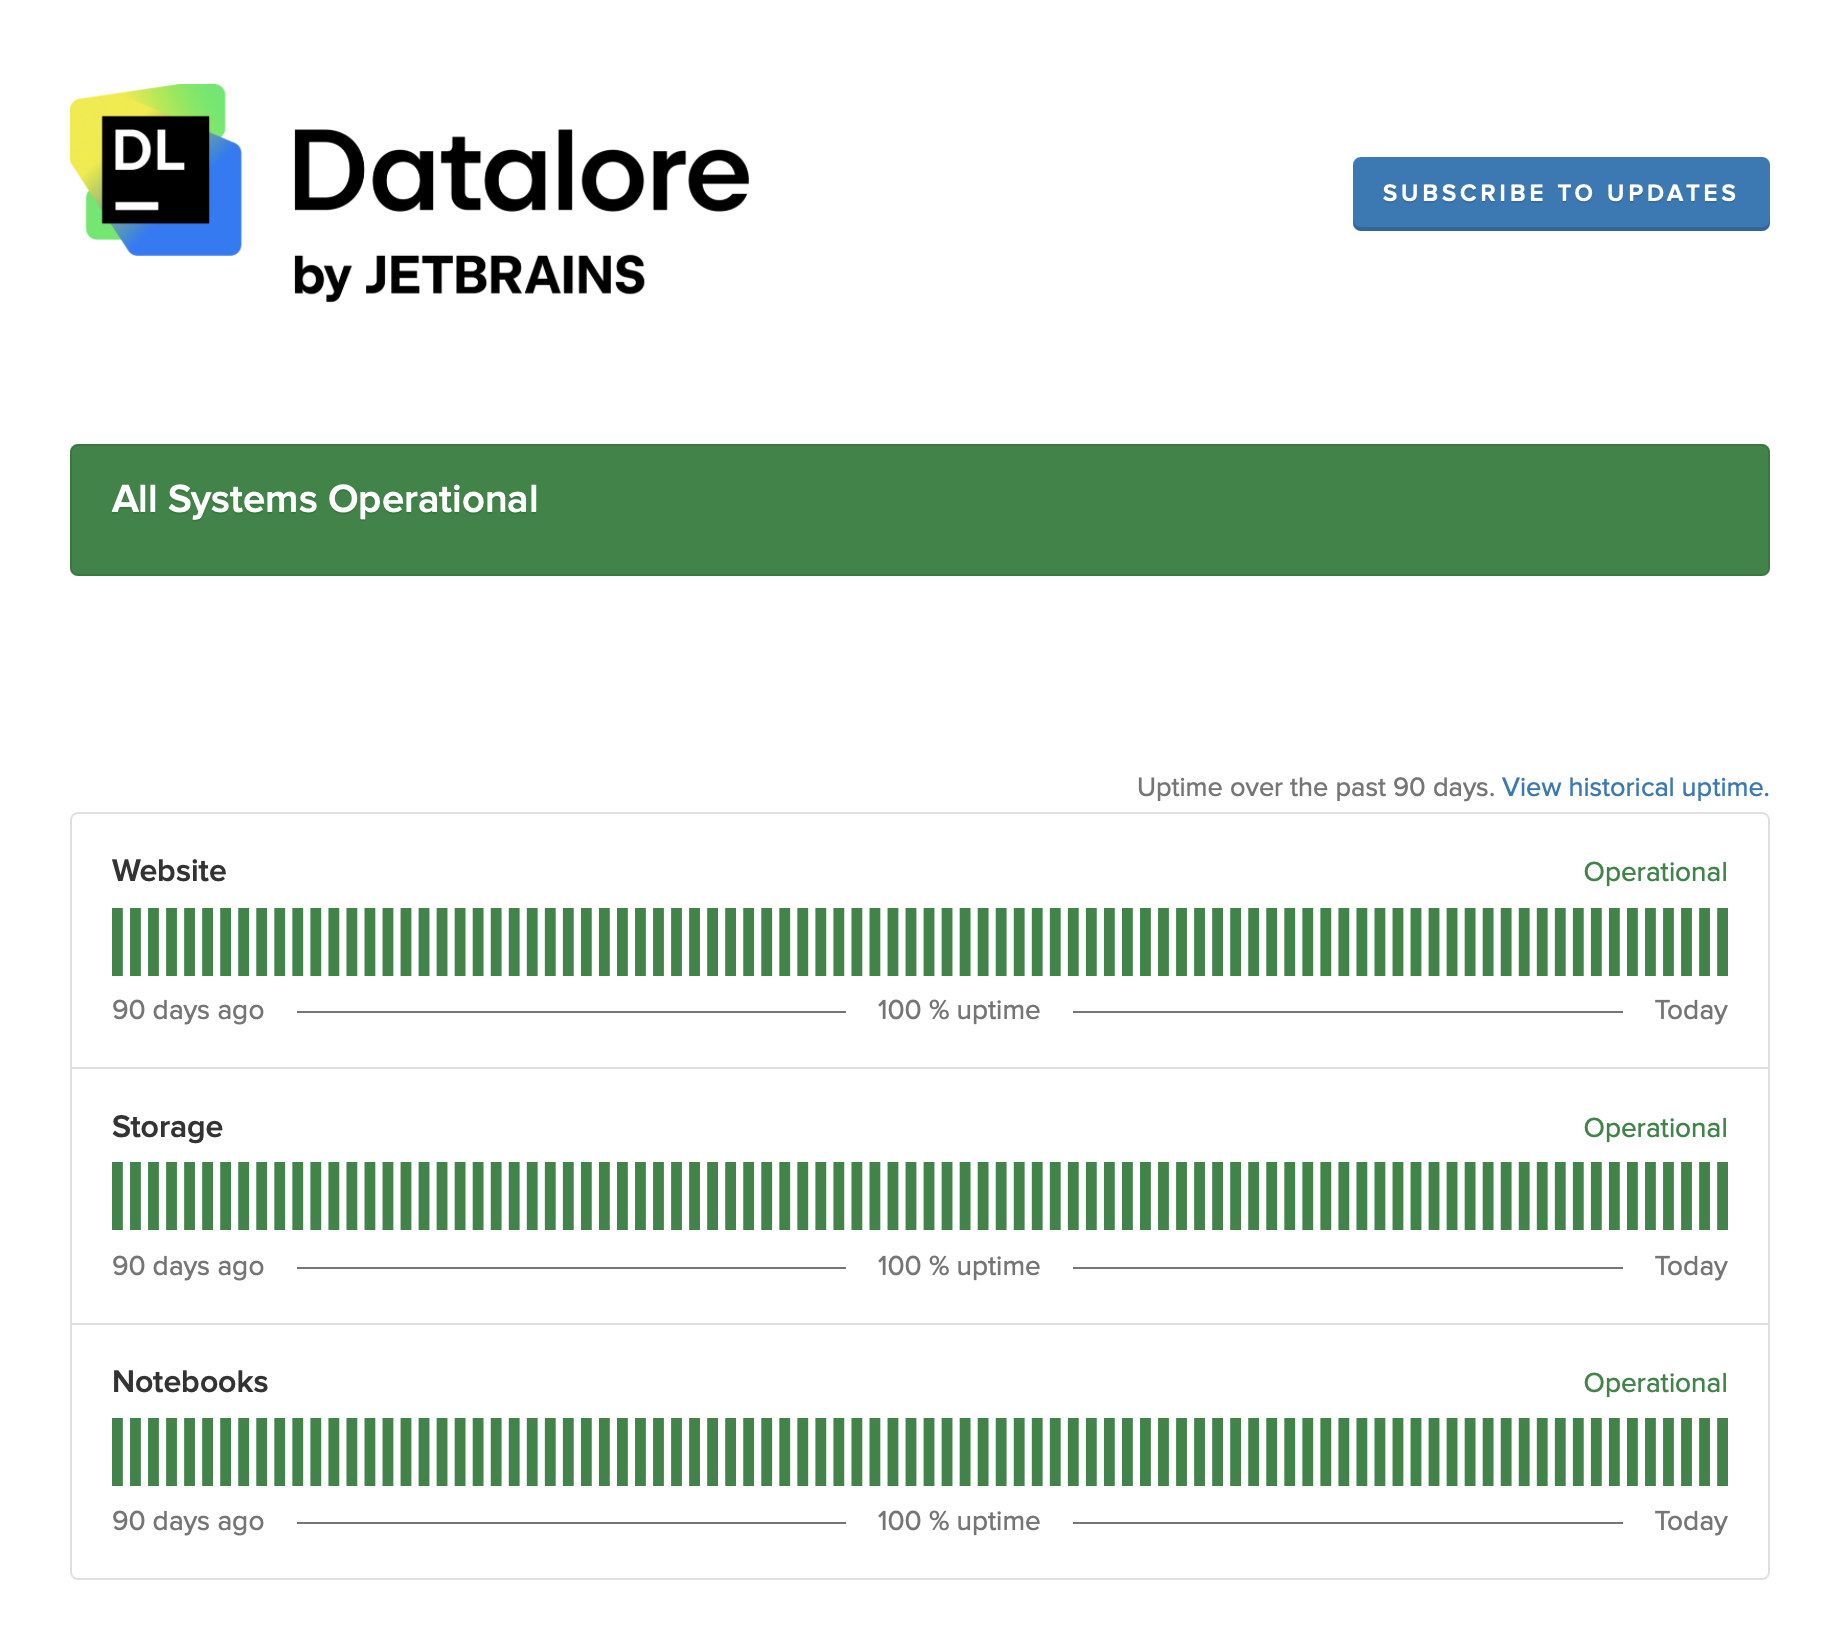
Incidents over the past 90 days.
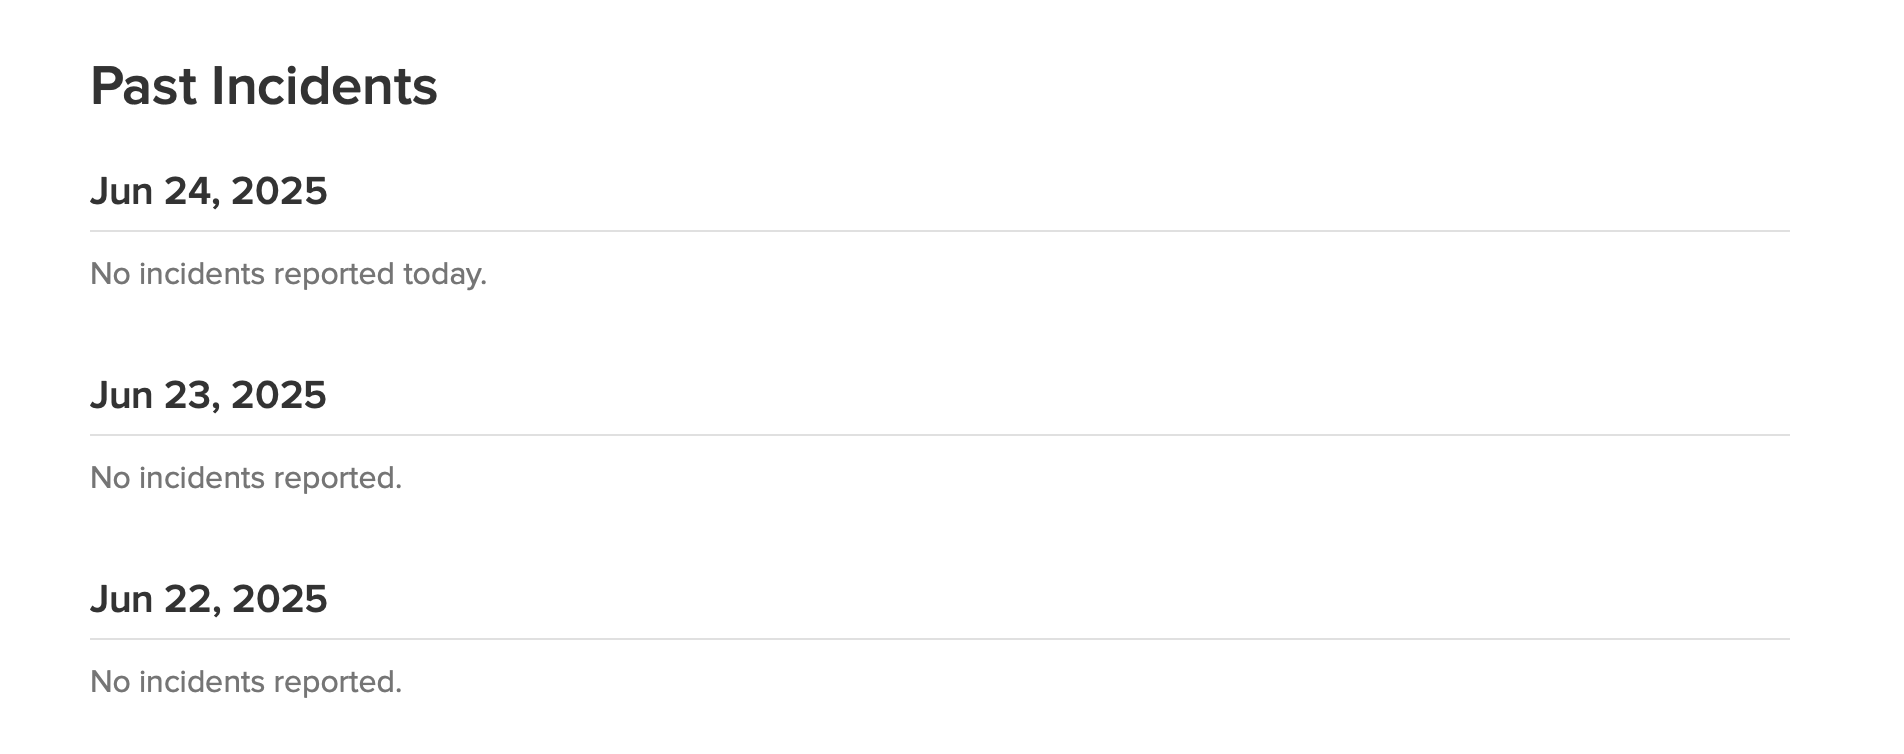
View the historical uptime
On the Status page, click View historical uptime.
By default, the website’s uptime over the past three months is displayed.
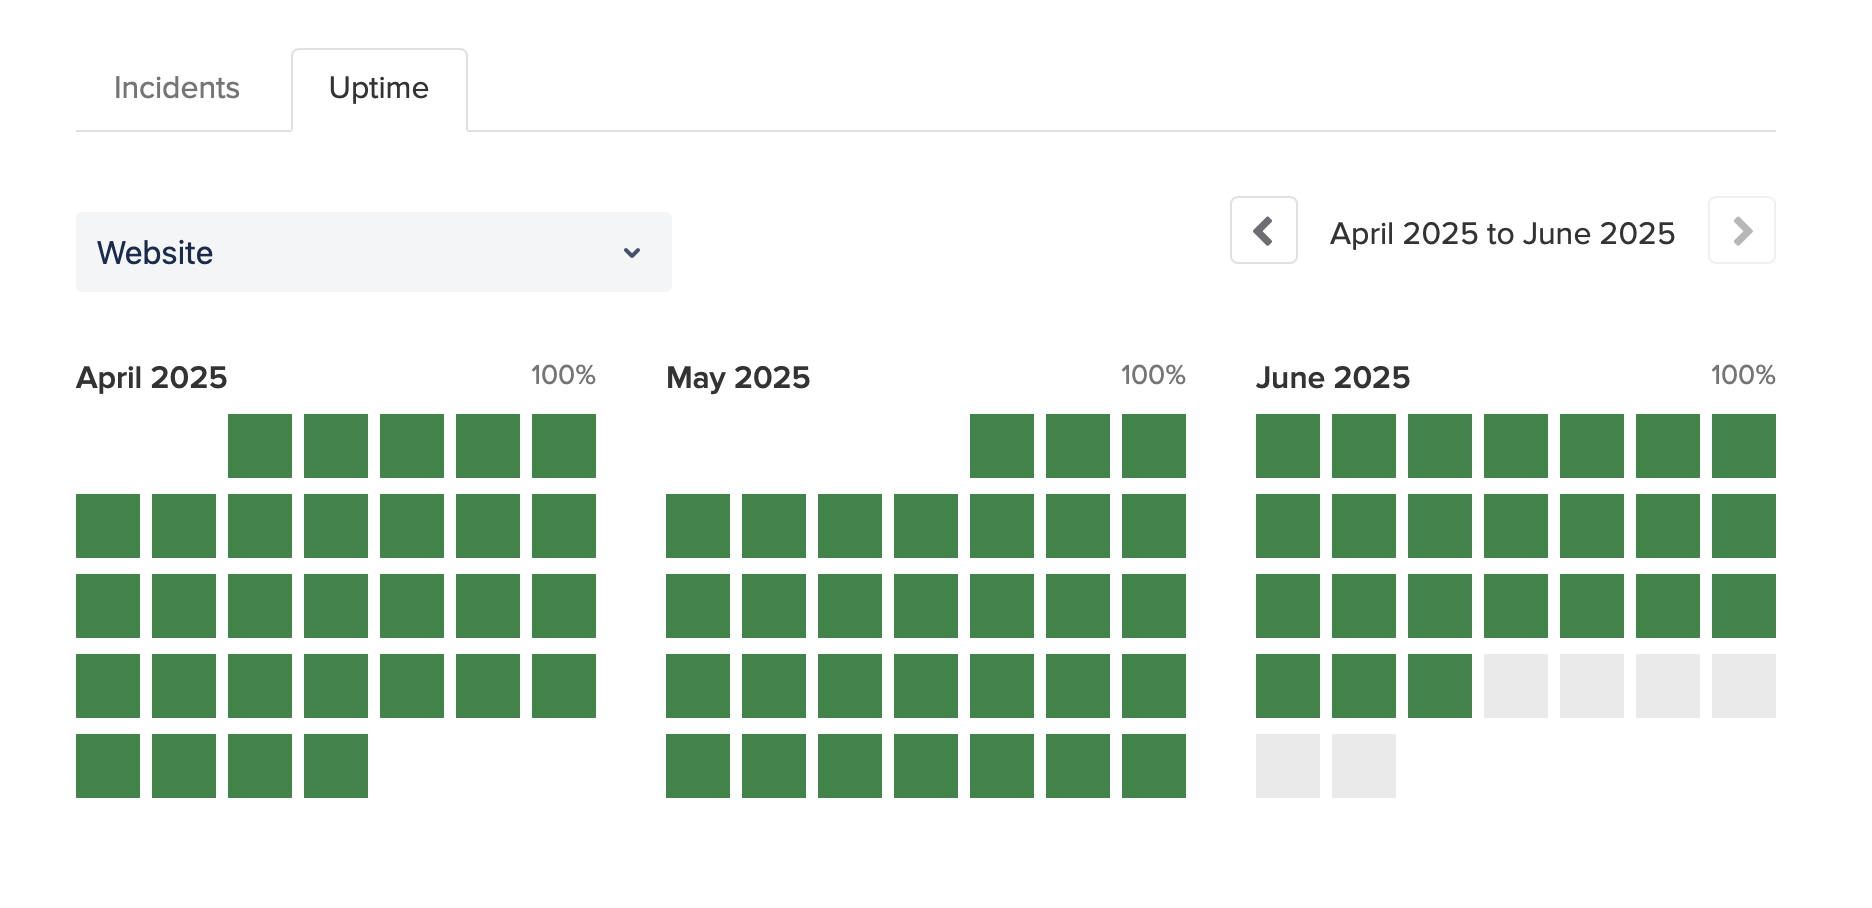
(Optional) To change the time period shown, click the arrows next to it.

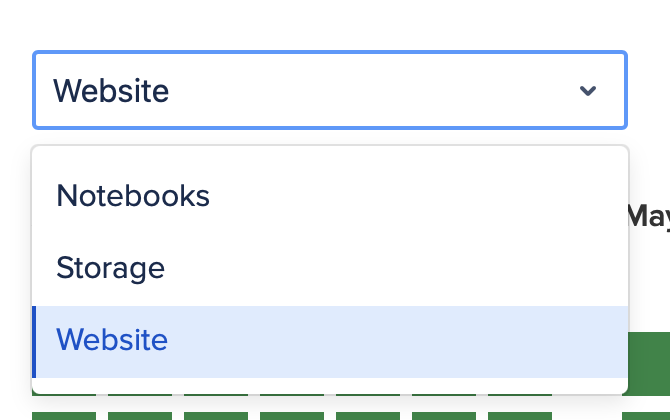
(Optional) To view uptime for a different component, select it from the dropdown.
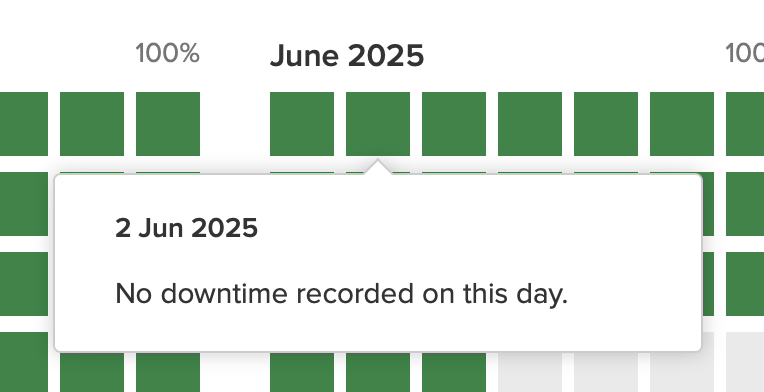
(Optional) To view the details for a specific day, hover over it in the chart.
View incidents
To view incidents over a specific time period:
On the Status page, click View historical uptime.
Switch to the Incidents tab.
By default, incidents over the past three months are displayed.
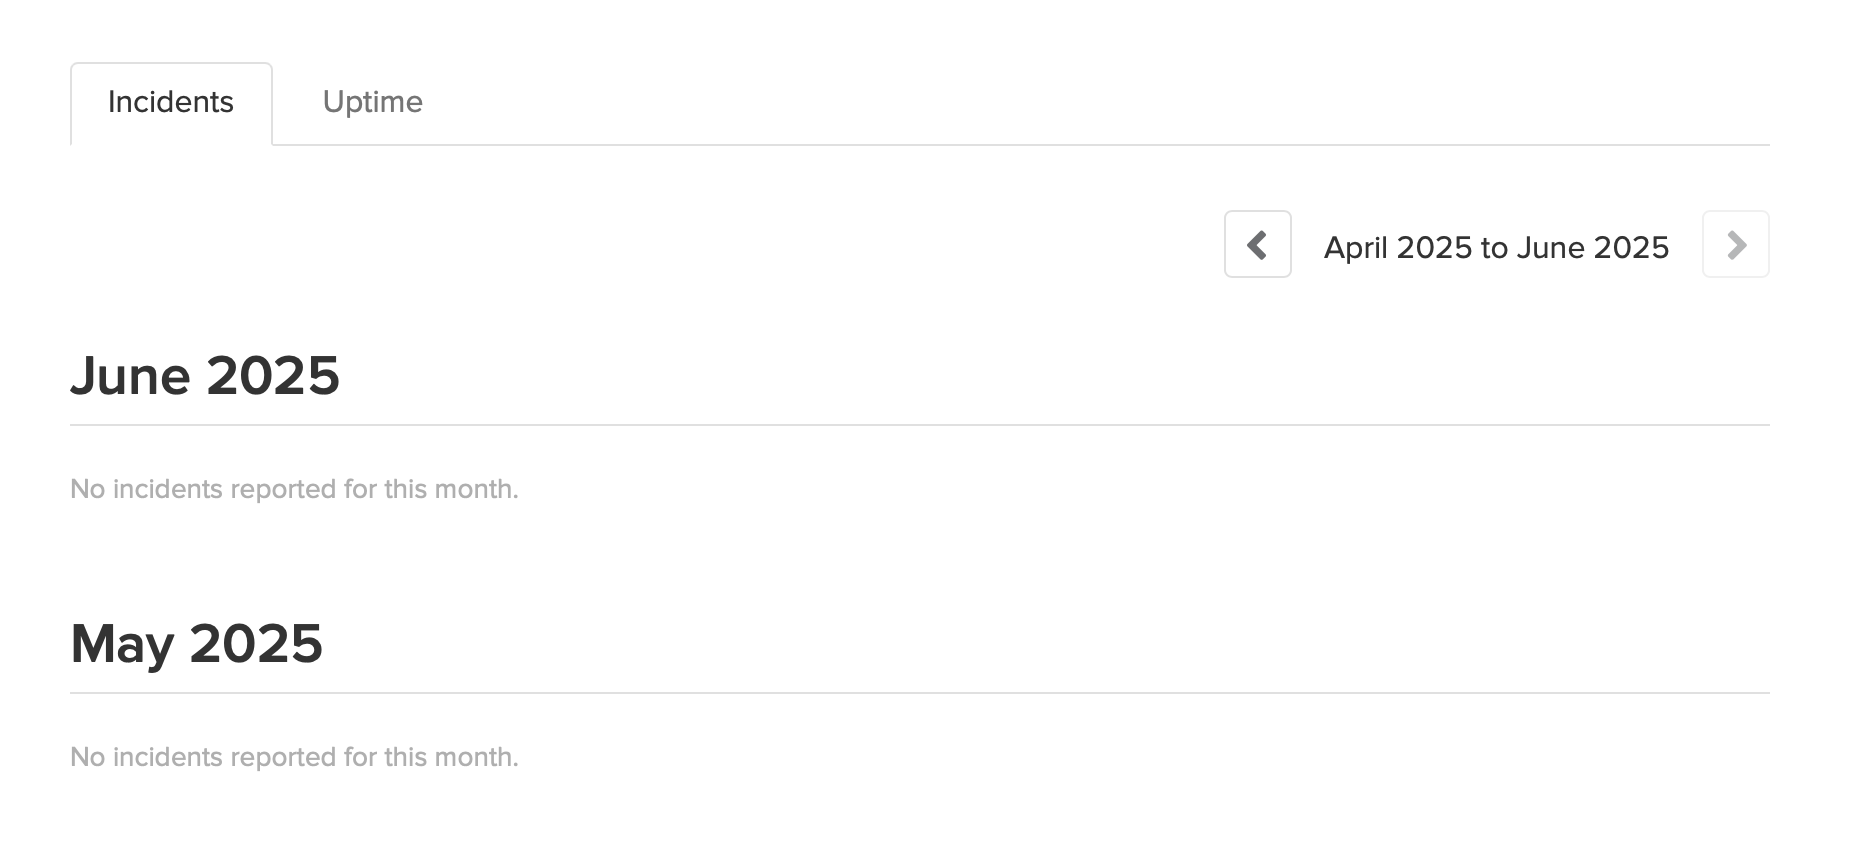
(Optional) To change the time period shown, click the arrows next to it.

Subscribe to status page updates
To get notifications for each incident recorded, updated, or resolved by Datalore, take the following steps:
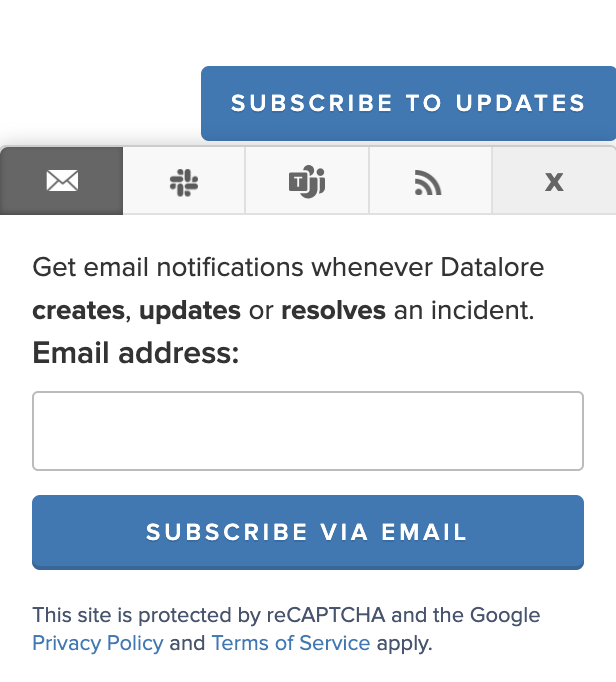
At the top right of the Status page, click Subscribe to updates.
In the dialog, select how you want to be notified.
To get email notifications:
On the Email tab, enter your email address.
Click Subscribe via email.
To get Slack notification:
Switch to the Slack tab.
Click Subscribe via Slack and follow the prompts.
To get notifications in a Microsoft Teams channel:
Switch to the Microsoft Teams tab.
In Channel’s webhook URL, enter the URL you Generated in Microsoft Teams.
Click Subscribe via Teams.
To subscribe to the RSS or Atom feed:
Switch to the Feed tab.
Click Atom feed or RSS feed.
The feed will open your Atom or RSS reader.