What's New in Rider 2025.2
Rider 2025.2 brings Junie, JetBrains' AI coding agent, right into your IDE. You can delegate complex, multistep tasks with a prompt, and Junie will handle the rest while keeping you in control. Game developers will find plenty to love in this release, with source-level debugging for Unity shaders, support for mixed-mode debugging, and a range of improvements for Unreal Engine and Godot. And with the new OpenTelemetry plugin, you get runtime observability data like logs and metrics directly inside your IDE.
Key updates
Junie comes to Rider
Beta
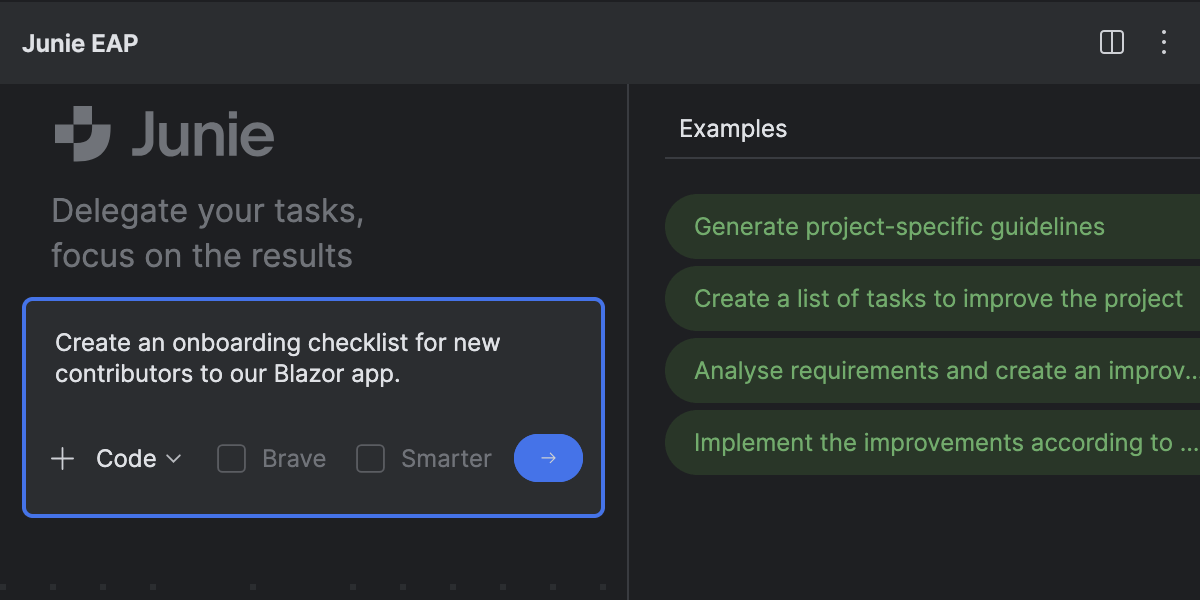
Explore a new way to code with Junie, an AI coding agent designed to reduce your workload and increase your end-to-end productivity.
We’re building our coding agent with a focus on real-life developer tasks to ensure easier adoption and help you get results you can trust. Junie can execute simple tasks, but it shines when assigned more complex ones. Use Code mode for delegating coding tasks or Ask mode for brainstorming features or new solutions.
Skip to the AI section of this page to read about the latest additions to Junie’s feature set.
Reworked Monitoring tool window
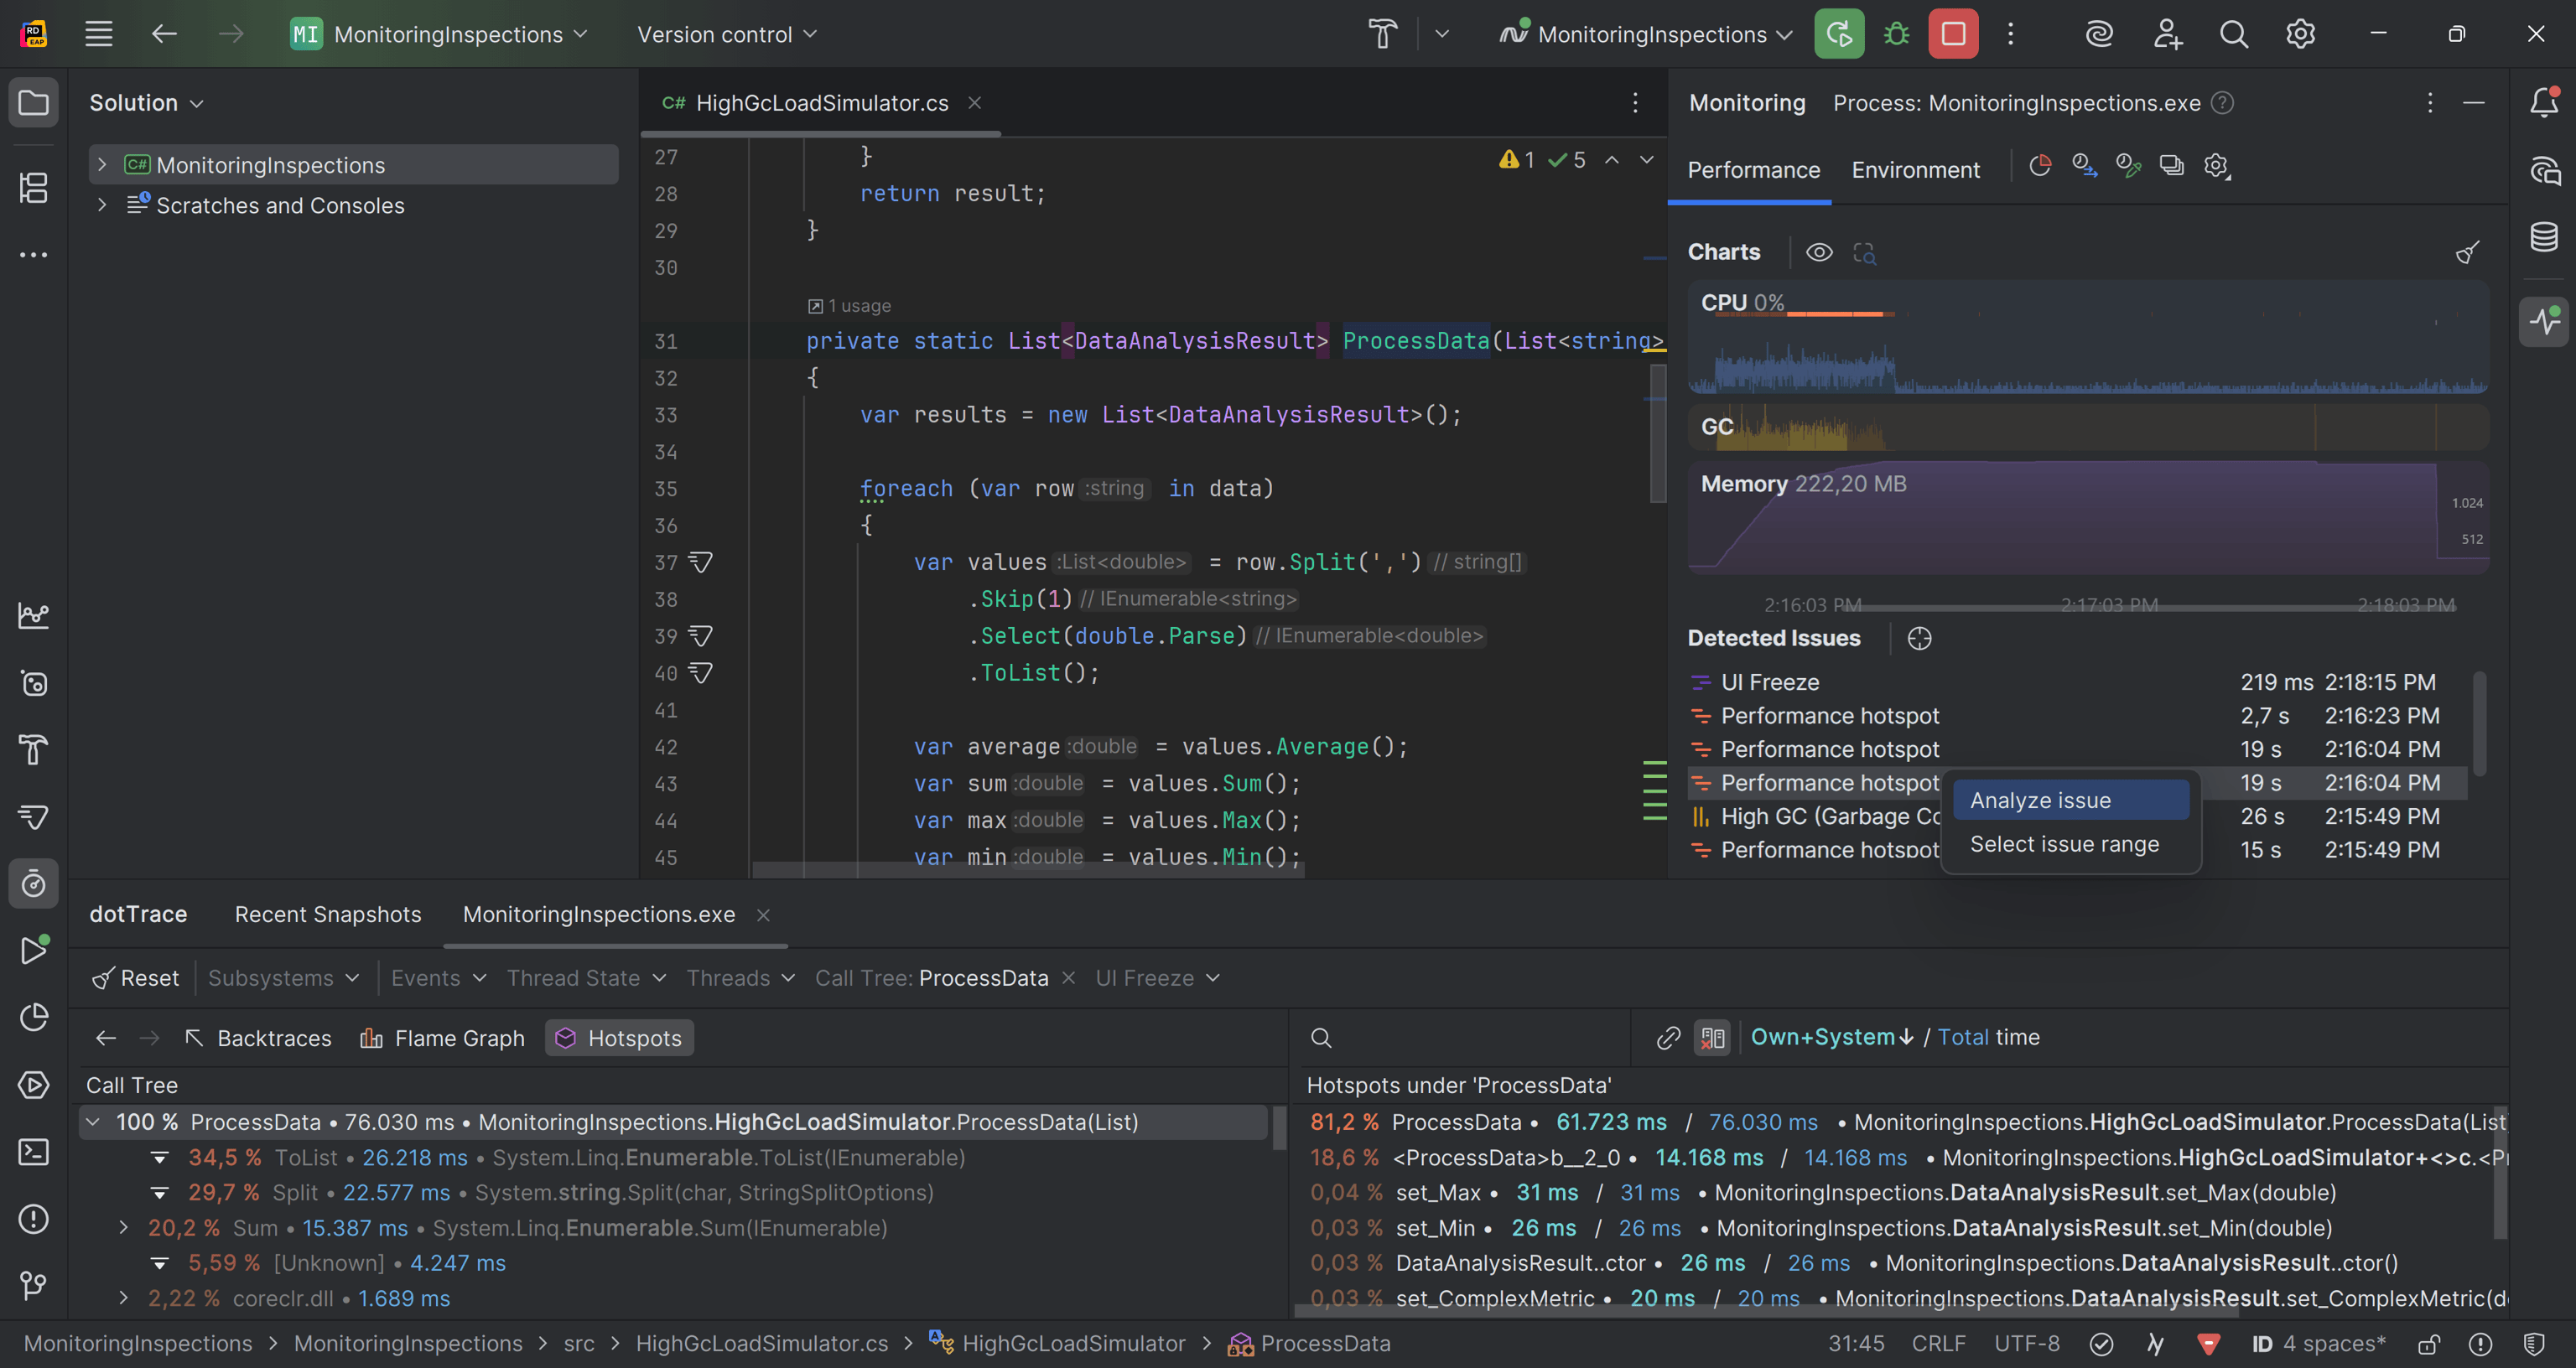
Our reimagined Monitoring tool window makes performance optimization for .NET applications a breeze. It now features interactive charts for CPU usage, memory consumption, and garbage collection activity, and lets you start performance or memory profiling sessions for deeper analysis. On Windows, it can also detect performance bottlenecks automatically! Clicking a finding or selecting a time interval on a chart opens call stack data in the bundled dotTrace profiler and takes you straight to the responsible method in the editor.
OpenTelemetry plugin for Rider
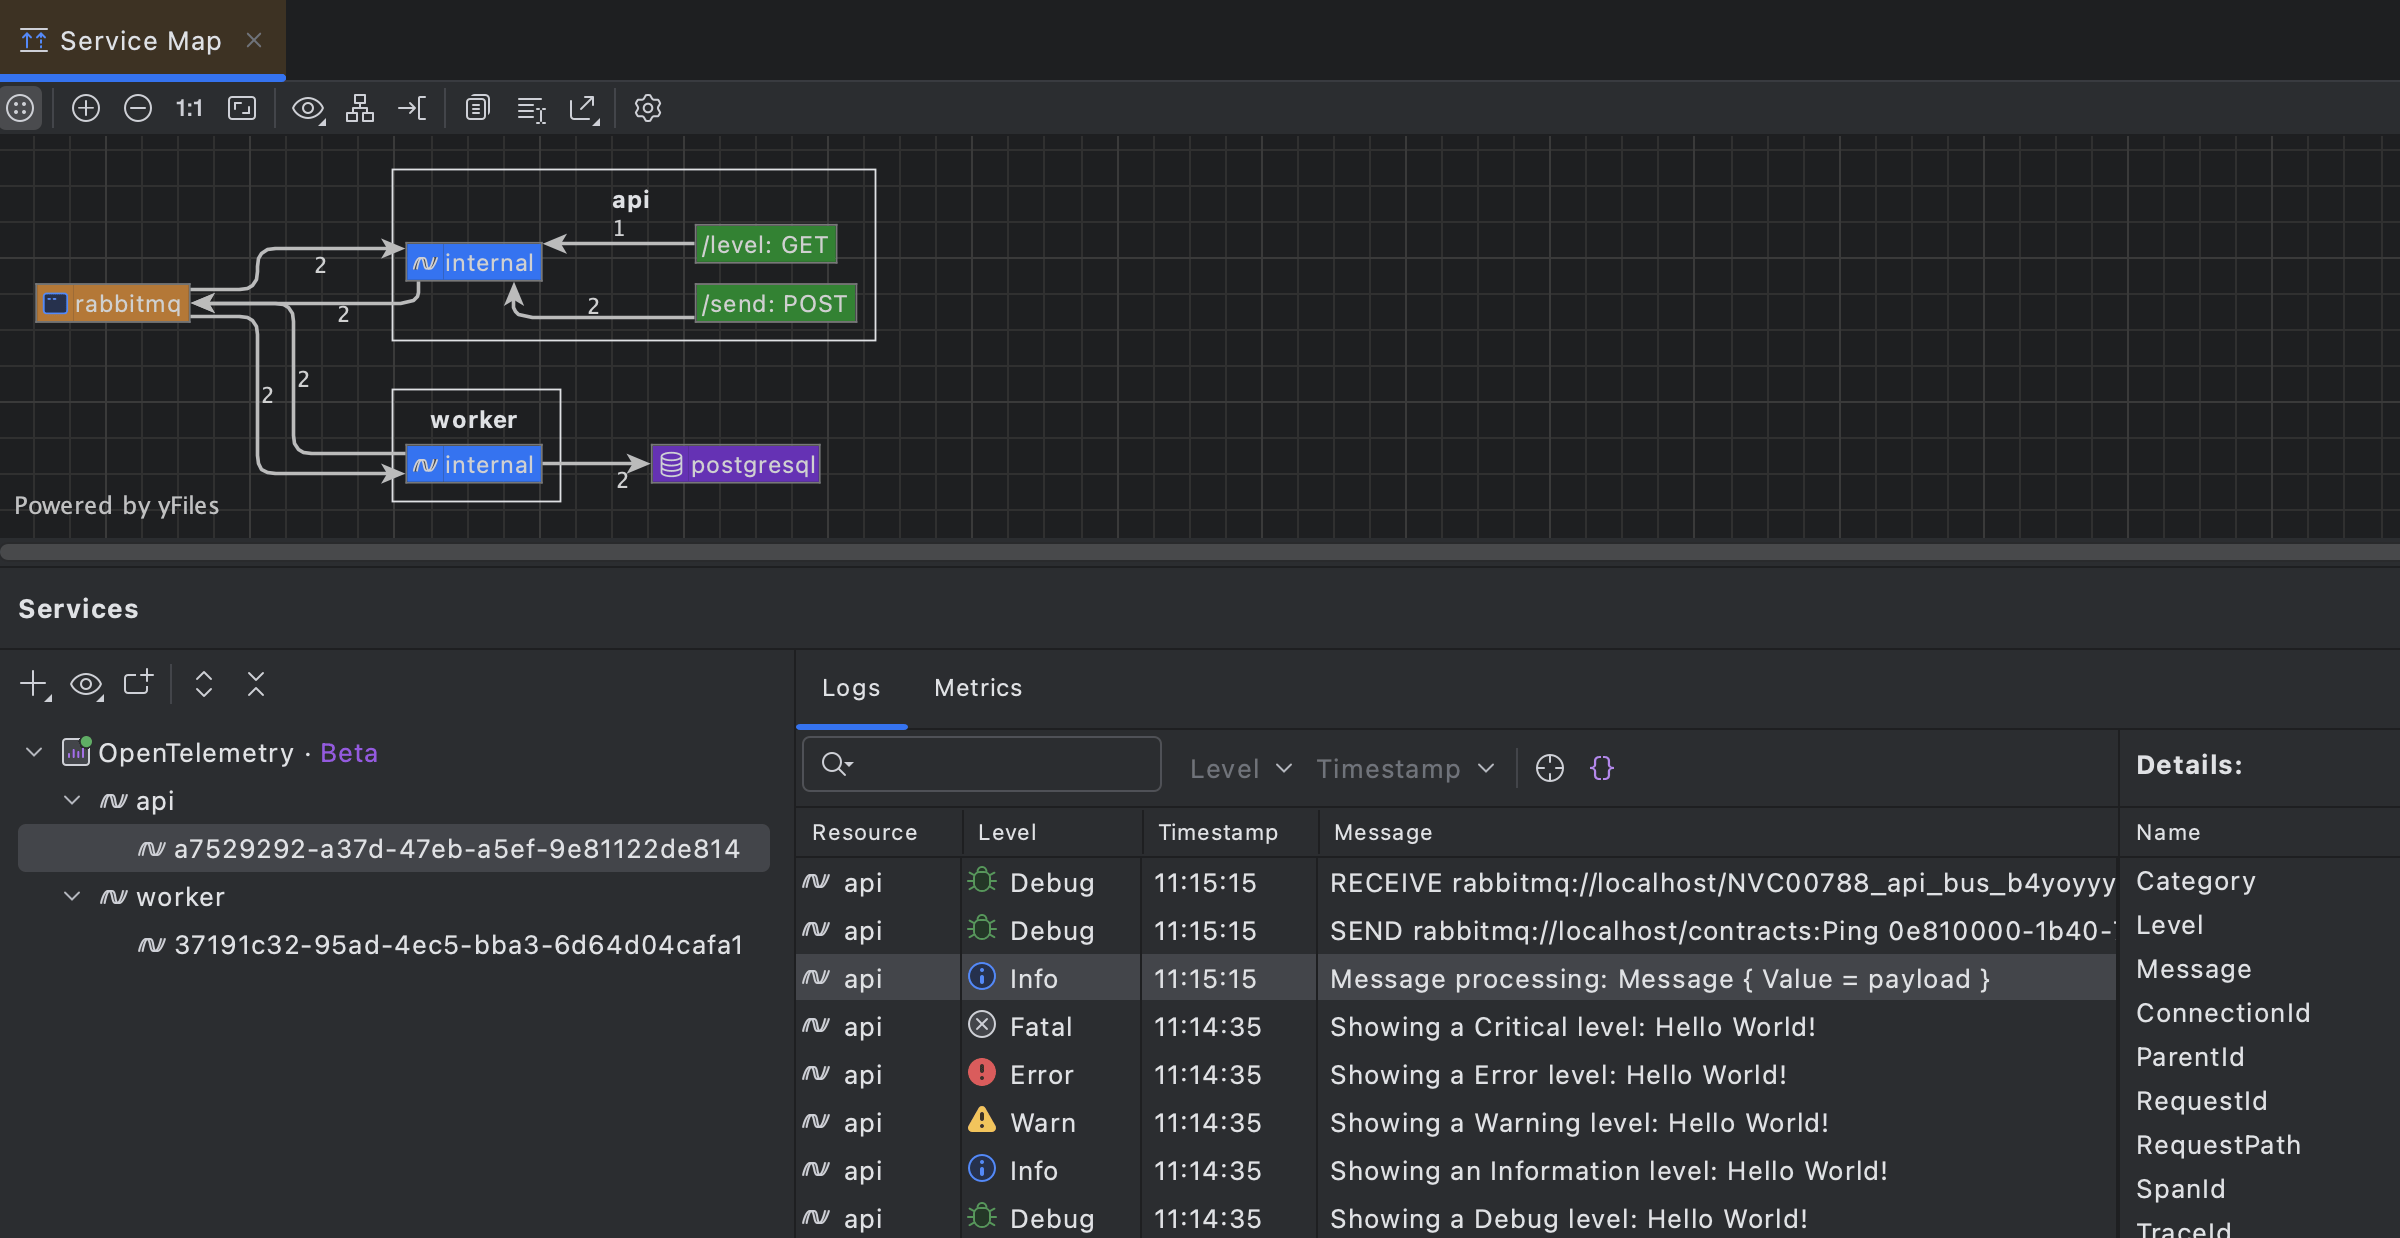
Get runtime observability without leaving your IDE thanks to the new OpenTelemetry plugin! The plugin brings logs and metrics directly into Rider. Navigate from any log entry straight to the responsible code, visualize performance metrics, and see auto-generated architecture diagrams based on your application's flow. This allows you to understand system behavior during development and testing, with no external dashboards required.
Connect external AI clients to Rider with one-click MCP server setup
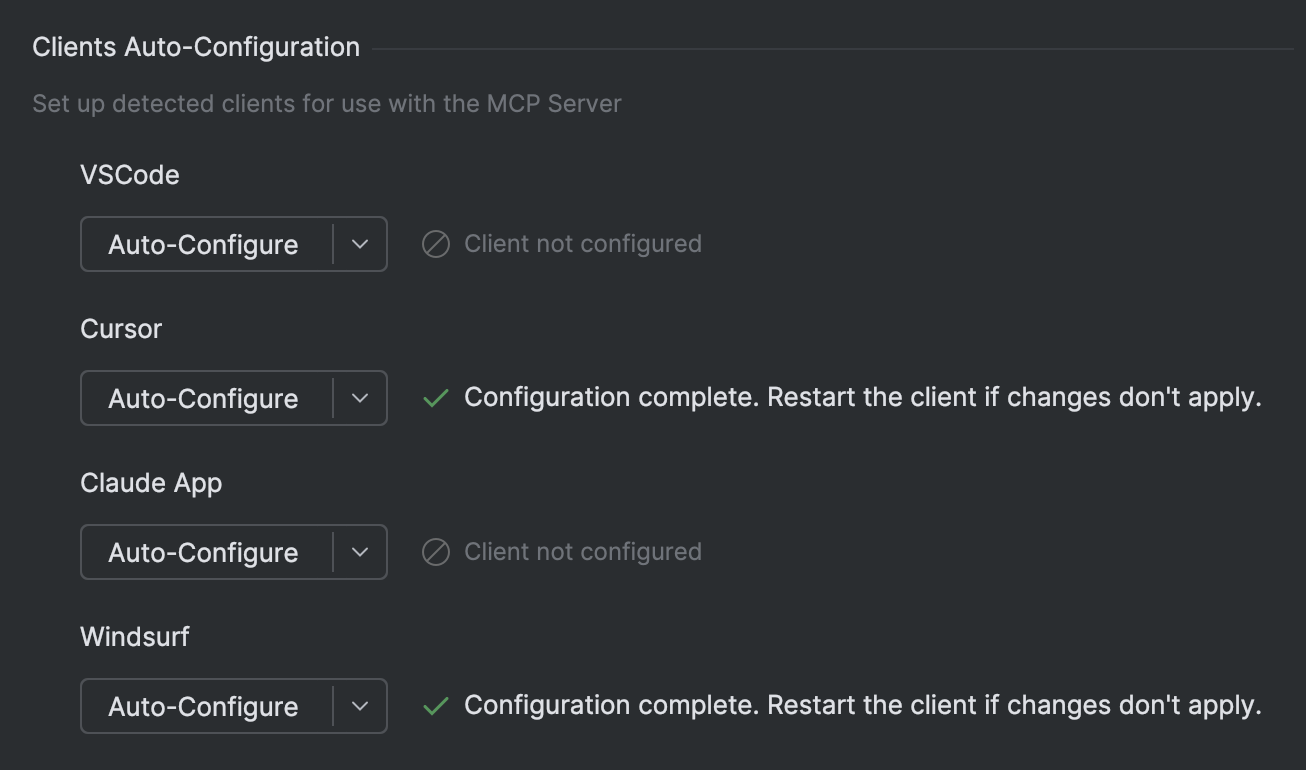
JetBrains IDEs now support one-click setup for the MCP (Model Context Protocol) Server, making it easy to connect to third-party AI agents. When a compatible client is detected on your machine, your IDE will prompt you to enable the server and auto-configure the connection – no manual setup required.
With this integration, JetBrains IDE capabilities become an intelligent extension to your preferred AI clients, letting you trigger actions like running unit tests, refactoring code, and generating files.
Performance
Improved garbage collection and memory consumption
For Rider 2025.2, we’ve experimented with the ConserveMemory setting responsible for garbage collection in Rider. As a result, peak managed memory consumption has gone down by up to 20% – an improvement that will be particularly noticeable when working with large codebases.
Faster stepping when debugging complex projects
We've improved how Rider handles debugger stepping when local variables or user-defined watches are expensive to evaluate. Previously, costly watches, such as tracking large Unity objects or complex LINQ expressions, could make stepping through code feel sluggish as Rider performed the necessary calculations. Rider now cancels unnecessary evaluations more efficiently, delivering snappy and responsive stepping even in projects with heavy watches.
Code analysis
C# support
Rider 2025.2 brings initial support for the latest additions in C# 14, as well as a range of other improvements to code analysis. Here are some highlights:
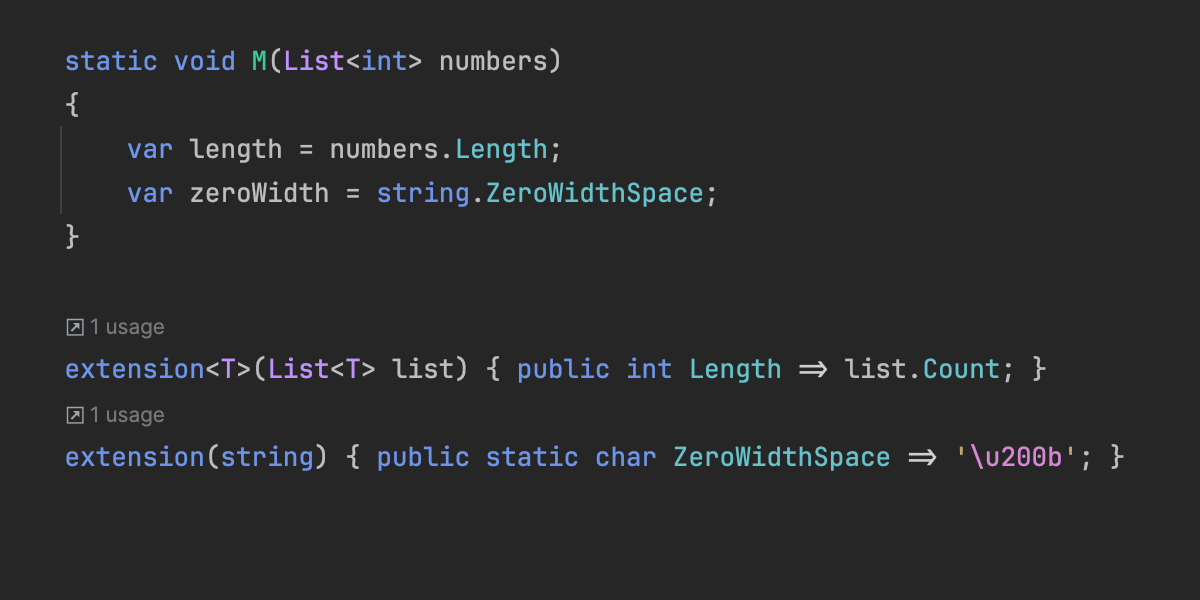
Extensions Initial support
Rider previews support for new C# 14 extension members by providing code completion, code analysis, Find Usages, the Rename refactoring, and more.
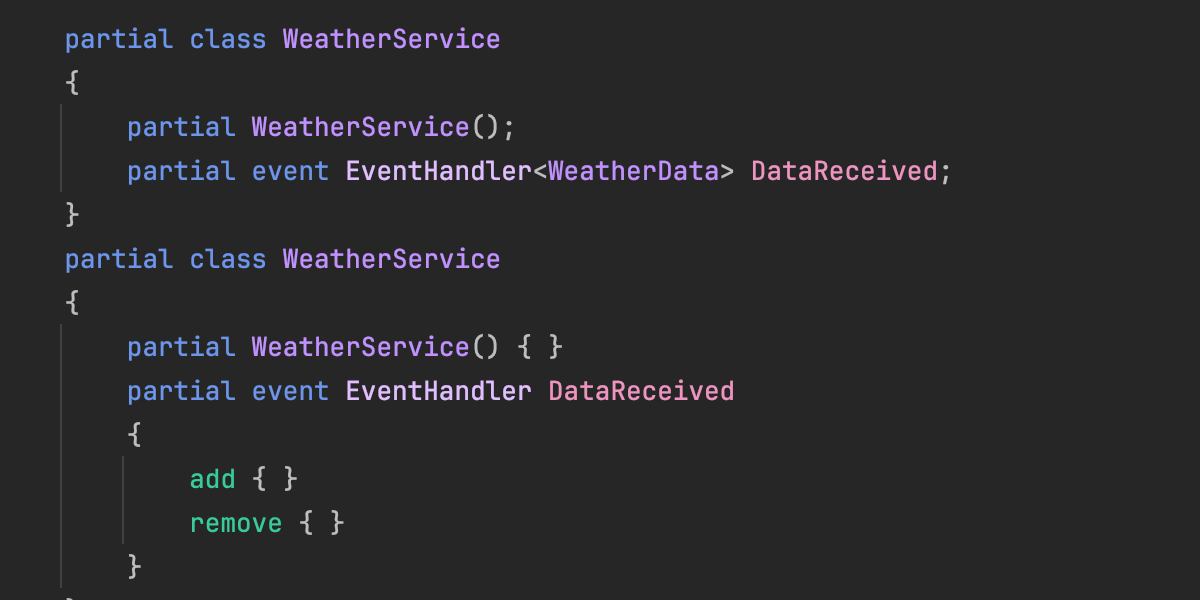
Partial events and constructors
C# 14 continues to extend possibilities of source generation with partial events and constructors. Rider is updated to cover these new use cases.
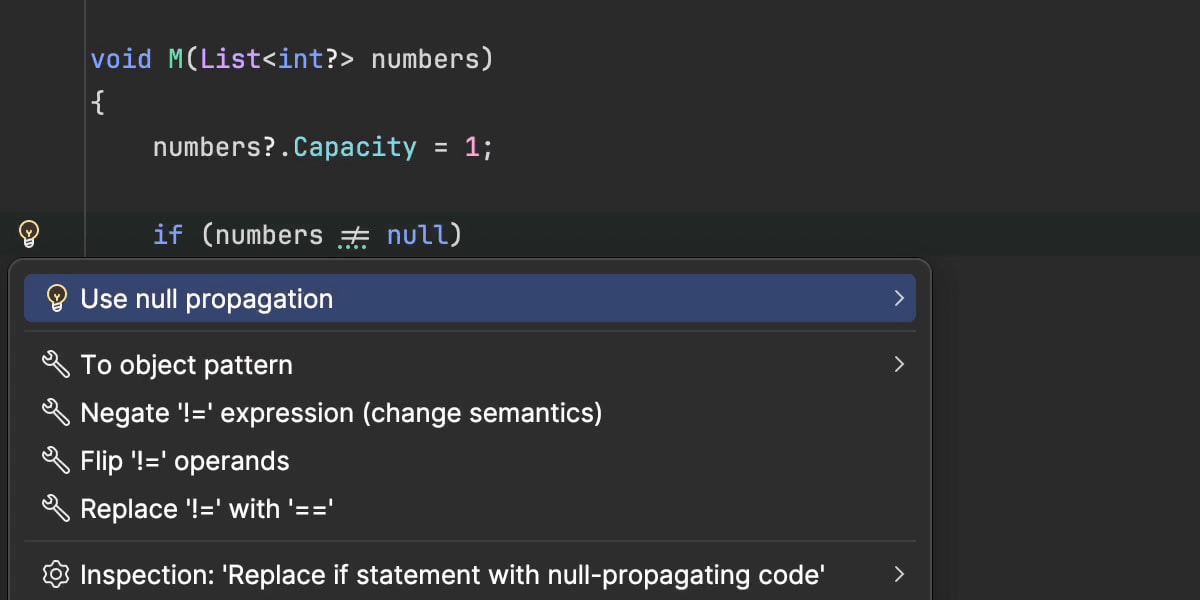
Null-conditional assignments
Rider 2025.2 lets you use the new a?.b = c and a?[i] = c patterns to simplify your code while safely handling potential null values.
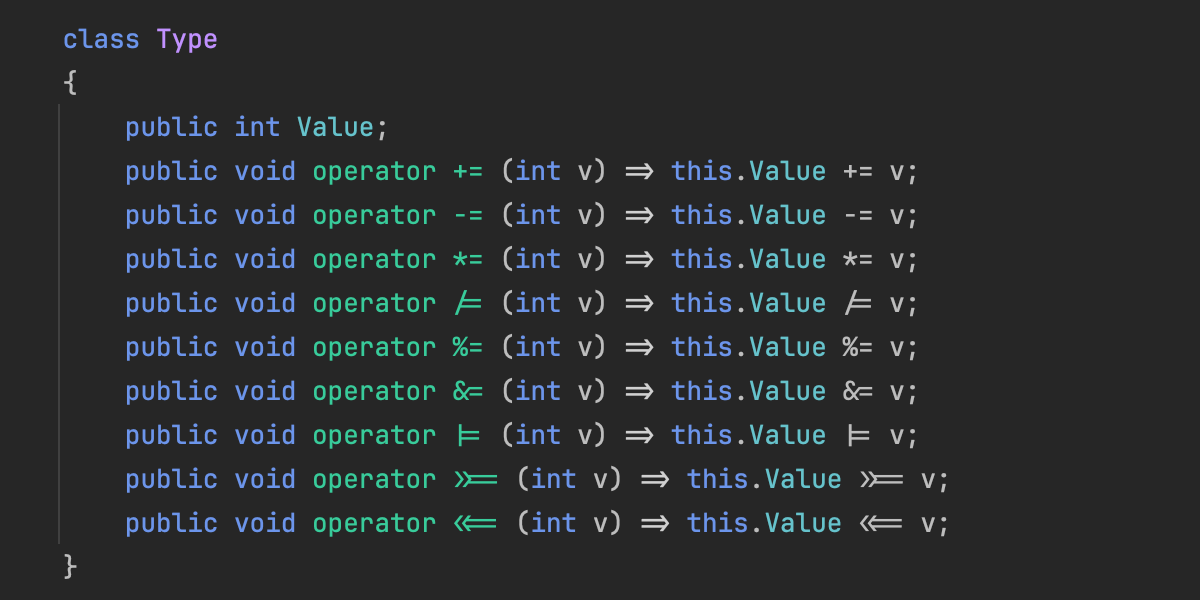
User-defined compound assignment operators
Rider now correctly understands and processes user-defined compound assignment operators introduced in C# 14.
Ignored preprocessor directives
Rider now recognizes the new #! and #: preprocessor directives.
For a full list of C# and code analysis updates, go to the What’s New in ReSharper 2025.2 page.
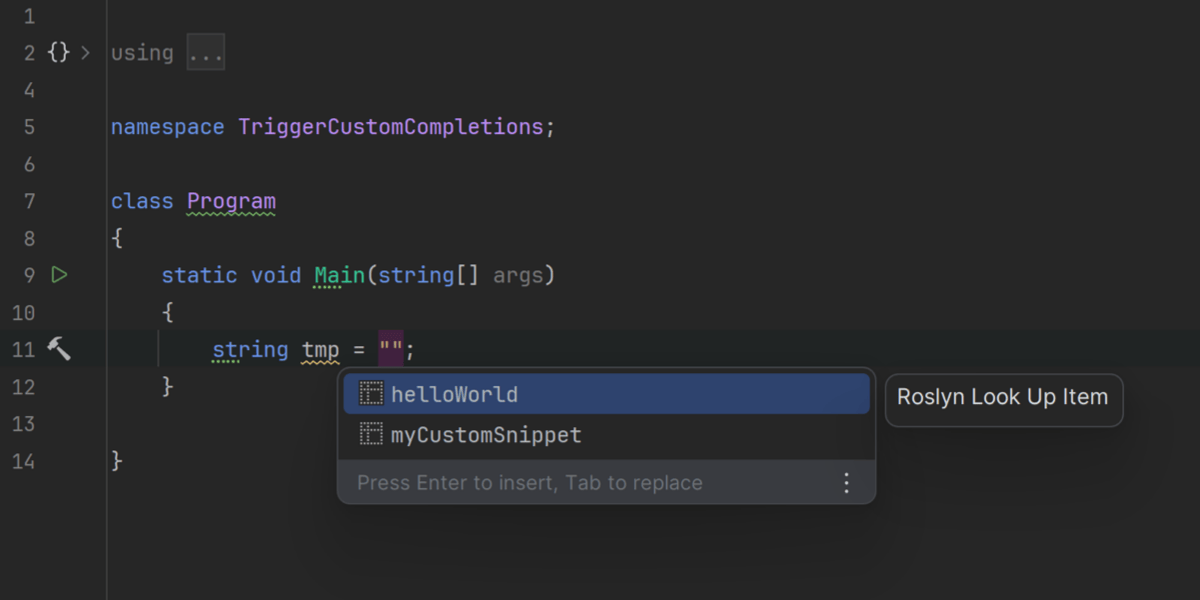
Roslyn code completion support
Rider now supports code completion extensions based on Roslyn’s CompletionProvider API. This means NuGet-delivered analyzers can offer intelligent, context-specific code suggestions by plugging into the Roslyn CompletionService.
This enhancement unlocks support for advanced ASP.NET Core completions (like route patterns and embedded language syntax), as well as custom completions from community packages and in-house tools, bringing greater flexibility to your Rider development experience.
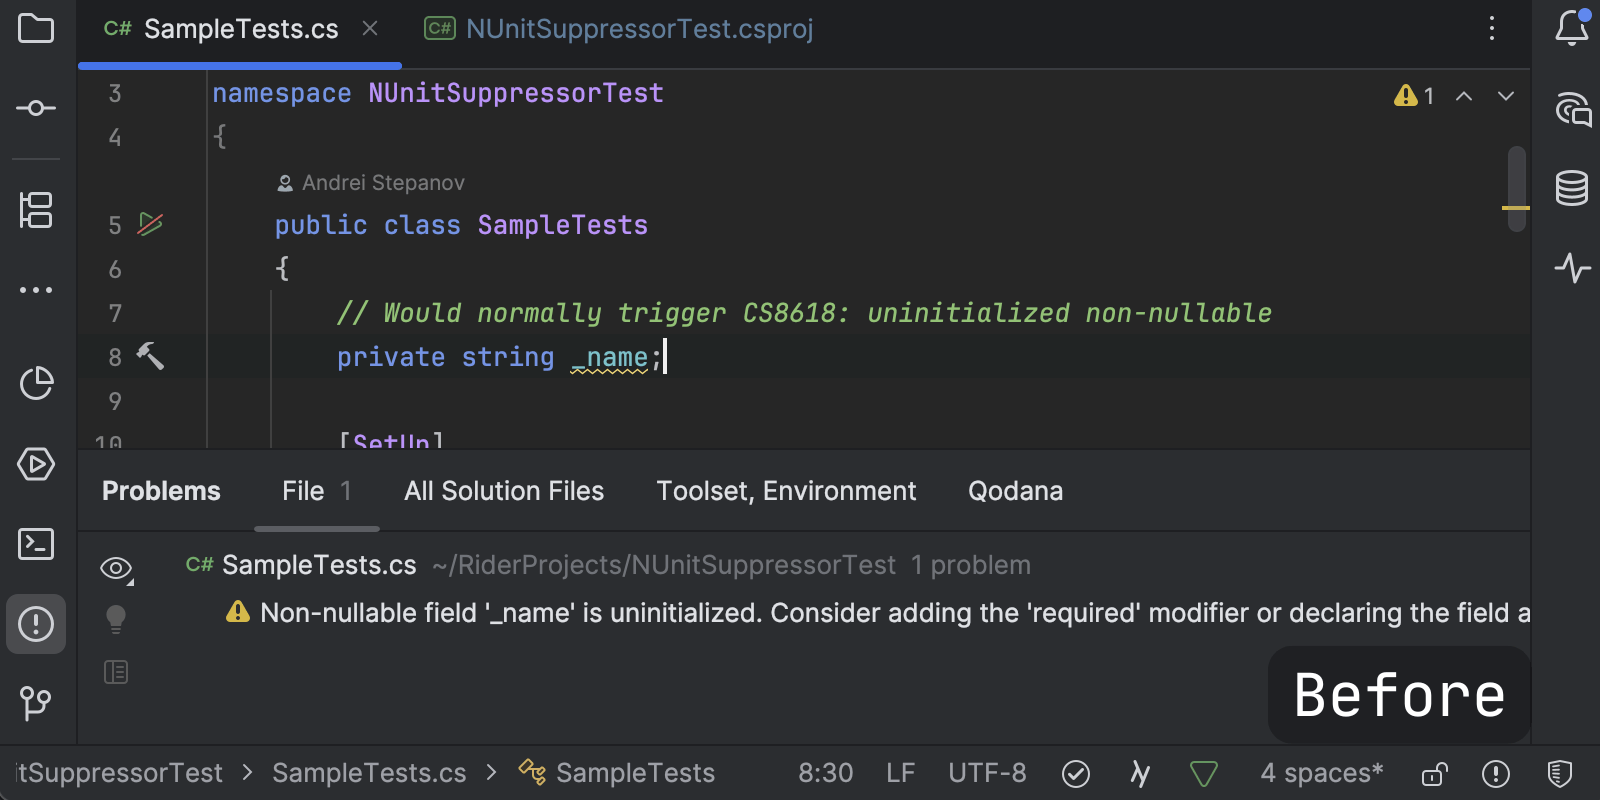
Roslyn-based suppressors
Rider now fully supports Roslyn-based suppressors, which eliminate unnecessary warnings with custom logic without cluttering your source files. Unlike traditional [SuppressMessage] attributes or #pragma directives, these suppressors work invisibly in the background. When a diagnostic is suppressed, it simply disappears from your editor and won't disrupt your workflow.
F# support
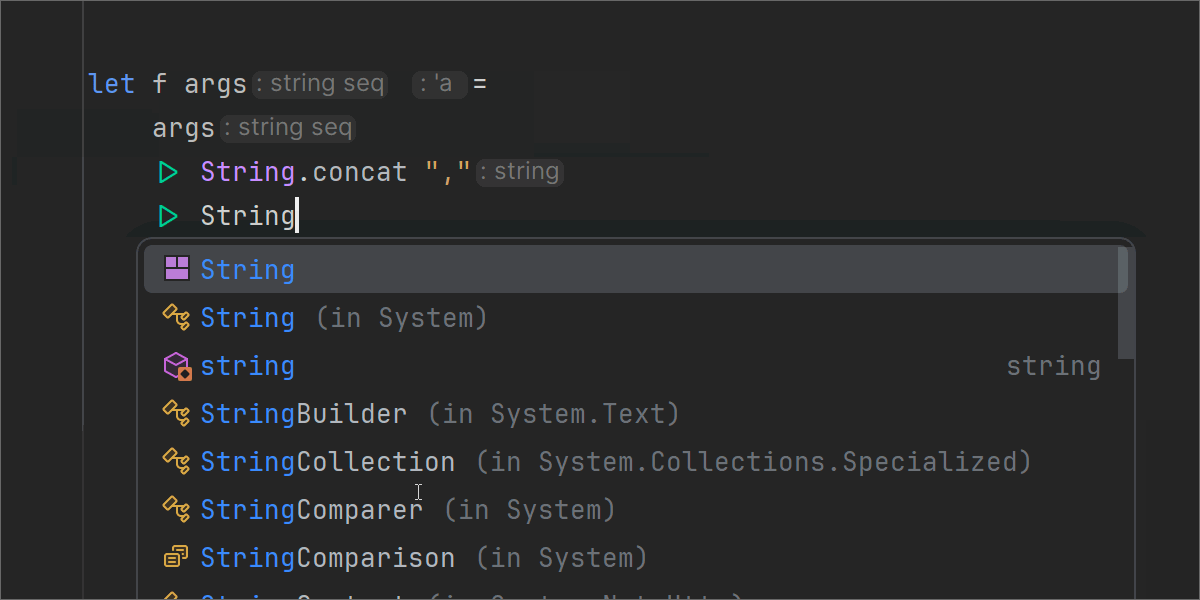
Improved import suggestions and quick-fixes
We’ve further improved Import features in code completion and quick-fixes, now supporting static type members and delivering better performance and accuracy for other symbols.
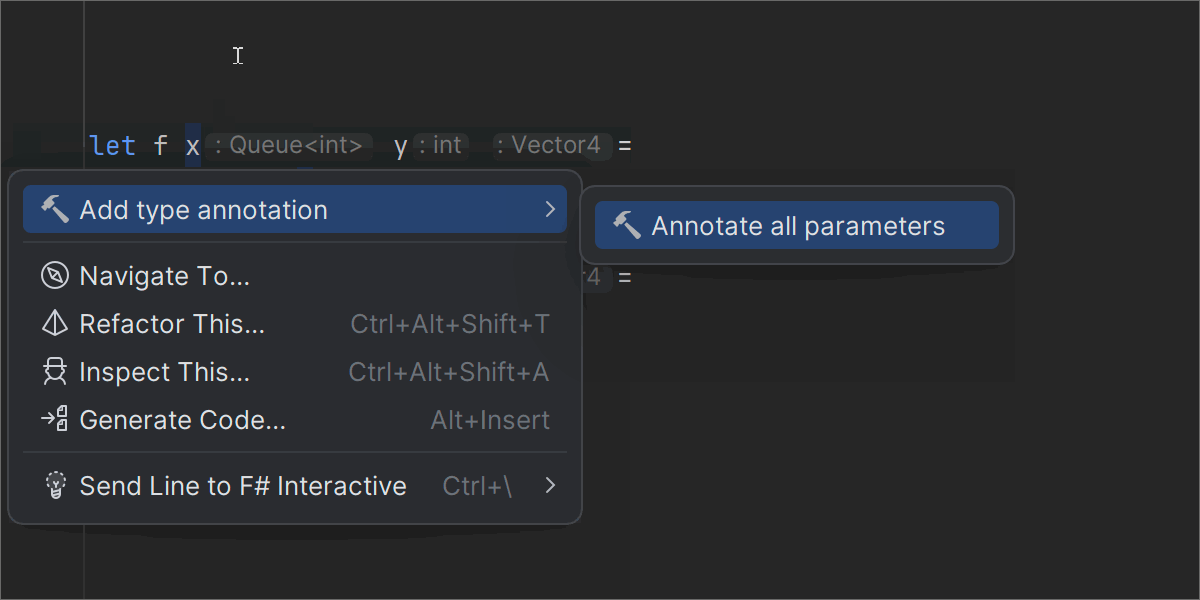
Smarter code annotations and type inference
Code annotations now automatically import required types, and specifying inferred types via context actions is supported in more situations.
Code analysis and interop fixes
We’ve resolved multiple issues in code analysis, including those related to language interop and F# scripts.
AI
Junie

Junie is now faster and smarter with MCP support
Junie, your AI coding agent from JetBrains, is now up to 30% faster and supports the Model Context Protocol (MCP), enabling deeper context awareness and smarter task execution. Starting with this release, you can use Junie for remote development as well.
Junie GitHub integration Early Access Program
Junie now integrates with GitHub, helping you manage pull requests without even opening your IDE. When working asynchronously, Junie takes more time to analyze and respond, delivering thoughtful, context-aware results. This feature is currently available in an Early Access Program – join the waitlist to try it out in your IDE.
AI Assistant
The latest updates
JetBrains AI Assistant just got a major upgrade – bringing you faster and more project-aware AI assistance that is fully integrated into your development workflow.
Here’s what’s new:
- Smarter completion across all supported languages, now with support for SQL, YAML, JSON, Markdown, and more.
- Project rules mean you can instruct AI to comply with your team’s coding conventions and business logic.
- JetBrains AI Assistant now supports image attachments in the chat when using Anthropic and OpenAI models.
Get all the details here.
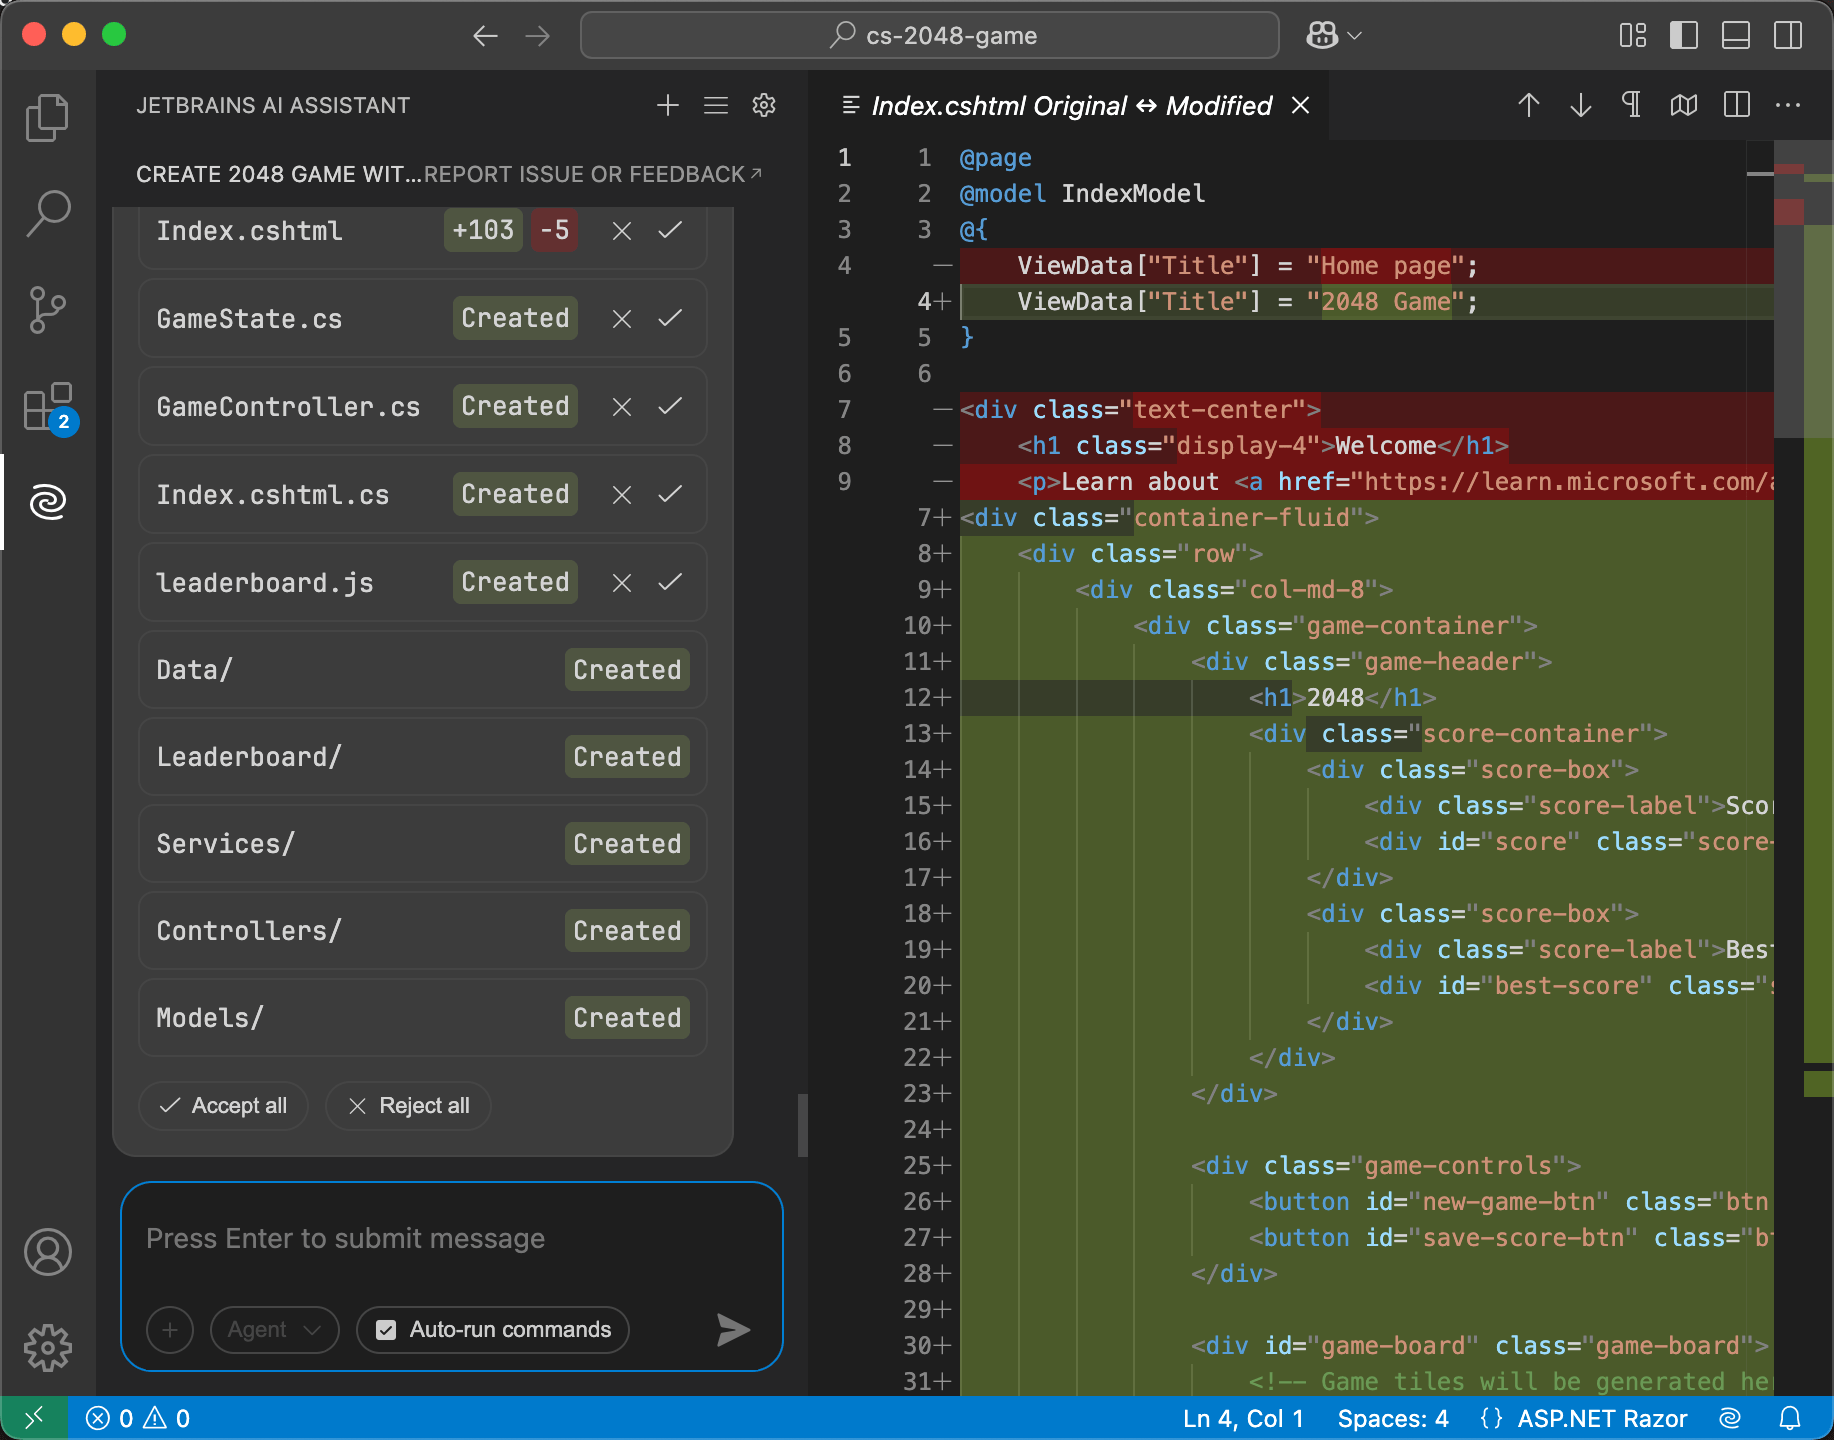
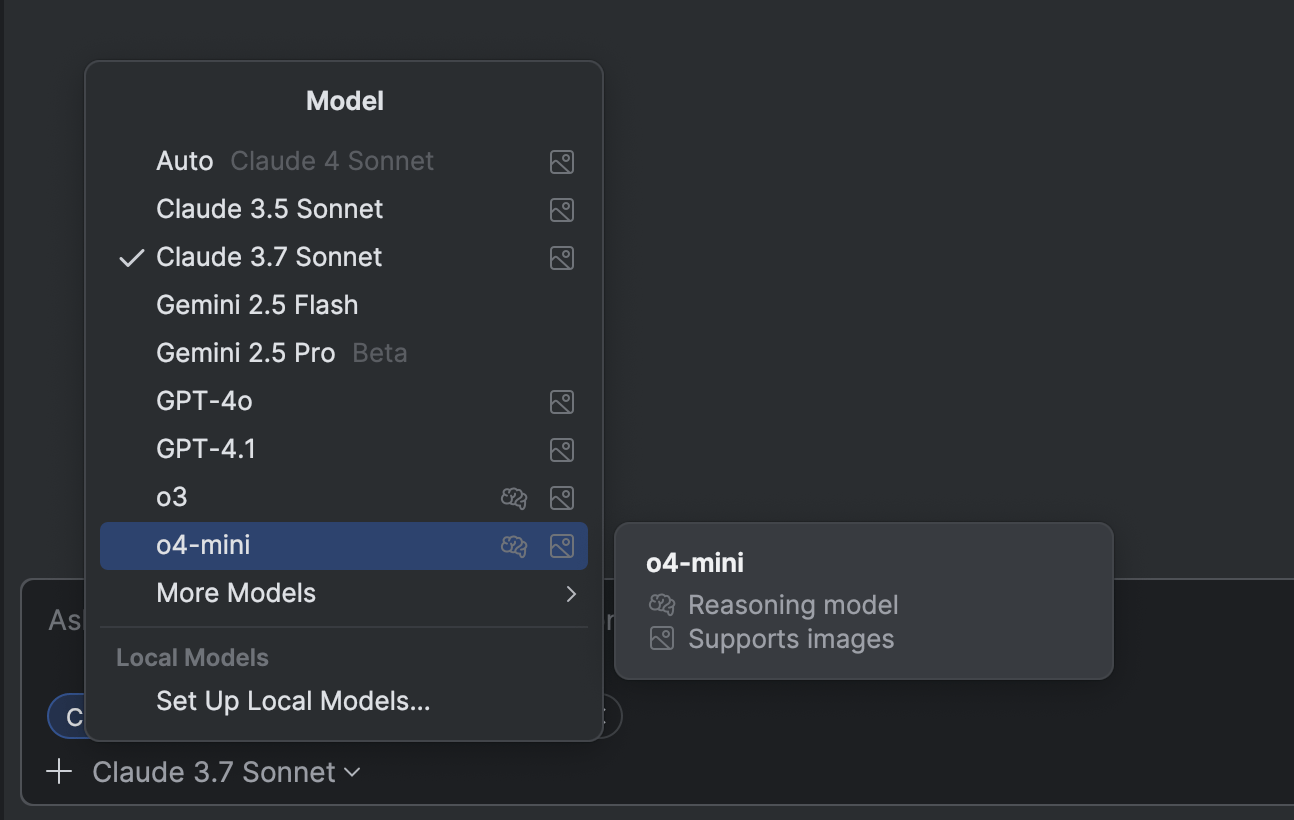
AI Assistant for VS Code Public Preview
AI Assistant is now available for Microsoft Visual Studio Code, bringing the familiar AI-powered capabilities available in JetBrains IDEs to VS Code workflows.
The extension offers a project-aware chat, intelligent code completions powered by Mellum, documentation generation, commit message suggestions, and more. The newly introduced Agent mode assists with complex, multifile changes, while you maintain full control over the process.
This is a great option if you work with C# in both Rider and VS Code. You can use your current JetBrains AI subscription or, if you don’t have one yet, a free AI EAP license will be issued to you automatically once you log in with your JetBrains Account.
Native debugging
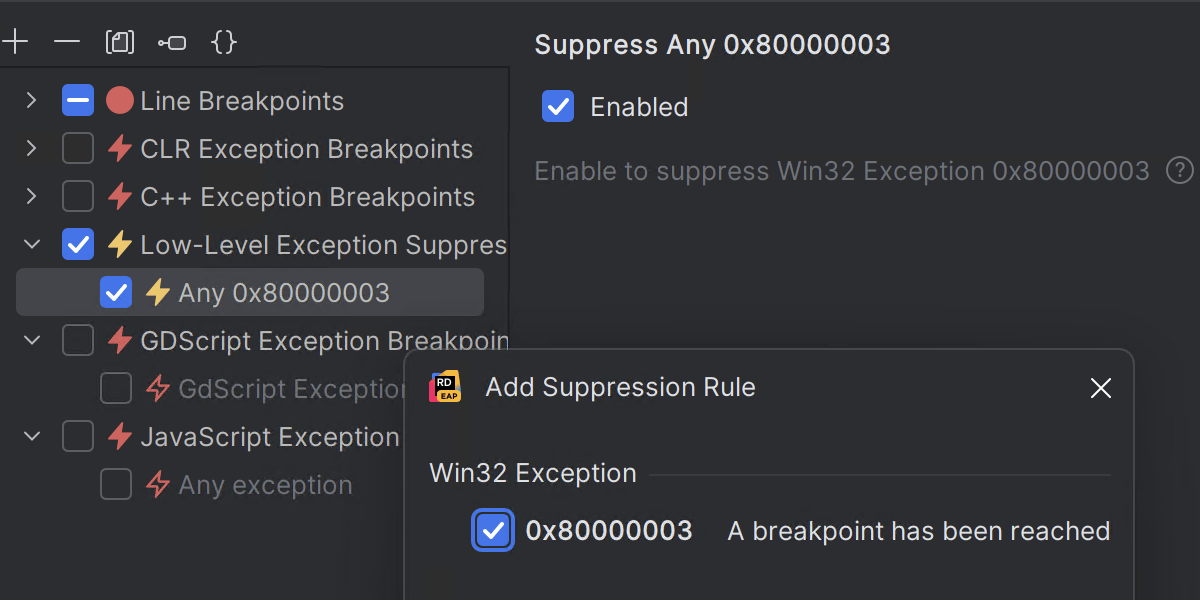
Suppressing low-level exceptions
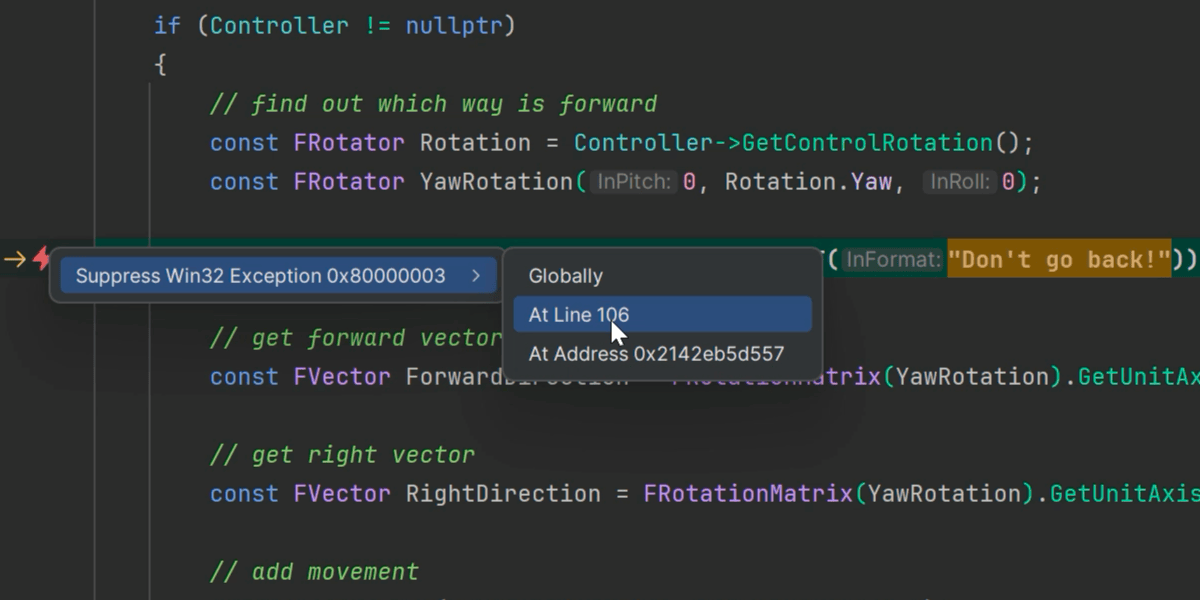
This release introduces a great new feature supporting low-level exceptions.
Many frameworks, including Unreal Engine, use the int3 instruction and similar signal or compiler intrinsics to force the debugger to stop, usually implemented as a form of assertion.
Rider 2025.2 allows suppressing these assertion exceptions, either globally through a new exception suppression breakpoint or locally by right-clicking in the editor when a low-level exception occurs.
Read the blog post for more details.
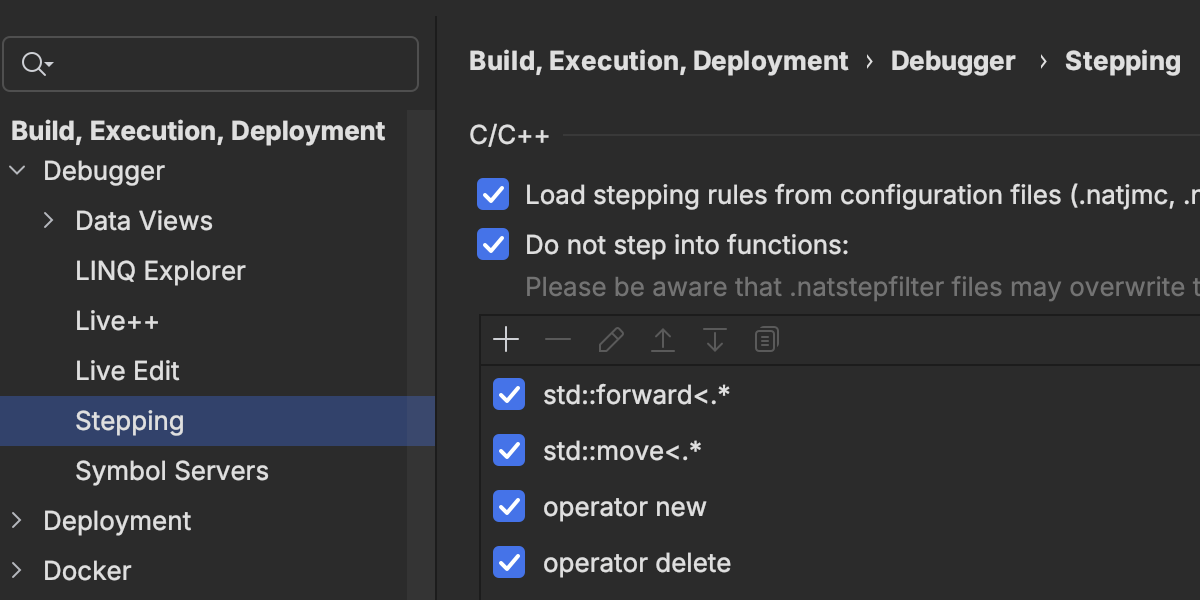
Step filters
We’ve added a great power user feature with step filters, which changes the behaviour of Step Into for certain methods. If a method or function is marked to be skipped, the Step Into action acts like Step Over, making it much easier to work with “library” code while debugging.
Methods and functions can be added to the UI, or configured through .natstepfilter and .natjmc files.
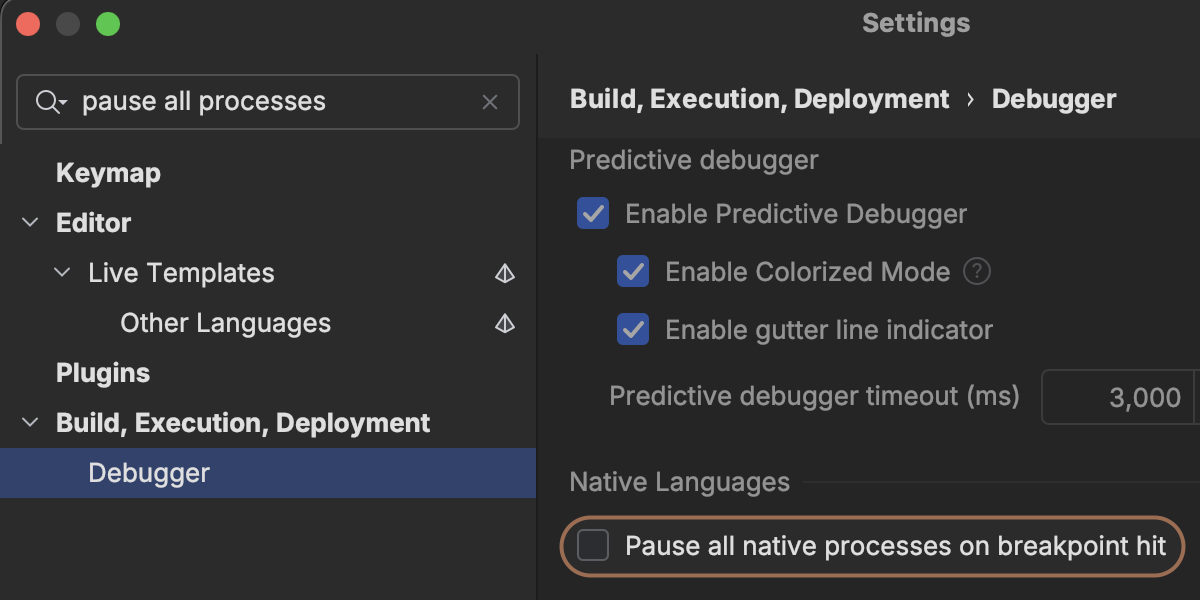
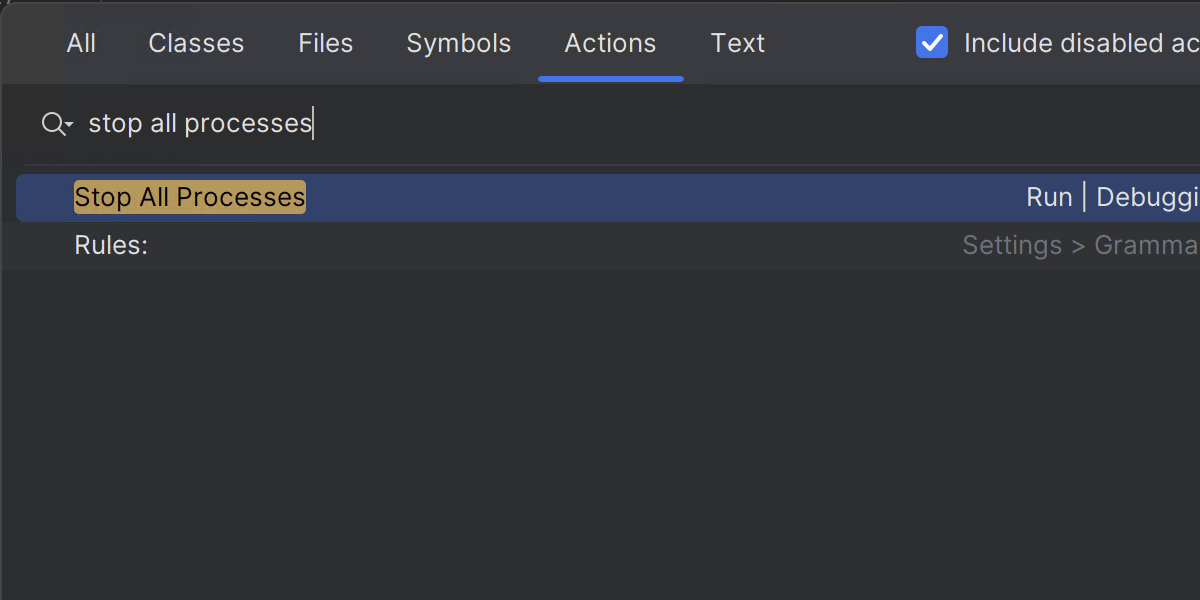
Pause All Processes action
Debugging multiple processes can be a complex task, so we’ve added a new setting that will pause all processes when a breakpoint is hit in any process, and there are new actions to resume, pause, and stop all processes.
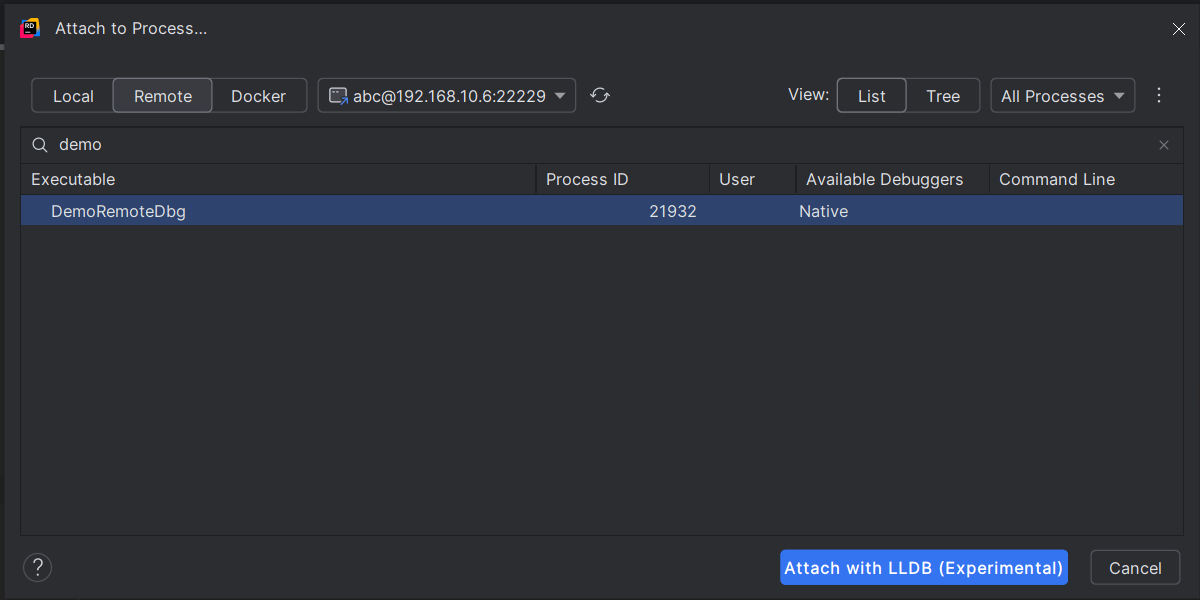
Remote native debugging Windows
Rider 2025.2 now supports debugging native processes on remote machines, just like it does for debugging remote .NET applications. The Attach to Process dialog will fetch a list of processes from a remote machine via SSH and then attach the debugger to the chosen process.
Currently available for Windows only.
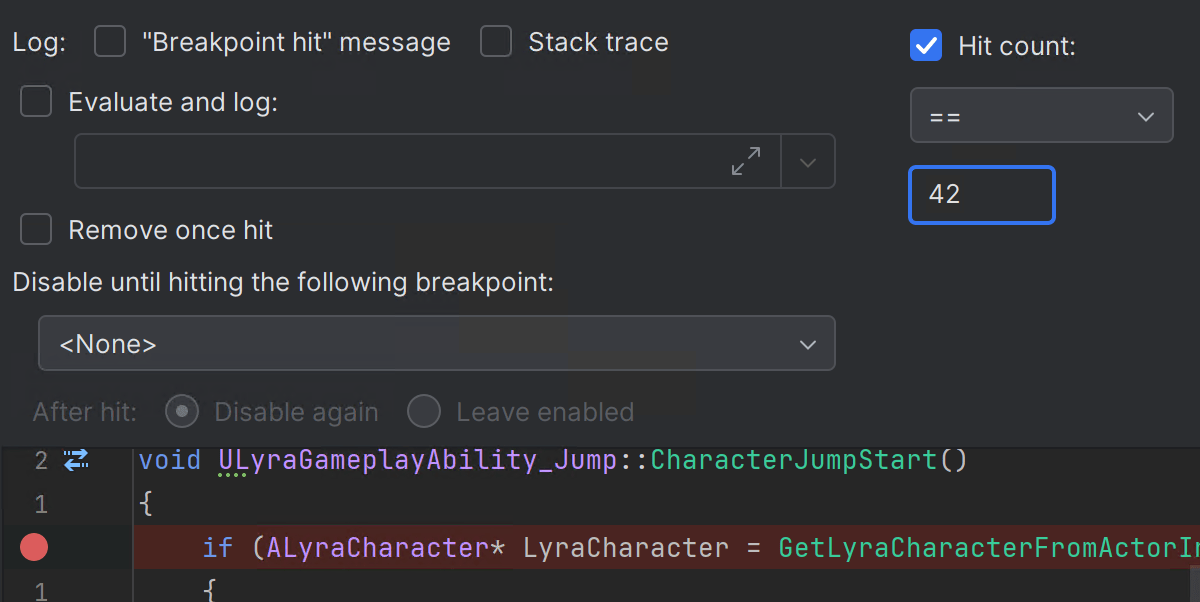
Child processes and hit counts
Other minor updates include adding the ability to change the order of child process tabs through the config file that controls attaching to child processes, and we’ve added support for hit count conditions for C++ breakpoints.
And of course, all of these new features work great with Unreal Engine development, too! Check out the Game development section to see what else is new for Unreal Engine.
Game development
Unity
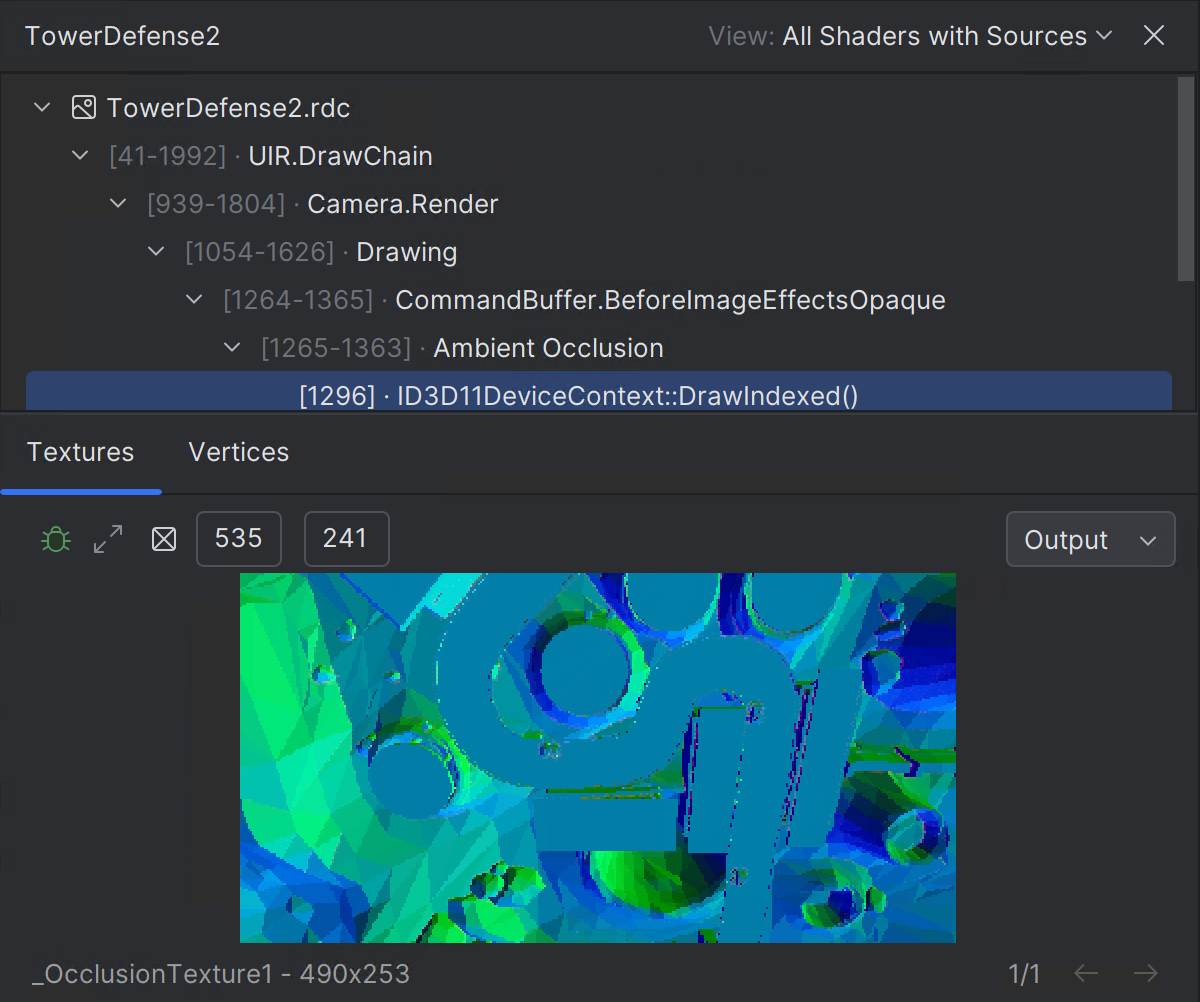
Shader debugging Windows
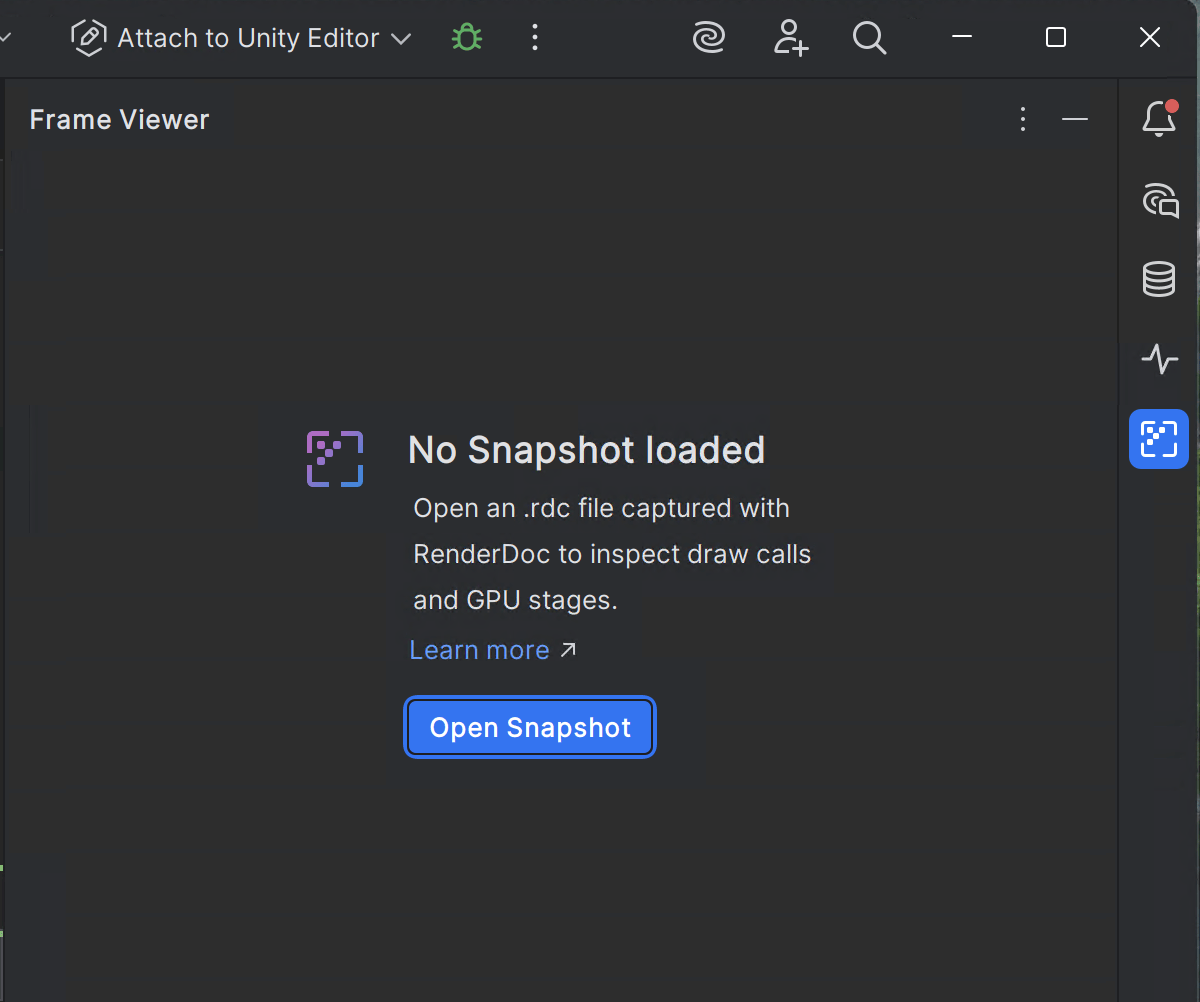
Rider now offers source-level debugging for Unity shaders in the bundled Frame Viewer plugin!
- Inspect
.rdcrendering snapshots from RenderDoc directly inside Rider. - Debug draw calls with mapped shader source files.
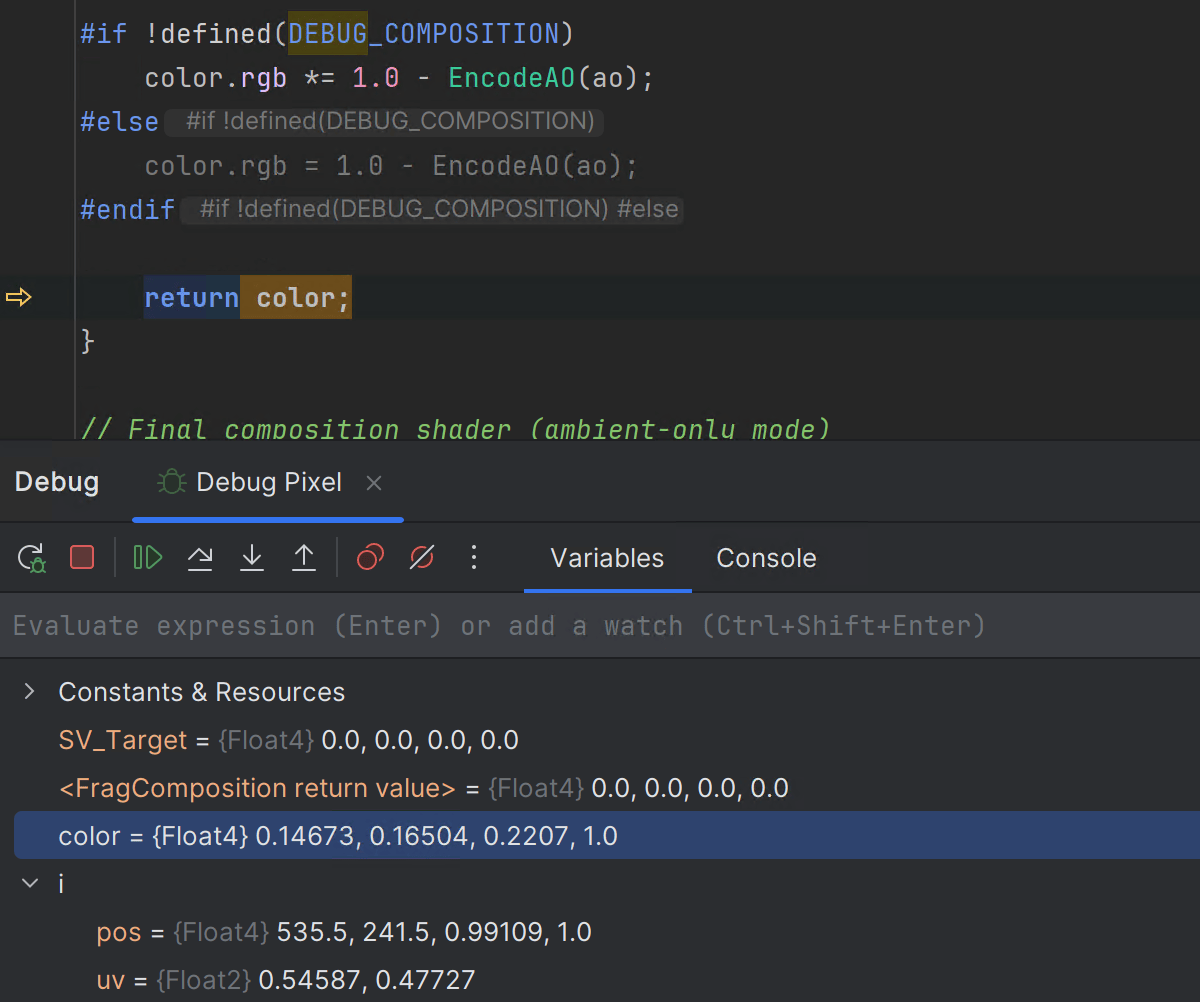
- Set breakpoints and step through the original ShaderLab source code (not just generated HLSL).
- See active draw calls in a tree view and debug interactively via vertex and pixel selection.
- View and expand textures, and use shaders as context and filters for draw call analysis.
Currently available for Unity projects on Windows only.
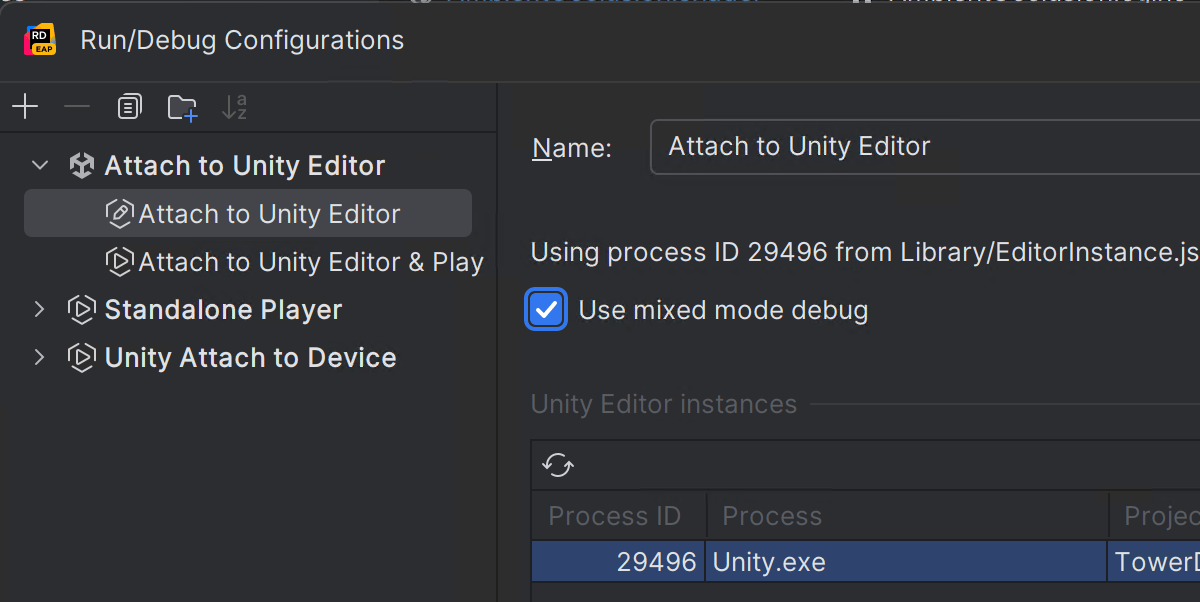
Mixed-mode debugging Windows
A much-requested feature has been the ability to debug both managed and native code, especially in a Unity project. Rider 2025.2 adds support for mixed-mode debugging for Unity projects, so you can now set breakpoints in both C# code and C++ code and step between the two. Use the checkbox in the run configuration editor to enable mixed-mode debugging.
Currently available for Unity projects on Windows only.
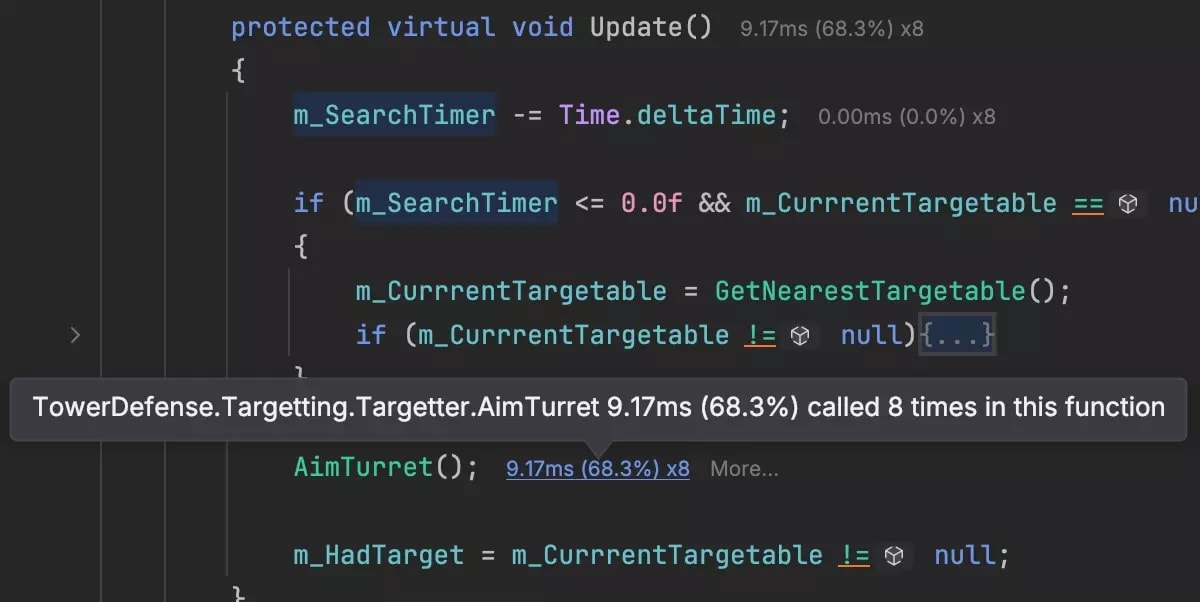
Unity Profiler integration
We’ve enabled Rider’s integration with the Unity Profiler by default. This feature was introduced as experimental in 2025.1 and has now graduated to being active by default. When you profile in Unity, Rider will automatically load the details and show performance information directly in the editor.
Learn more about this feature from the Rider documentation.
We’ve also fixed a number of tricky problems that could lead to skipped breakpoints, hangs, and other performance issues. It’s been very difficult to track down and reproduce these problems, as they are highly project-specific and related to size, specific coding patterns, usage of generics, and so on. We’ve had fantastic help from the community in diagnosing and recreating these issues, so a big thank you to everyone who has engaged with us and provided so much useful information and feedback!
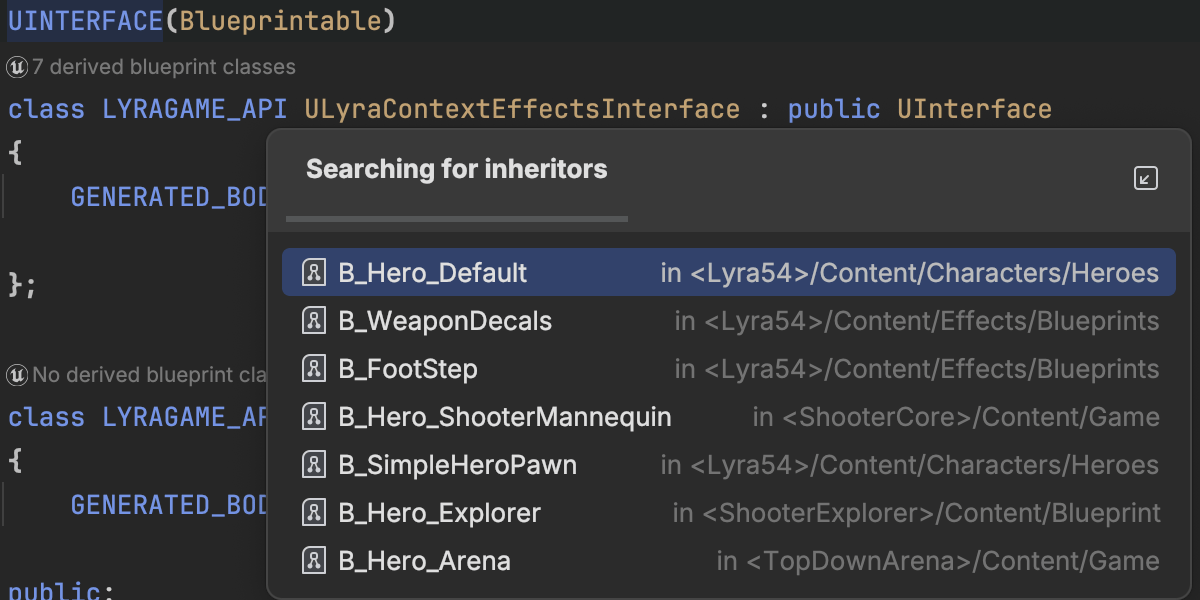
Show Usages for UINTERFACE
Rider’s excellent support for showing where your code is being used inside Blueprints has been extended to support Blueprints that implement a UINTERFACE.
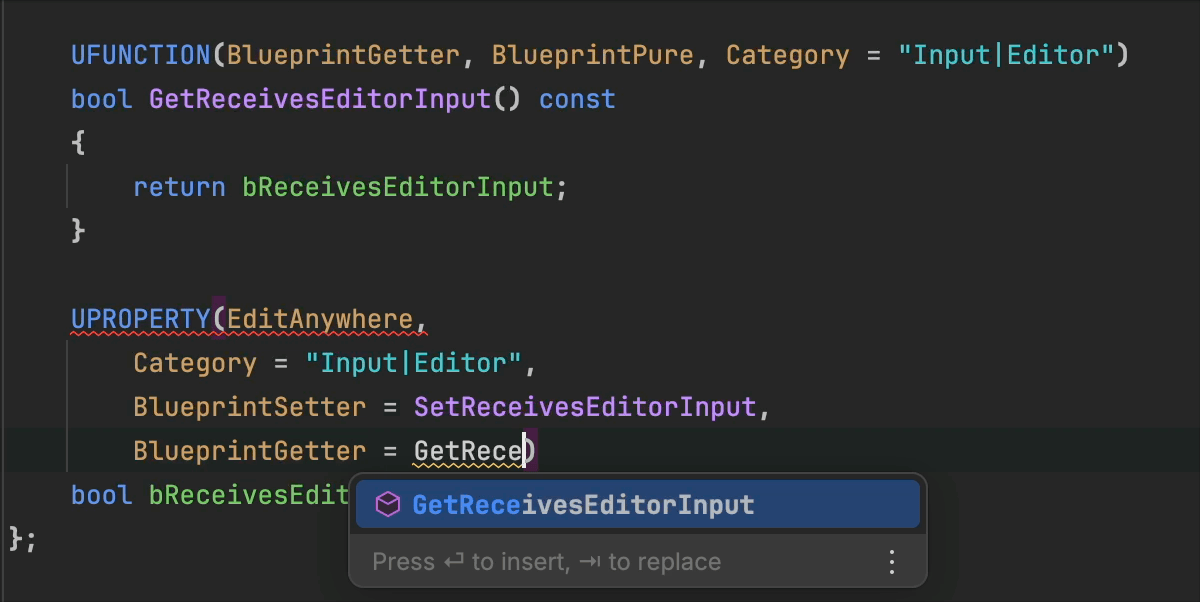
Code completion for getters and setters in Blueprints
We’ve added code completion for method names in BlueprintGetter and BlueprintSetter metadata.
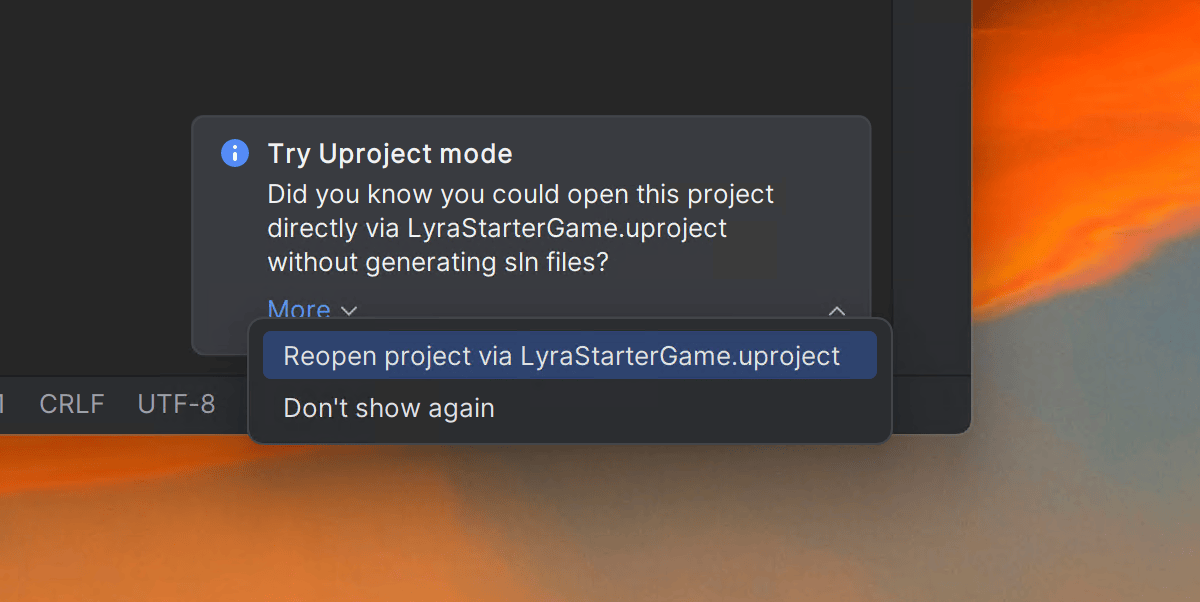
New suggester for loading .uproject files
In this release, we’ve added a handy little notification to suggest using the .uproject file to load your Unreal Engine project instead of generating a solution file.
Rider can load Unreal Engine’s native project format, and solution file generation isn't required, saving game developers a step. This change also means that Rider can load an Unreal Engine project on Mac and Linux.
On top of this, we’ve implemented a lot of new features in the native debugger that will be very useful for working with Unreal Engine. Make sure to check out what’s new in the Native debugging section.


Improved GDScript support
Rider 2025.2 bundles a new GDScript plugin, based on the previously community-driven plugin.
This means that Rider can now add its own features for GDScript, such as completion of code, Godot nodes, and resources. It will show documentation tooltips and parameter hints, and it supports Ctrl+Click navigation to declarations and Find Usages, as well as refactorings such as Rename. File templates are included to make it easy to add new source code.
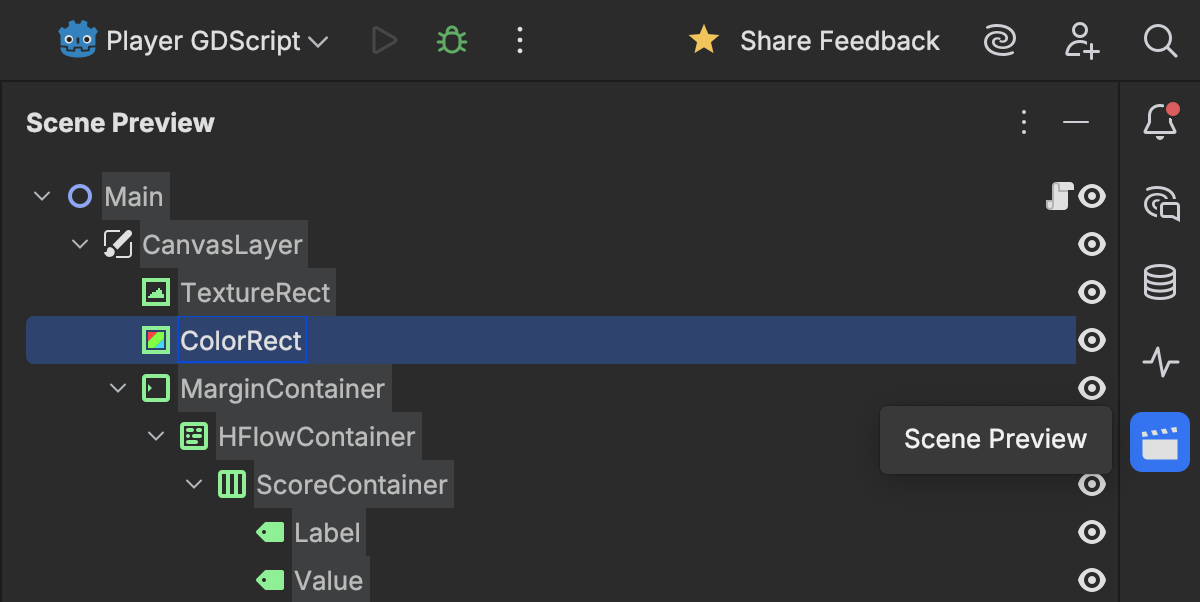
There's also a Scene Preview tool window showing all of the nodes in the current scene and in-editor icons to run the current scene, highlight parent methods, monitor resource usage, connected signals, and more. Inspections can check for problems such as unreachable code, as well as missing or incorrect return types. It can also perform deeper analysis than the Godot editor and can be stricter with untyped values and accidental implicit casts. Additionally, there are a number of Alt+Enter actions to fix issues or make small changes.
We’ll be making more updates to Rider’s GDScript support in future releases.
We’ve also addressed several issues in the C++ Godot source workflow: doctest-based tests now run correctly, and .sln/.vcxproj generation has been improved to support macOS, Linux, Windows and various C++ toolchains. For C# scripting, JetBrains Rider and JetBrains Fleet now have separate registration options in Godot’s editor settings.
Code coverage
End of code coverage for Mono and Unity projects
Rider 2025.2 will no longer provide coverage analysis for Mono and Unity projects from dotCover. Analyzing the low usage numbers, we realized that it significantly increases the technical debt for the team, who are now focused on performance improvements and branch coverage. We plan to restore coverage analysis for Unity projects once Unity migrates to CoreCLR (likely after Unity 7 LTS). The list of available target application types in the cover application dialog will be reduced to .NET, .NET Core, Windows Service, and IIS. If the change negatively affects you or if you have any concerns about it, please contact our Support team.
Web development
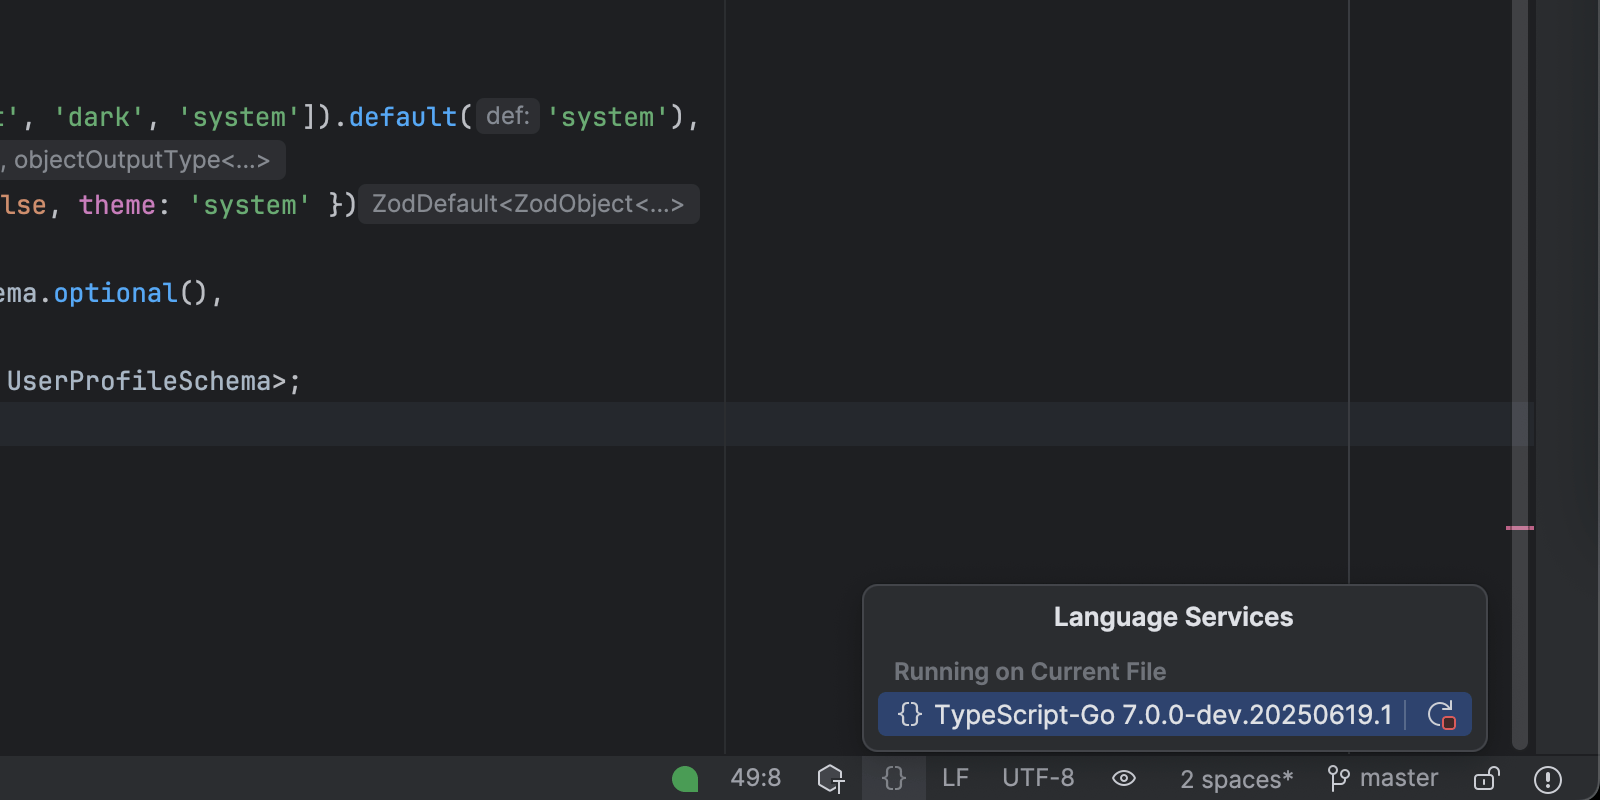
TypeScript-Go language server experimental support
Rider 2025.2 introduces experimental support for the new TypeScript-Go language server, bringing improved performance and modern architecture to TypeScript development.
You can enable it in your project by installing the @typescript/native-preview package as a dependency in place of TypeScript. Rider will automatically detect and use the correct language server.
For more detailed information, visit the What's New in WebStorm page.
Working with databases
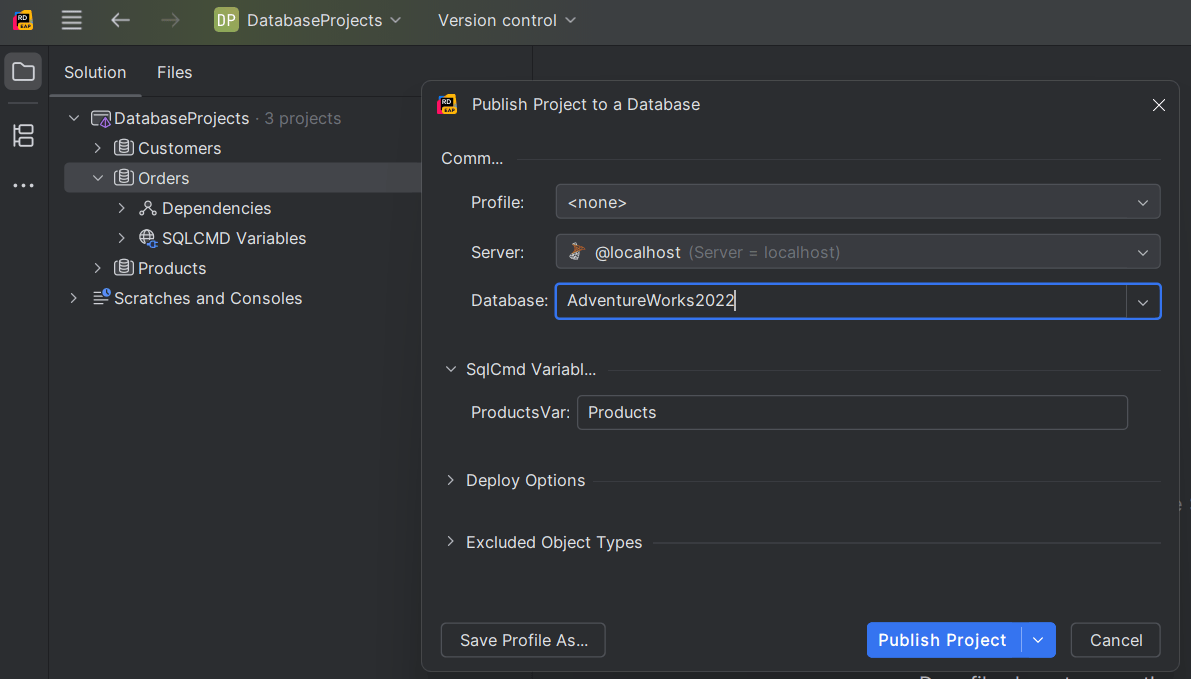
SQL project support
Rider now provides support for SQL database projects via a bundled plugin. The plugin works out of the box and delivers a smoother experience for working with SQL database projects. Key capabilities include:
- Support for
Microsoft.Build.SqlSDK-style projects. - Project templates for creating new SDK-style SQL database projects.
- Schema comparison.
- Project publishing.
- Importing projects from a database.
- Adding database references.
Miscellaneous
Dynamic Program Analysis to be sunset in Rider 2025.3
Starting with Rider 2025.3, the Dynamic Program Analysis (DPA) functionality will no longer be available in its current form. But this isn’t a goodbye – it’s a transformation.
Some of the analytical systems behind DPA are being integrated into the Monitoring tool window, which is part of our broader effort to simplify your workflow and provide a unified place to observe and refine the performance of your applications. This change allows us to deliver a more streamlined experience while retaining the valuable insights you rely on to build better, faster software. The DPA capabilities incorporated into the Monitoring tool will be available only with the dotUltimate license.