What’s New in IntelliJ IDEA 2024.2
IntelliJ IDEA 2024.2 Ultimate lets you run Spring Data JPA methods directly in the IDE
for instant repository query verification. It also simplifies the management of cron
expressions by providing inline descriptions and advanced autocompletion, and it upgrades
the HTTP Client to use the GraalJS execution engine. Additionally, this version enhances
IntelliJ IDEA’s overall startup efficiency by enabling key functionalities during project
indexing, and it integrates K2 mode, now in Beta, to further boost the IDE’s performance
and stability for Kotlin, as well as its support for language features.
Key highlights
Improved Spring Data JPA support
Ultimate
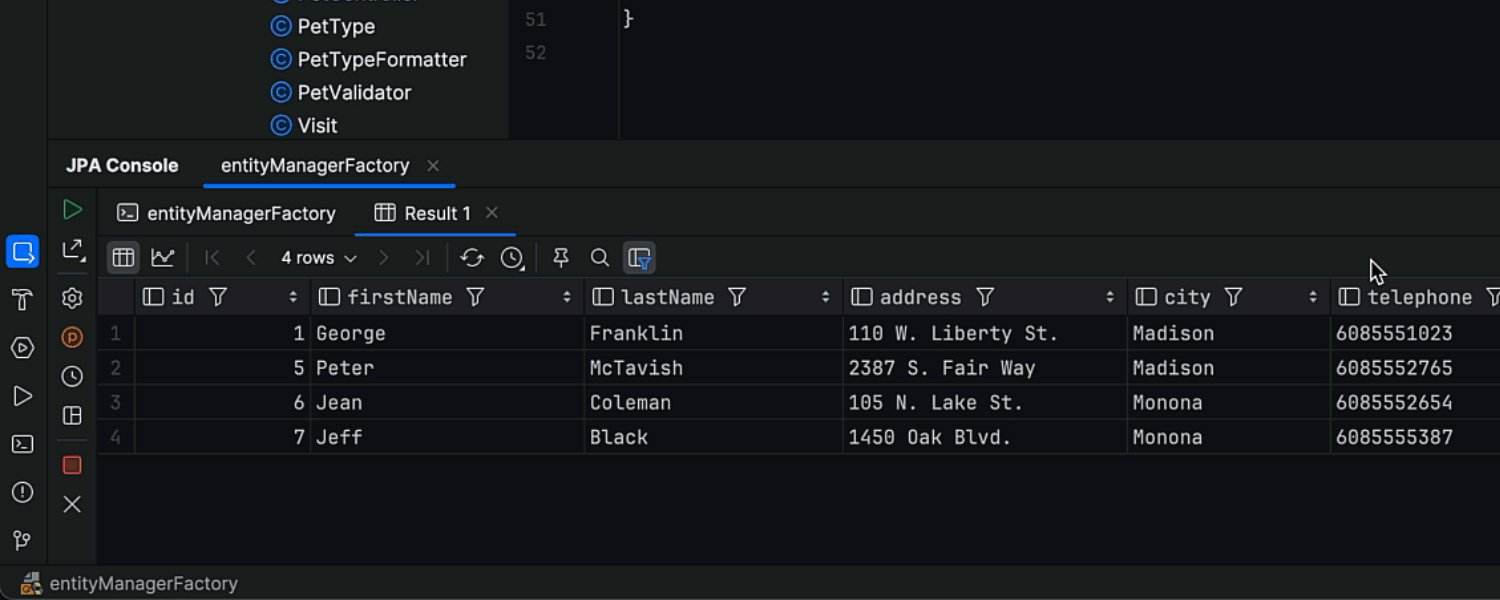
As part of our continuous effort to improve IntelliJ IDEA’s Spring framework support, we have added the capability to run Spring Data JPA methods in the IDE. This new feature allows you to see which query a method will generate without running the application and analyzing log files. You can now use a gutter icon to execute any repository method directly in the JPA console.
Improved cron expression support
Ultimate
cron expression support
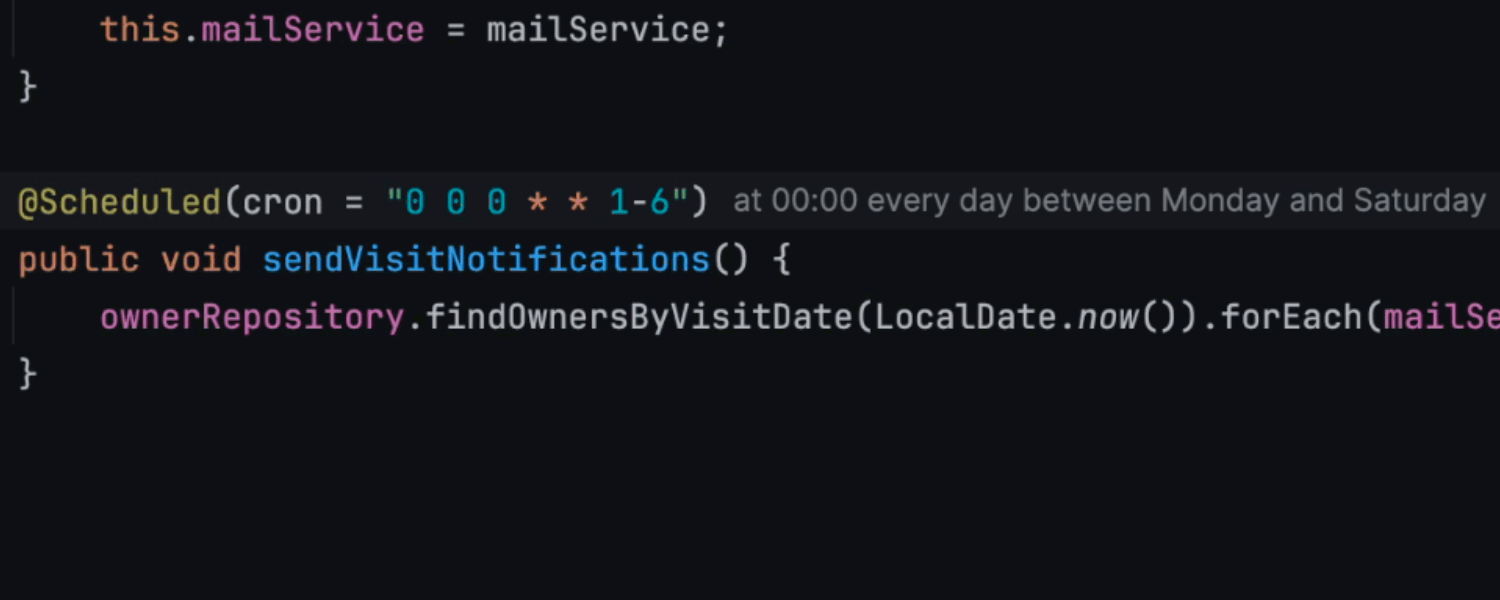
Working with cron expressions in your code is now easier than ever.
When implementing scheduled services with Spring, Quarkus, or Micronaut, you can
easily understand cron expressions thanks to the descriptions that
appear right next to them. Additionally, the autocompletion feature provides
pre-filled examples that you can instantly add and adjust instead of writing
cron expressions from scratch.
GraalJS as the execution engine for the HTTP Client
Ultimate
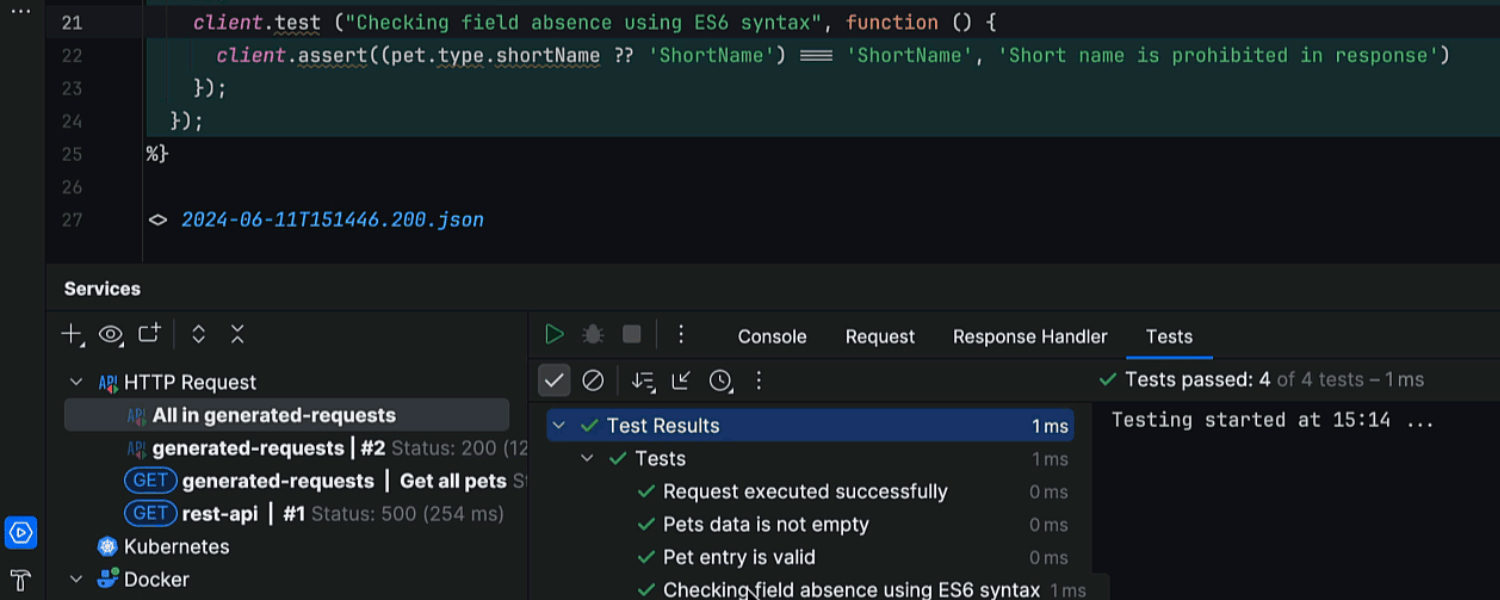
We’ve upgraded the JavaScript execution engine used in the HTTP Client to GraalJS.
This allows you to use all GraalJS features, including full support for the
ECMAScript 2023 specification, when testing endpoints with IntelliJ IDEA’s HTTP
Client and using JavaScript in .http files to handle the results.
Faster time to code
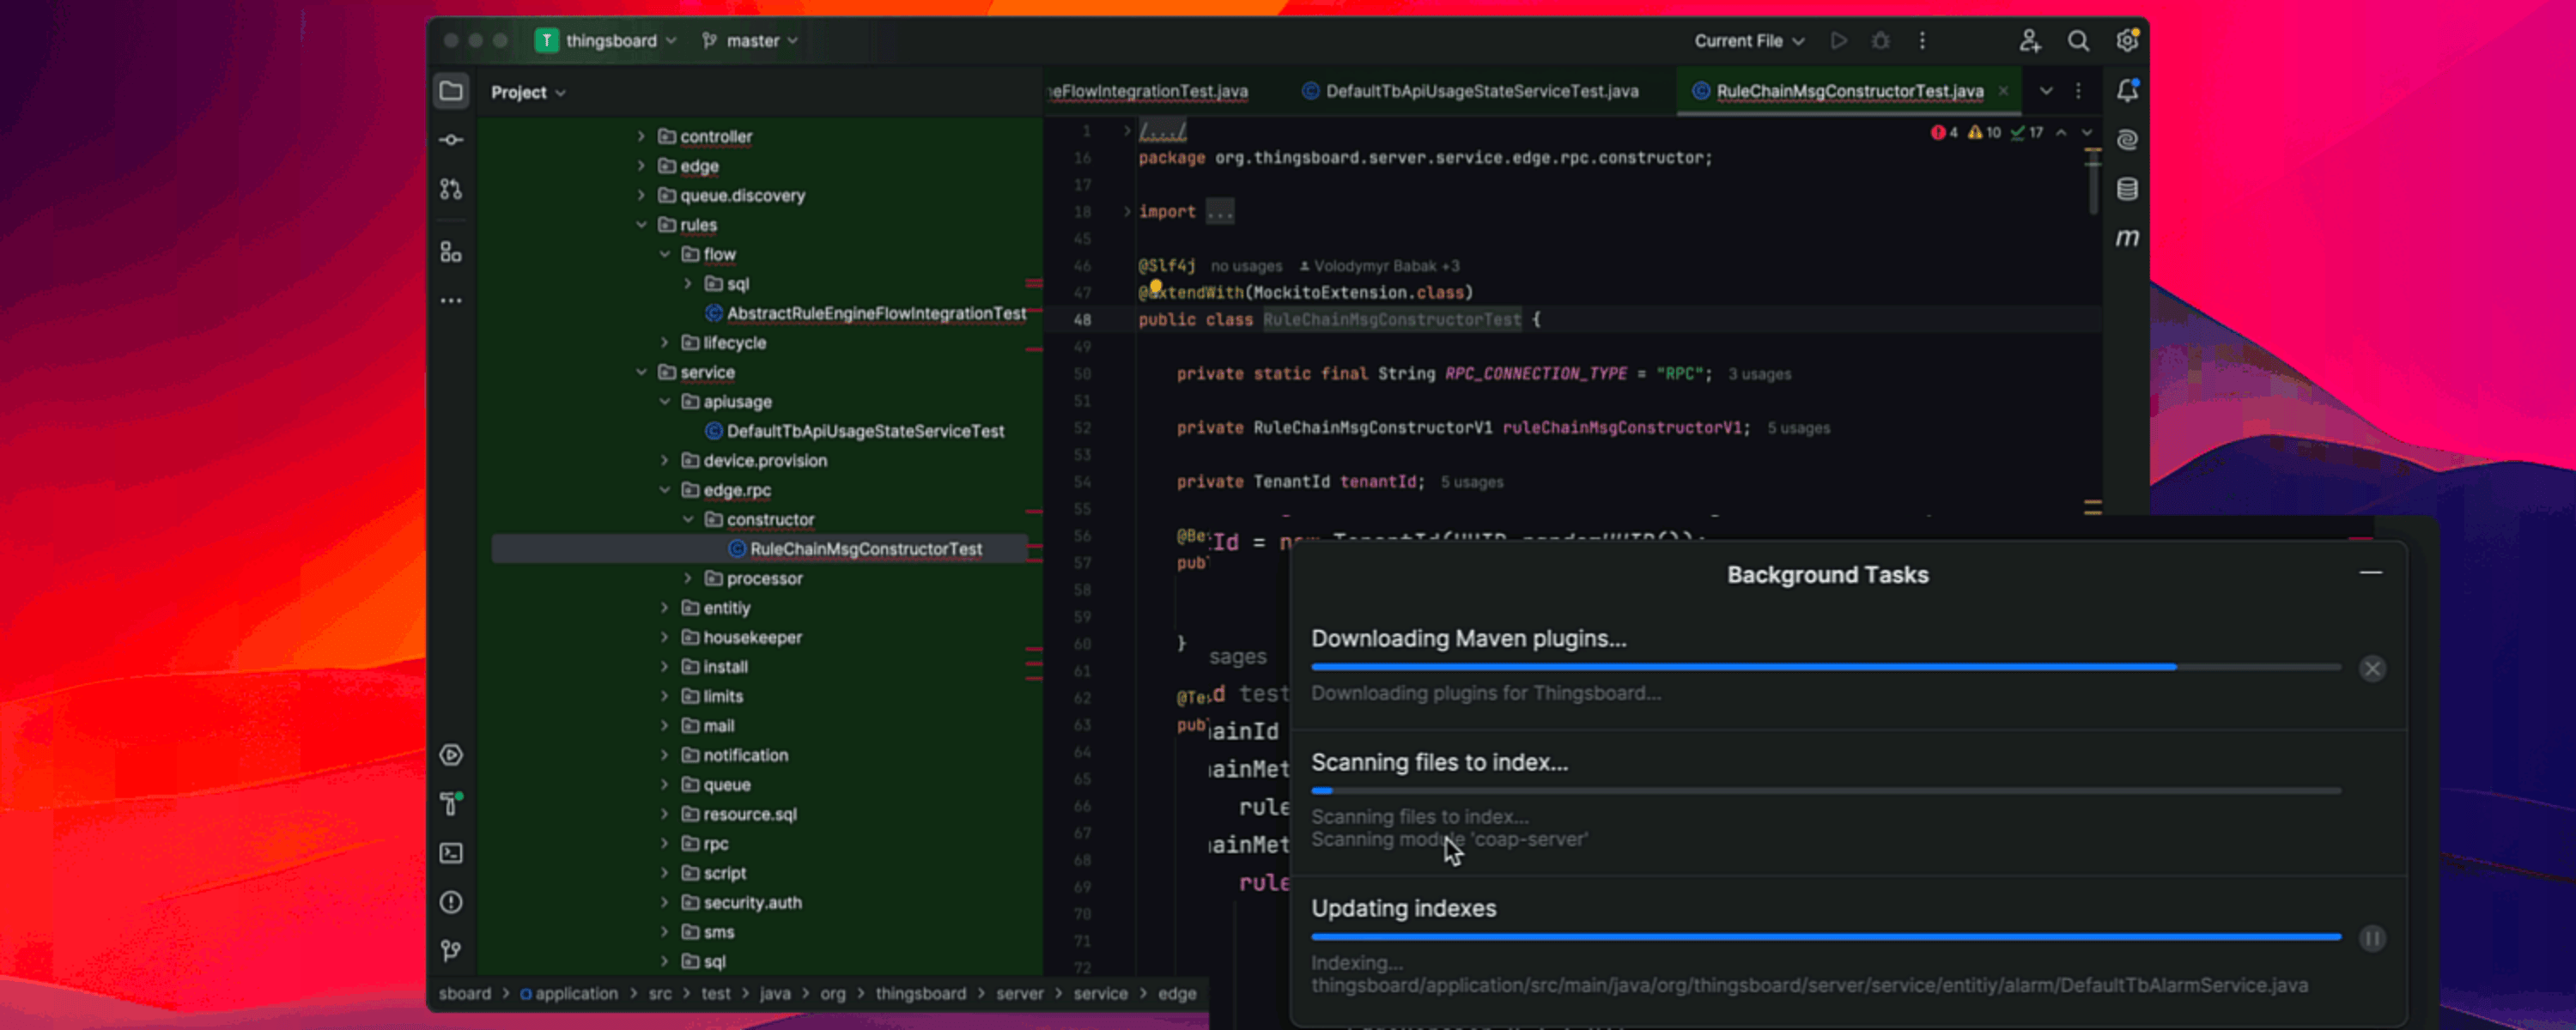
In the 2024.2 release, we've enhanced the startup experience, enabling you to dive into coding significantly faster. Reduced wait times are possible thanks to upgrades that make the IDE functional with an incomplete project model and enable access to key features during indexing, including code highlighting, code completion, intention actions, test launching, active gutter markers, Lombok support, and more.
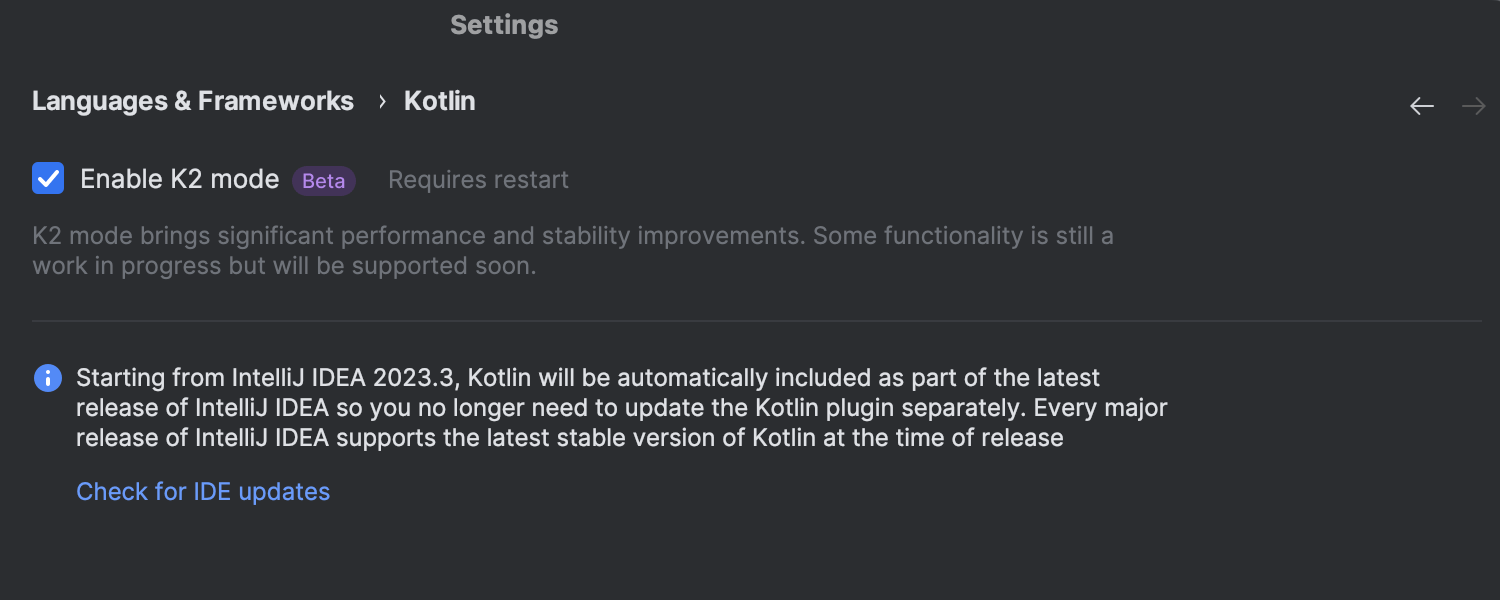
Improved stability and performance for Kotlin in K2 mode
Beta
IntelliJ IDEA 2024.2 improves K2 mode, a new Kotlin support mechanism that enhances
the IDE’s stability and performance in addition to laying the groundwork for future
Kotlin language features. In version 2024.2, K2 mode now supports
gradle.kts scripts, Kotlin Multiplatform (KMP) projects, all major
refactorings, code highlighting, debugging, and more. Benchmarks show that K2 mode
nearly doubles code highlighting performance on the IntelliJ IDEA Ultimate source
base. To activate it, go to
Settings/Preferences | Languages & Frameworks | Kotlin.
Learn more.
User experience
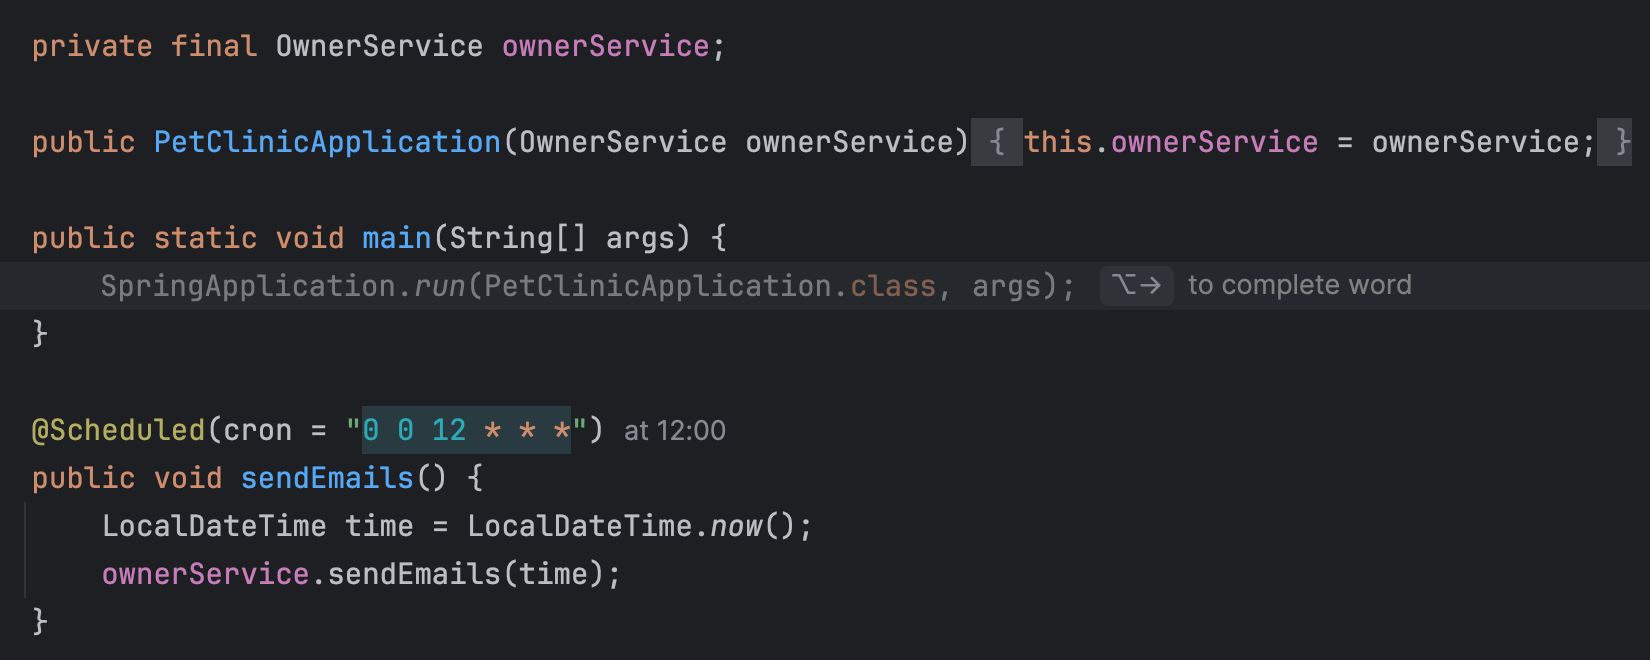
Improved full line code completion
In version 2024.2, we’ve made the process of accepting full line code completion suggestions more intuitive and precise. Inline code completion suggestions now include code highlighting, and new shortcuts allow you to accept individual words or entire lines from longer suggestions. We’ve also refined how accepted changes are integrated into your code, eliminating formatting and related issues.
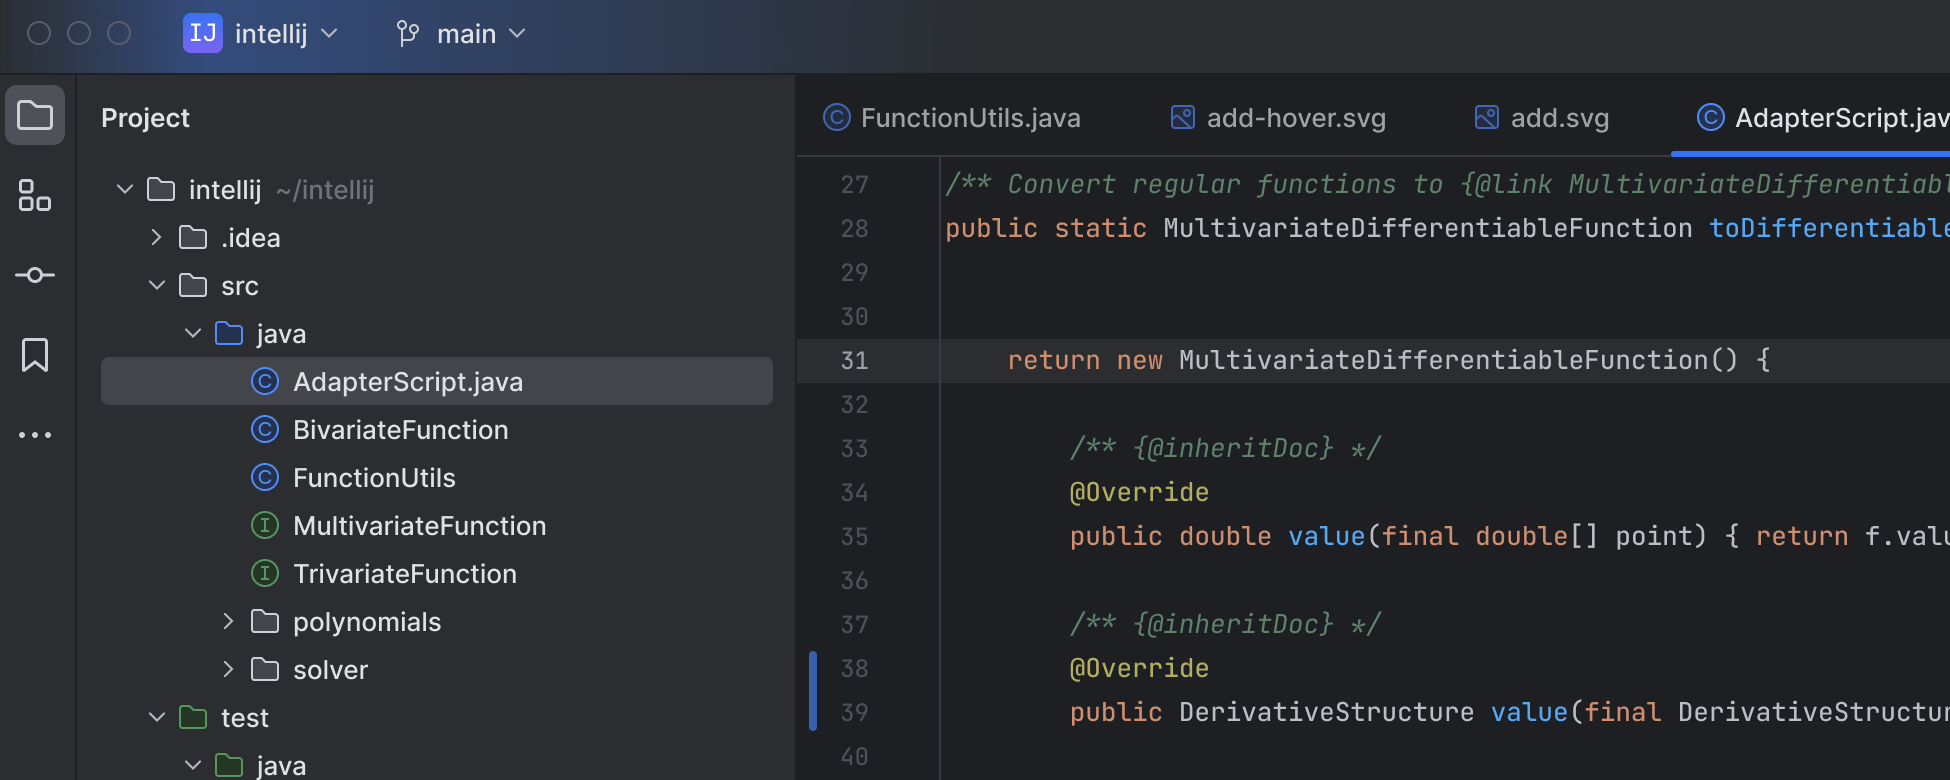
The new UI made default for all users
With IntelliJ IDEA 2024.2, the new UI is now the default for all users, leaving the classic one available as a plugin. The new UI is clean and modern, providing bigger, easier-to-use controls, a consistent color palette, light and legible icons, increased contrast, and better accents. As we’ve seen high adoption rates for the new UI and we’ve fixed the main issues based on your feedback, we believe it is ready for everyone. Learn more.
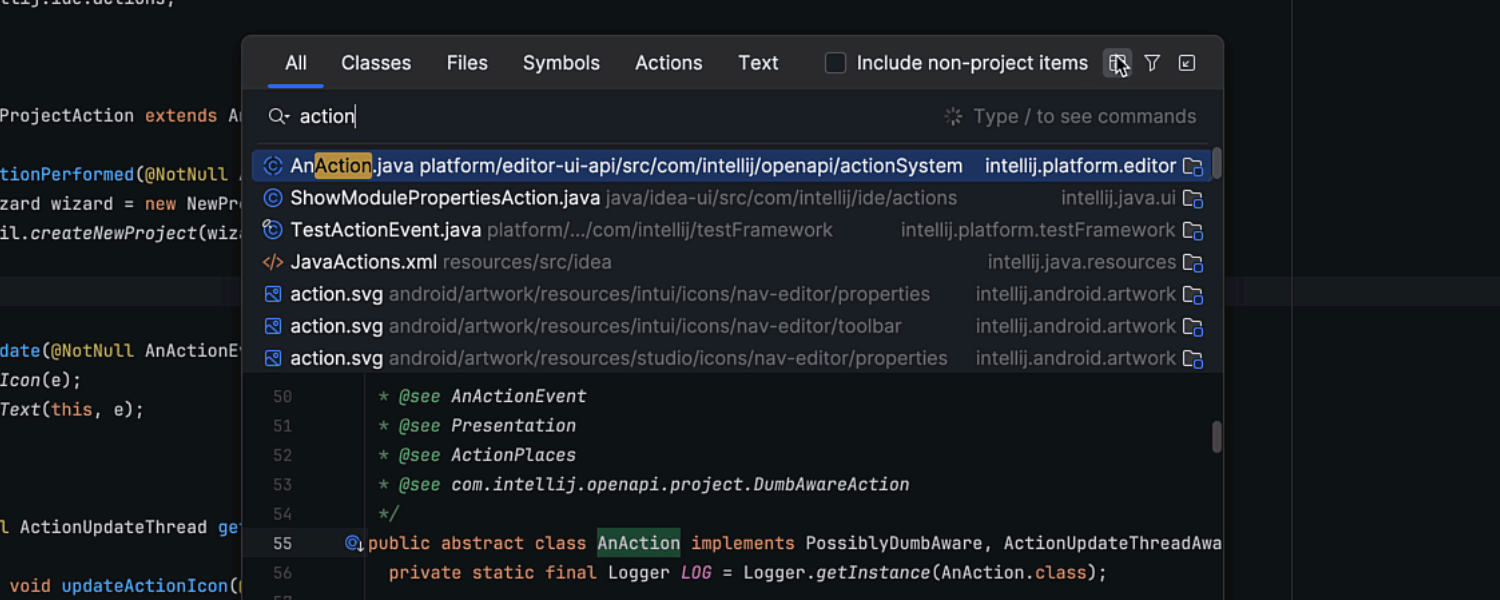
Preview option in Search Everywhere
The Search Everywhere dialog now includes an option to preview the codebase elements you’re searching for. Enabling this feature through the Preview icon on the dialog’s toolbar will cause a preview pane to appear under the search results, offering additional context and making it easier to navigate through your project.
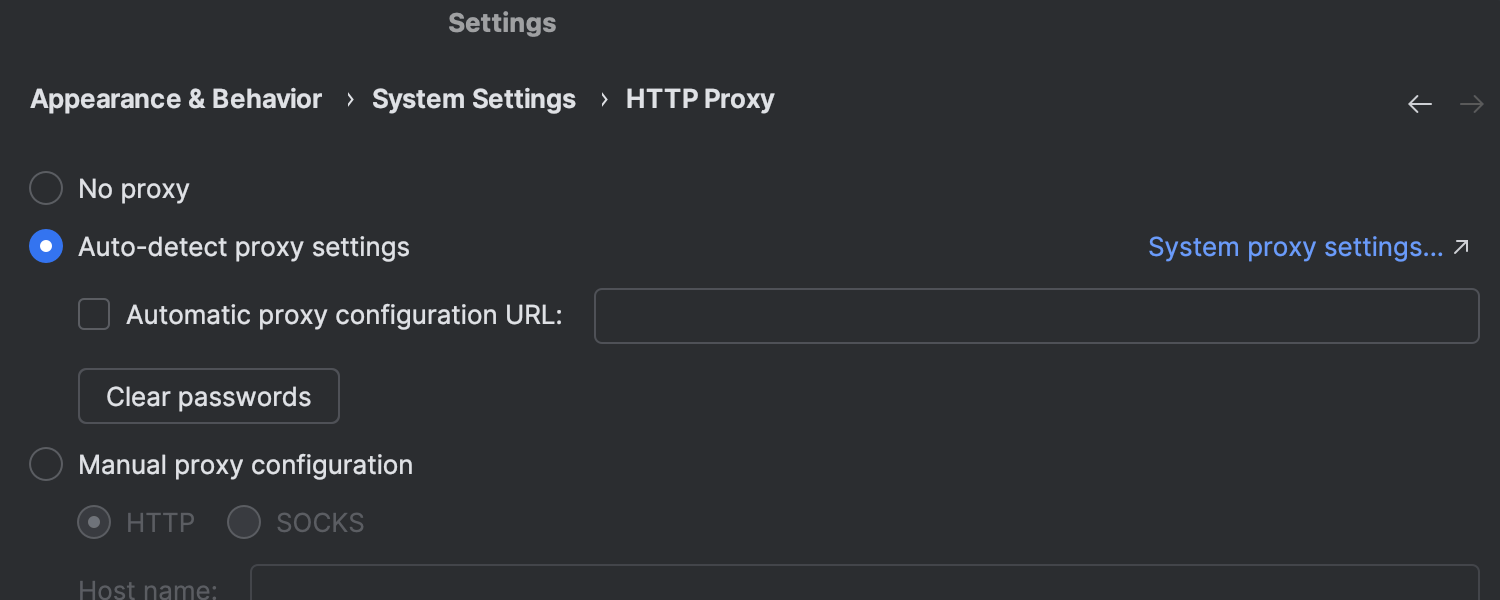
Proxy setting auto-detection enabled by default for new users
IntelliJ IDEA now automatically detects system proxy settings configured on your machine and uses them by default, facilitating seamless interaction with external resources and services.
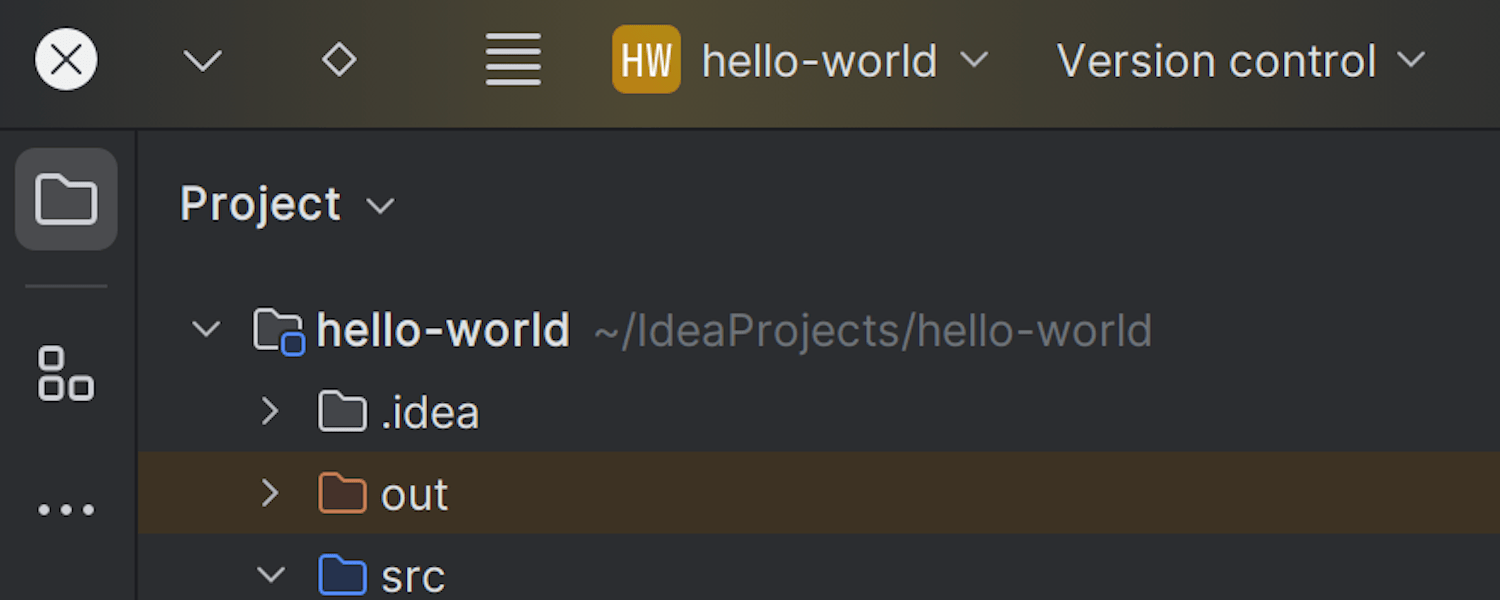
Updated window controls on Linux
On Linux, IntelliJ IDEA previously placed window controls on the right-hand side of the IDE. Now it automatically adjusts their placement to match the window control settings specified in your Linux desktop configuration. This small but important change allows you to maintain a layout that suits your personal preferences. Additionally, we have redesigned the window control buttons to provide a look and feel that more closely matches your OS.
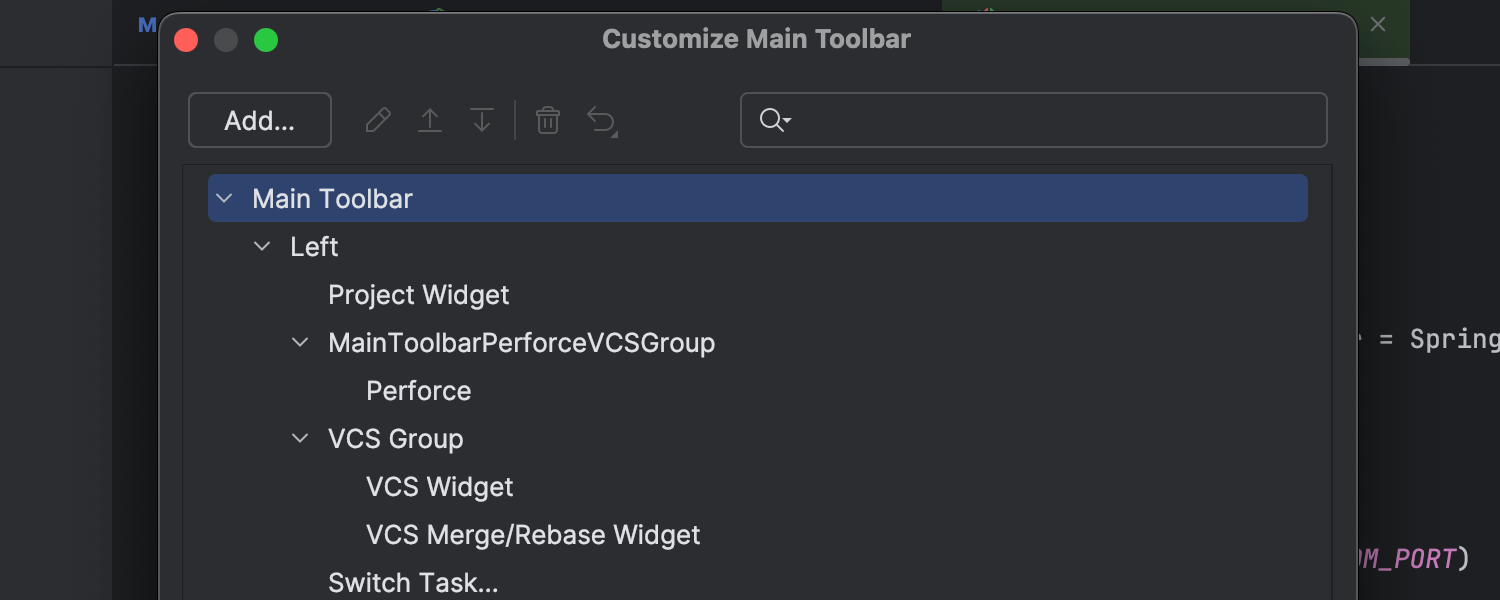
Improved Customize Main Toolbar dialog
We’ve redesigned the layout and behavior of the UI elements in the Customize Main Toolbar dialog, making it more intuitive and organized. It’s now easier to search for, add, and delete actions in the main toolbar.
AI Assistant
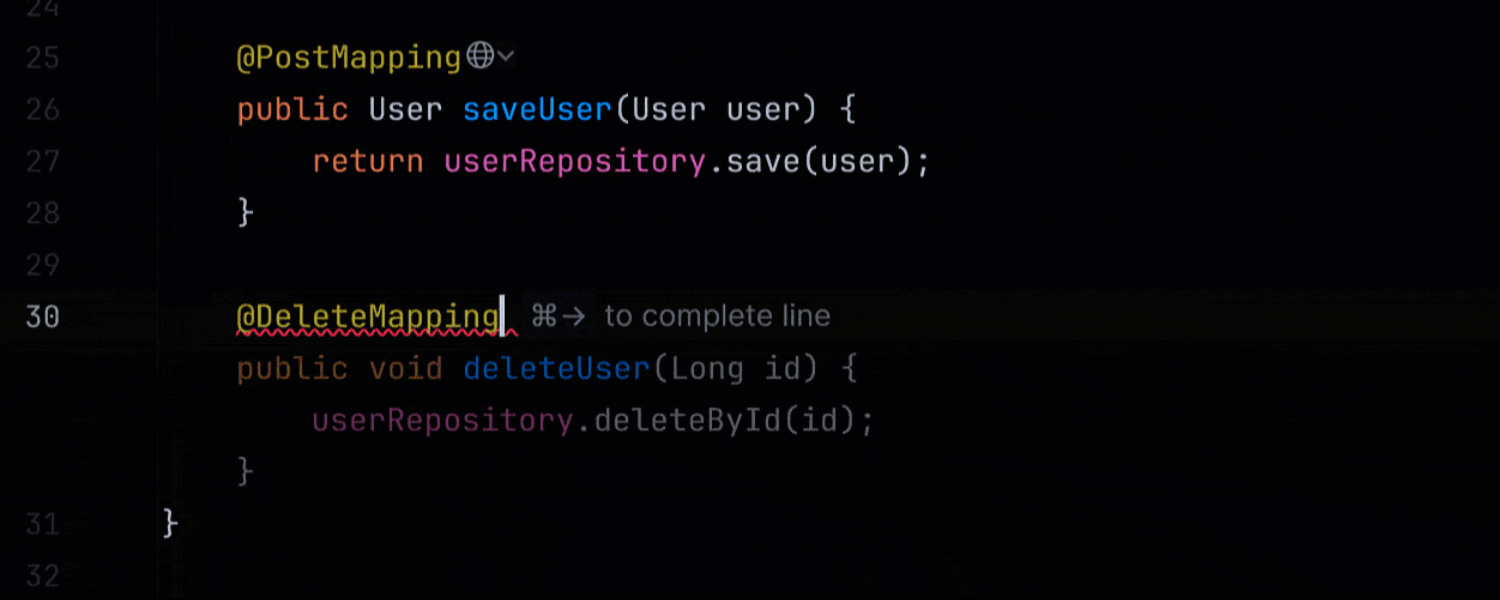
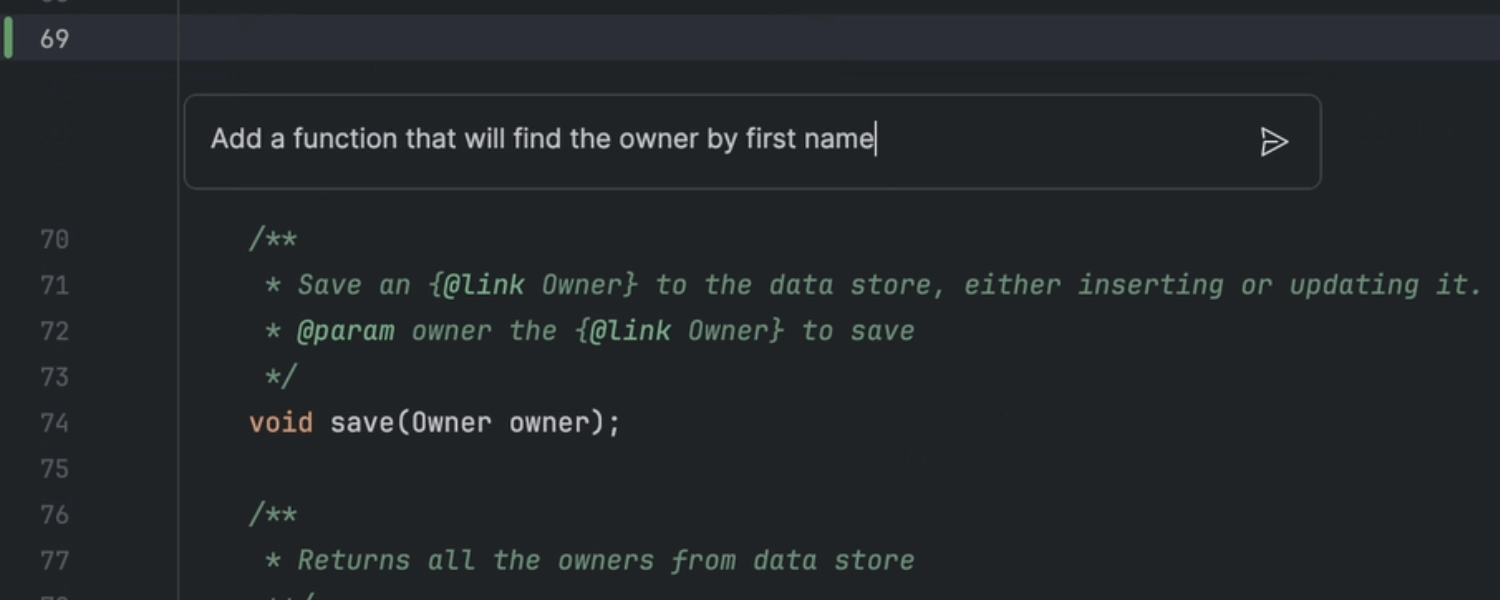
JetBrains AI Assistant 2024.2 introduces significant enhancements to cloud code completion, offering more accurate and faster suggestions. The UX has been reworked to better integrate AI code completion features into IDE workflows, with improvements like syntax highlighting in suggested code and incremental acceptance of code suggestions.
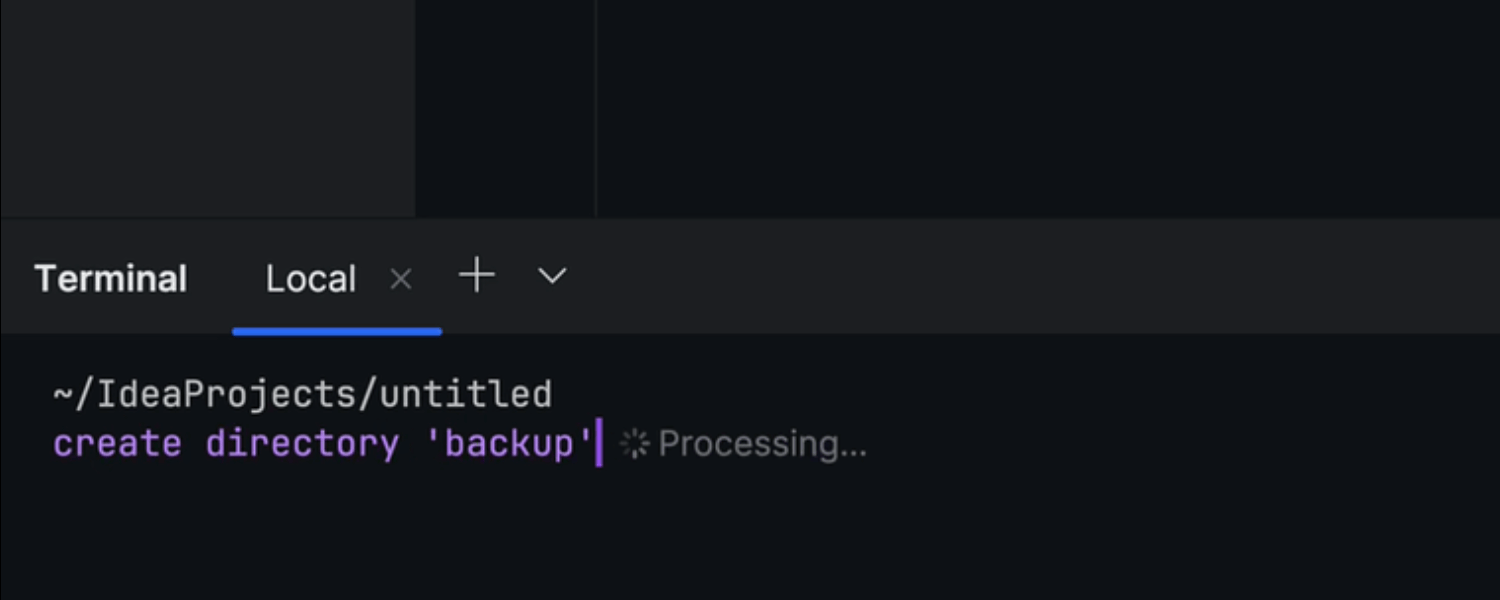
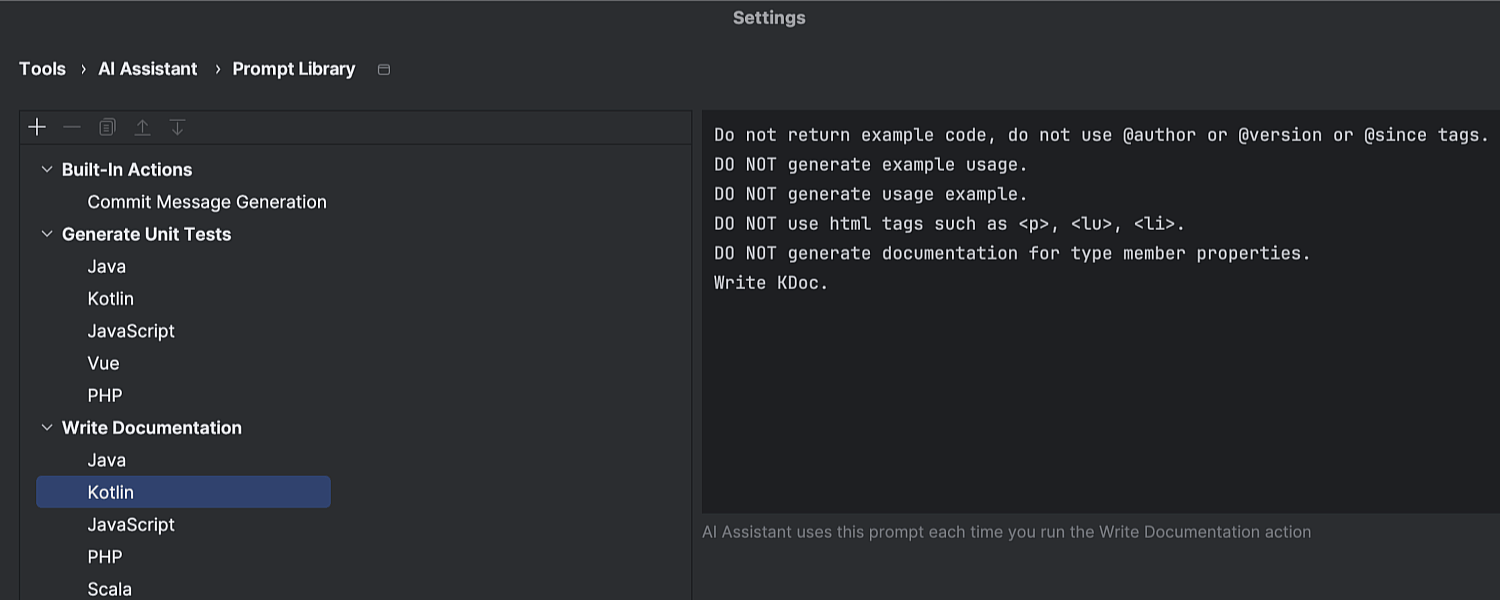
New features include AI integration in the Terminal tool window and AI-assisted VCS conflict resolution. Additionally, users can now customize prompts for documentation generation and unit test creation.
Learn about these and other enhancements in the blog post.
Java and Kotlin
Enhanced log management
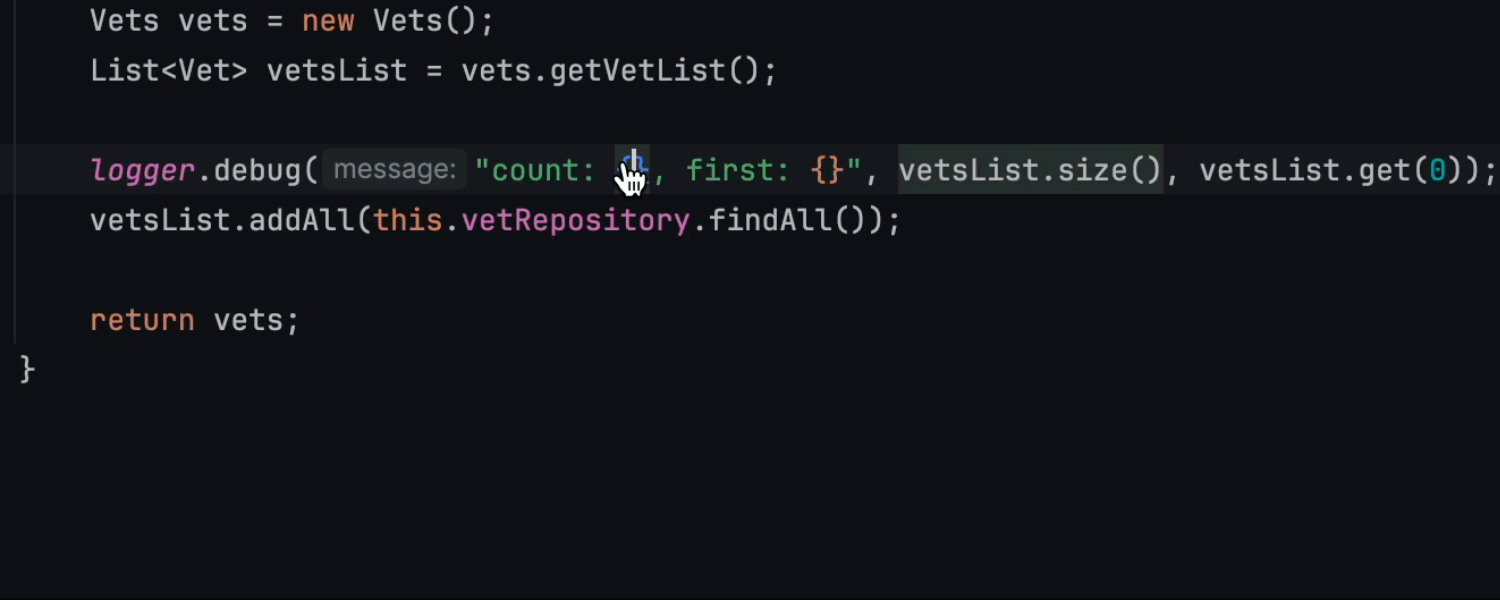
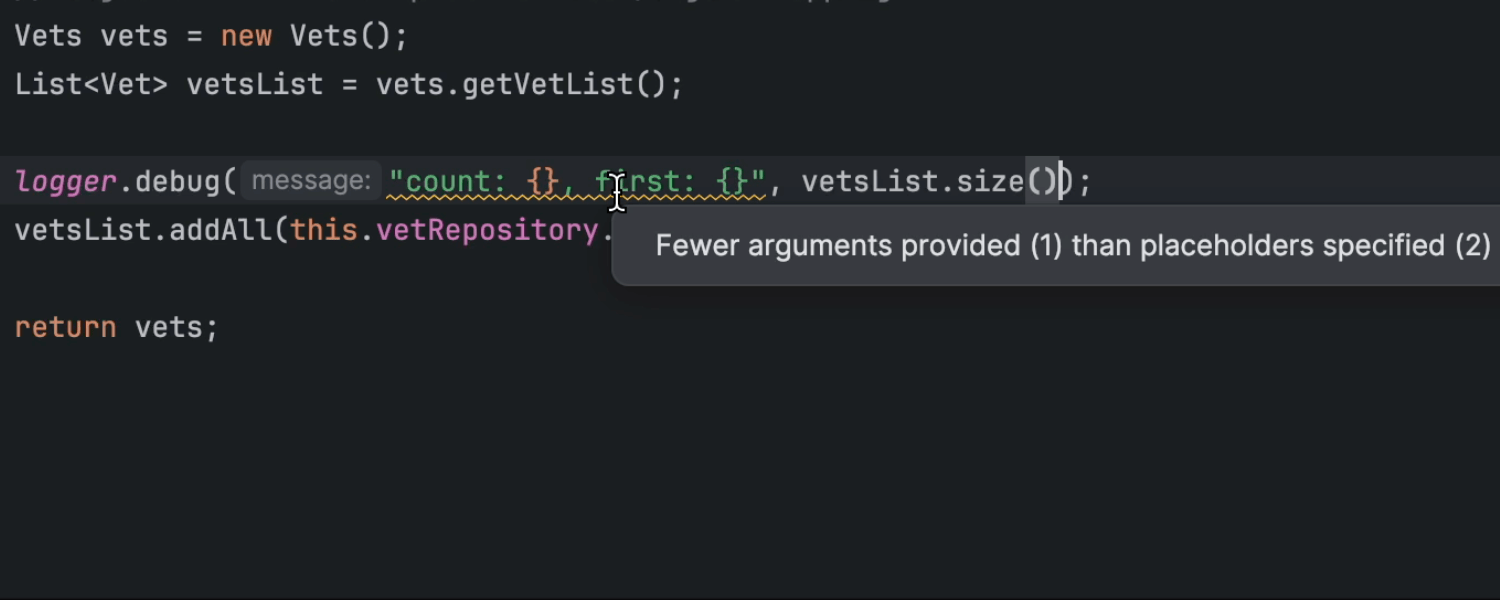
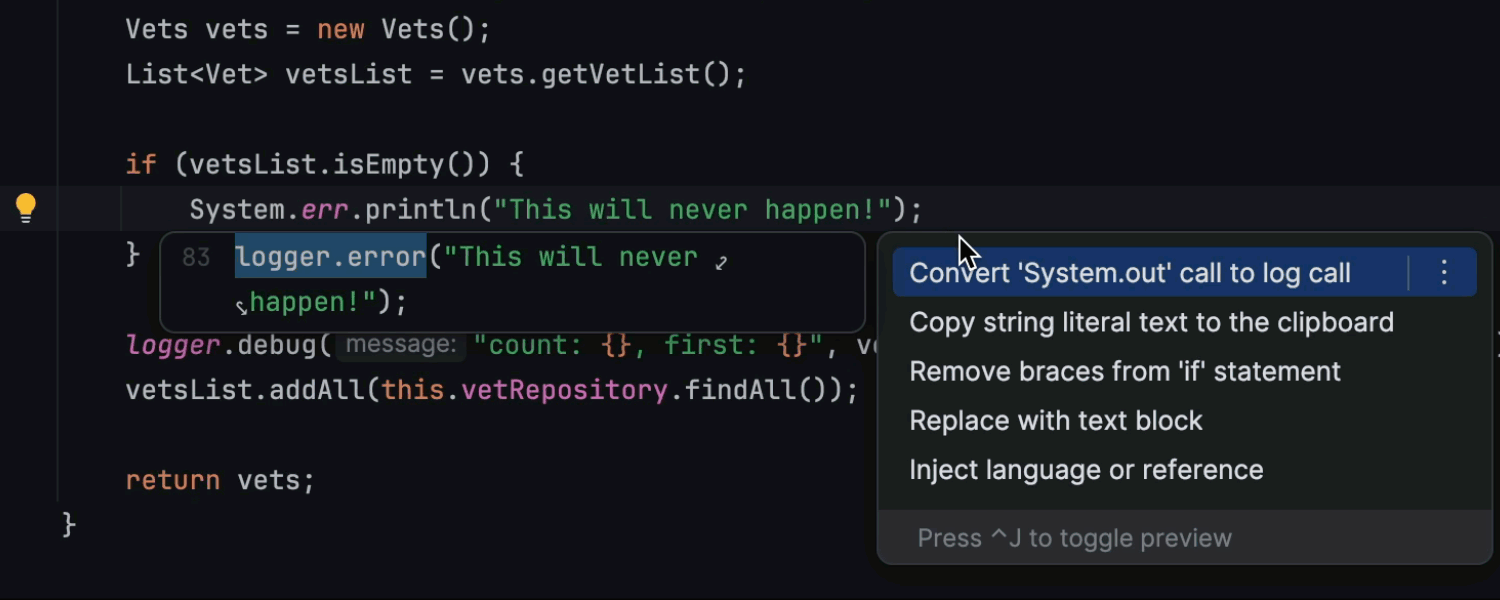
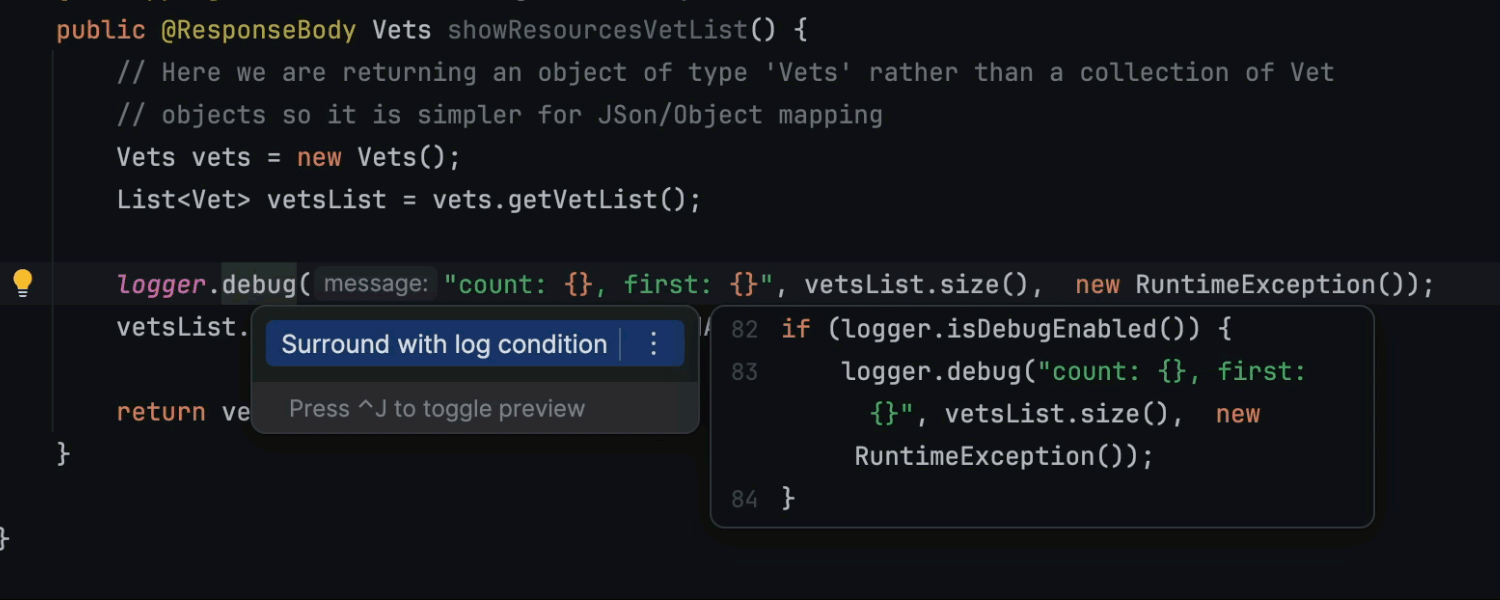
IntelliJ IDEA 2024.2 introduces enhanced log management for Java and Kotlin. New
features include highlighting for string literals and argument resolution, which
allows you to navigate seamlessly from placeholders to corresponding arguments.
Updated inspections now better handle a mismatched number of logger parameters,
suggest converting System.out.println statements to logger calls,
and offer a quick-fix to add guards for logger calls.
Learn more.
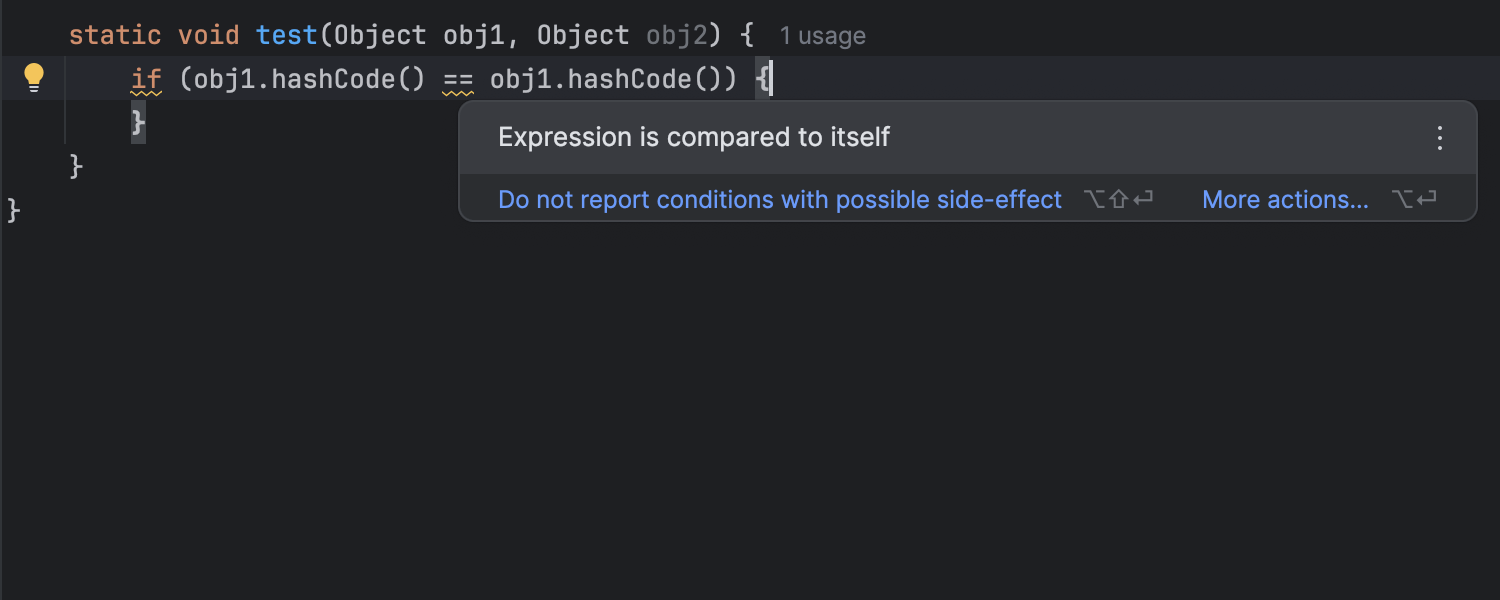
New Expression is compared to itself inspection for Java
A new inspection reports cases where an expression is being compared to itself instead of another. While such comparisons can occasionally be intentional, they are usually the result of an oversight. This inspection helps you identify and address these potentially unintended comparisons, improving code accuracy and reliability.
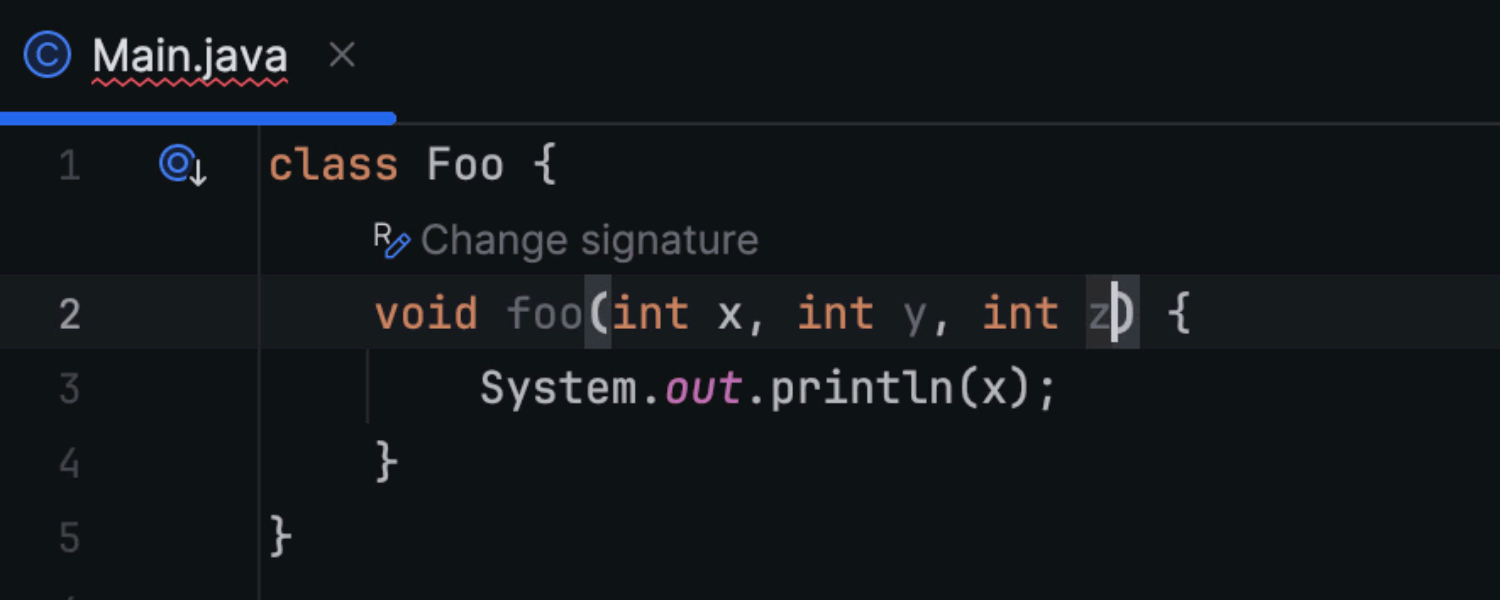
Change Signature refactoring inlay hint for Java
To make the Change Signature refactoring more accessible and intuitive, we've added a new inlay hint that appears near the modified code element. When you click on it and confirm the change, the IDE automatically updates all relevant method references throughout the codebase. This ensures consistency and reduces the risk of errors, streamlining your refactoring process.
Scala
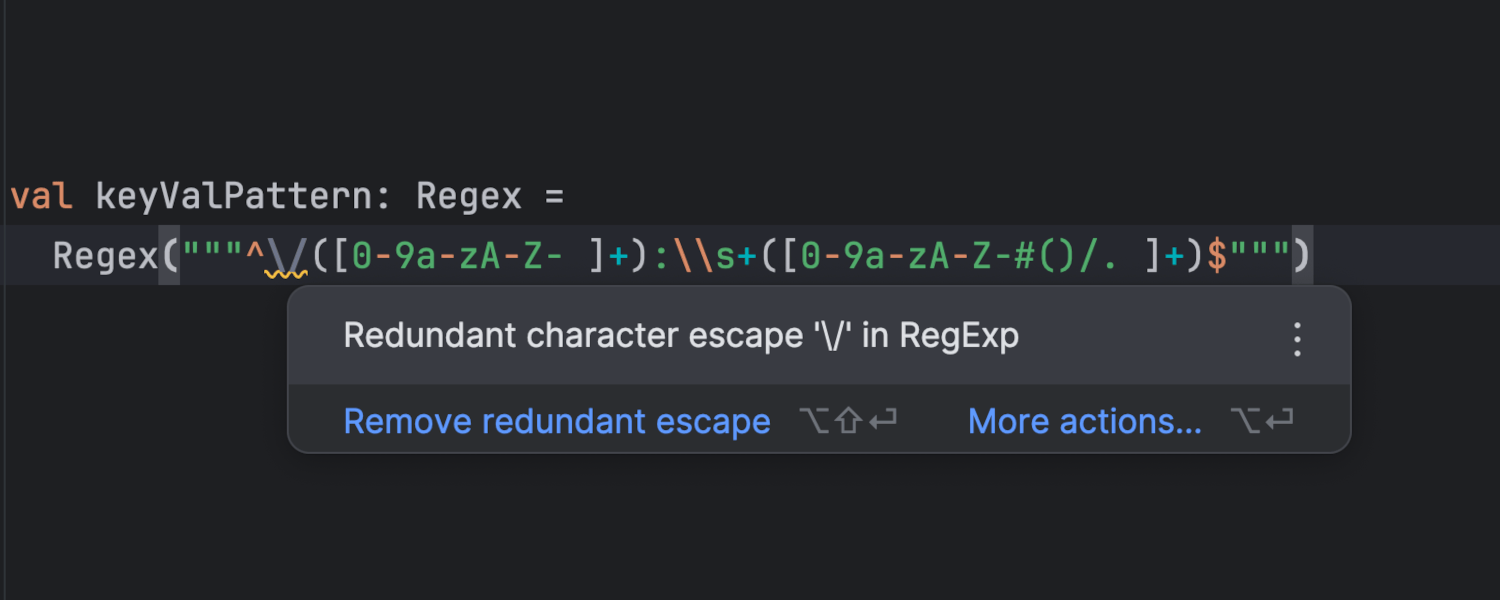
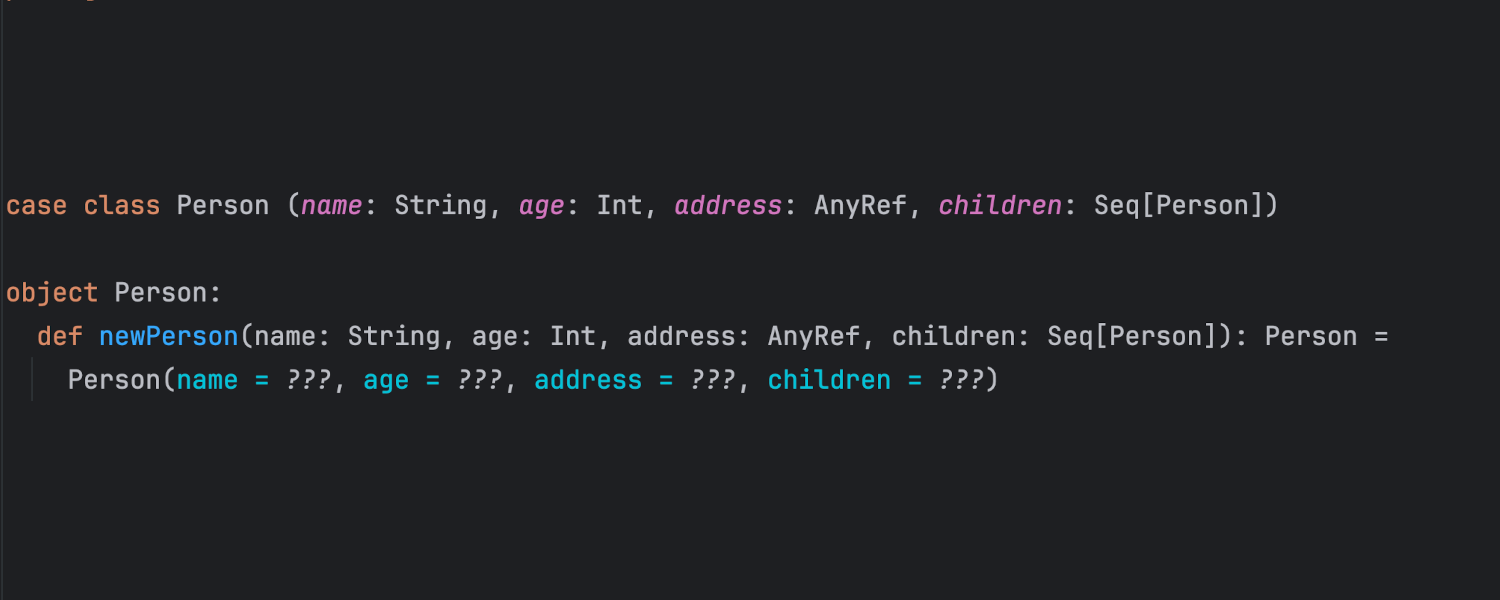
Better code highlighting for Scala
IntelliJ IDEA 2024.2 includes several improvements to error and syntax highlighting.
It now highlights class fields defined in parameter clauses as fields instead of
parameters. Named arguments are now highlighted in a distinct color, making them
easier to identify in your code. The regex syntax inside Regex("...")
is highlighted just as the regex syntax in "...".r is. We fixed some
issues causing valid code to be highlighted in red after refactoring or because the
type of the symbol couldn't be resolved. In many cases, semantic highlighting is now
applied as you type. In addition, the IDE is now more responsive when you fix errors,
removing the red code right after the fix.
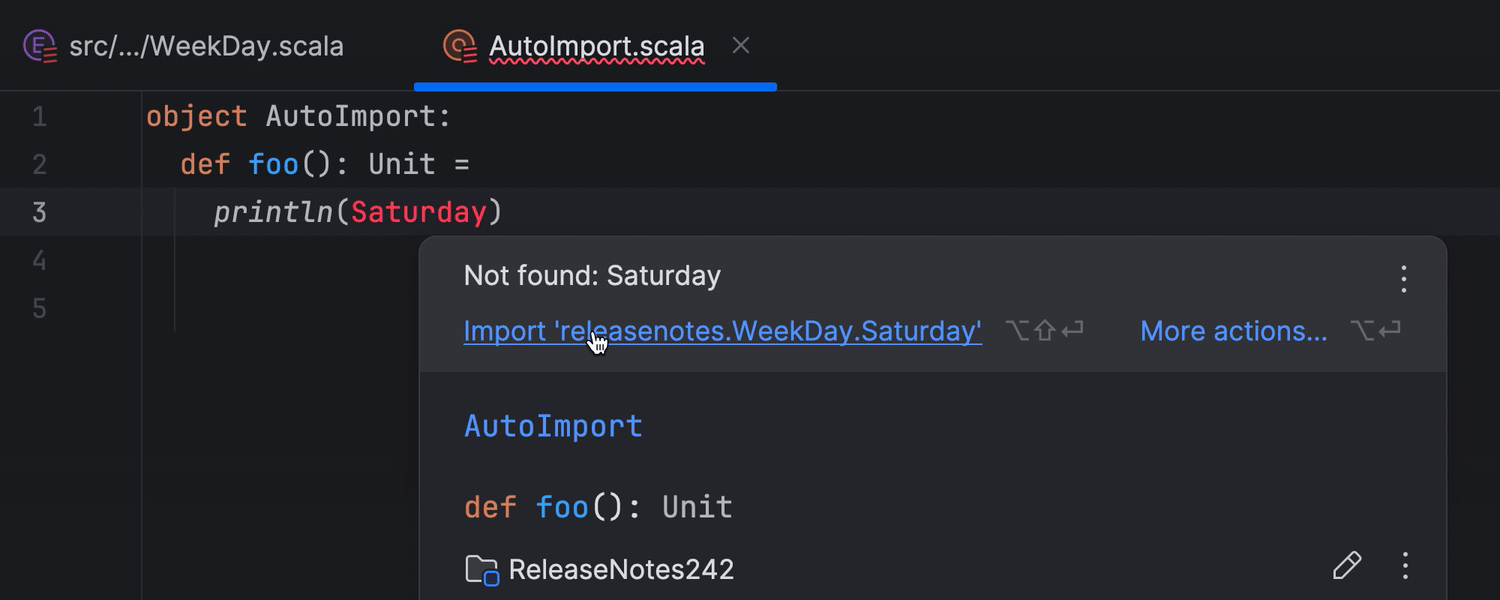
Better Scala 3 support
The new release includes many improvements to Scala 3 support.
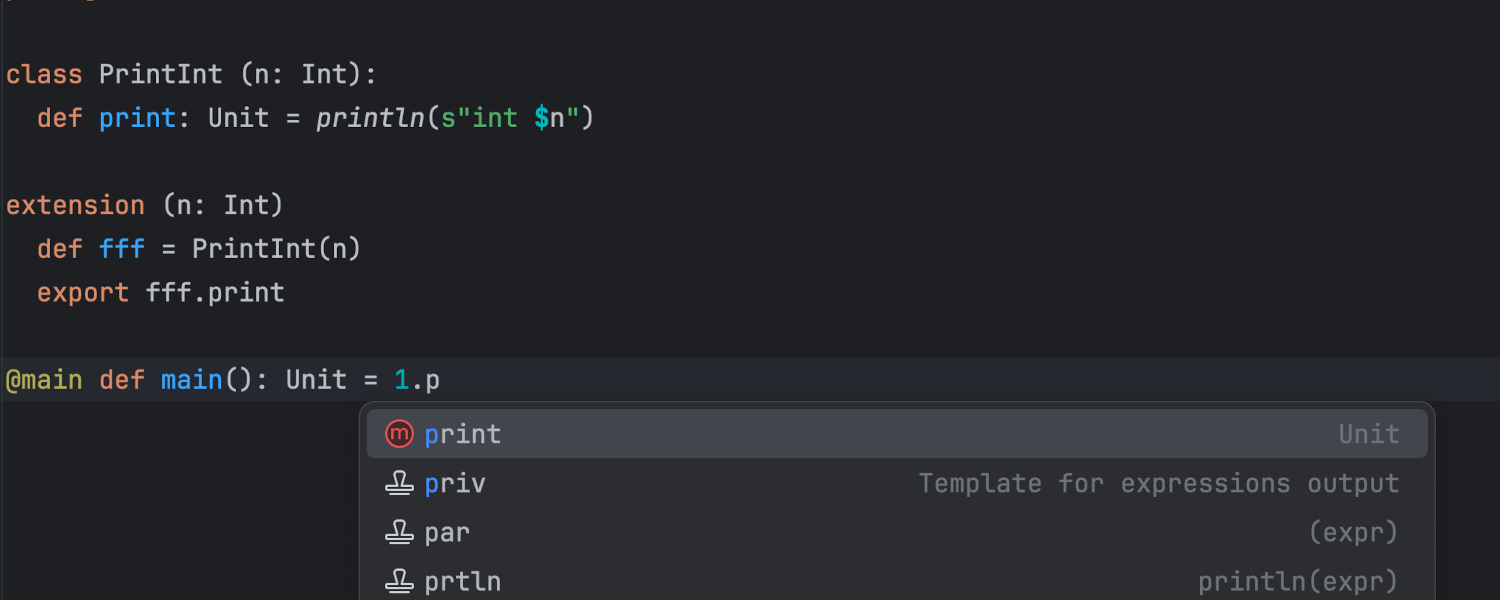
For-comprehensions are now always handled correctly when used together
with the fewer braces syntax. Support for export clauses and extension methods has
been improved. Additionally, the IDE now correctly handles constructor annotations,
and import suggestions include enum cases.
Better code completion
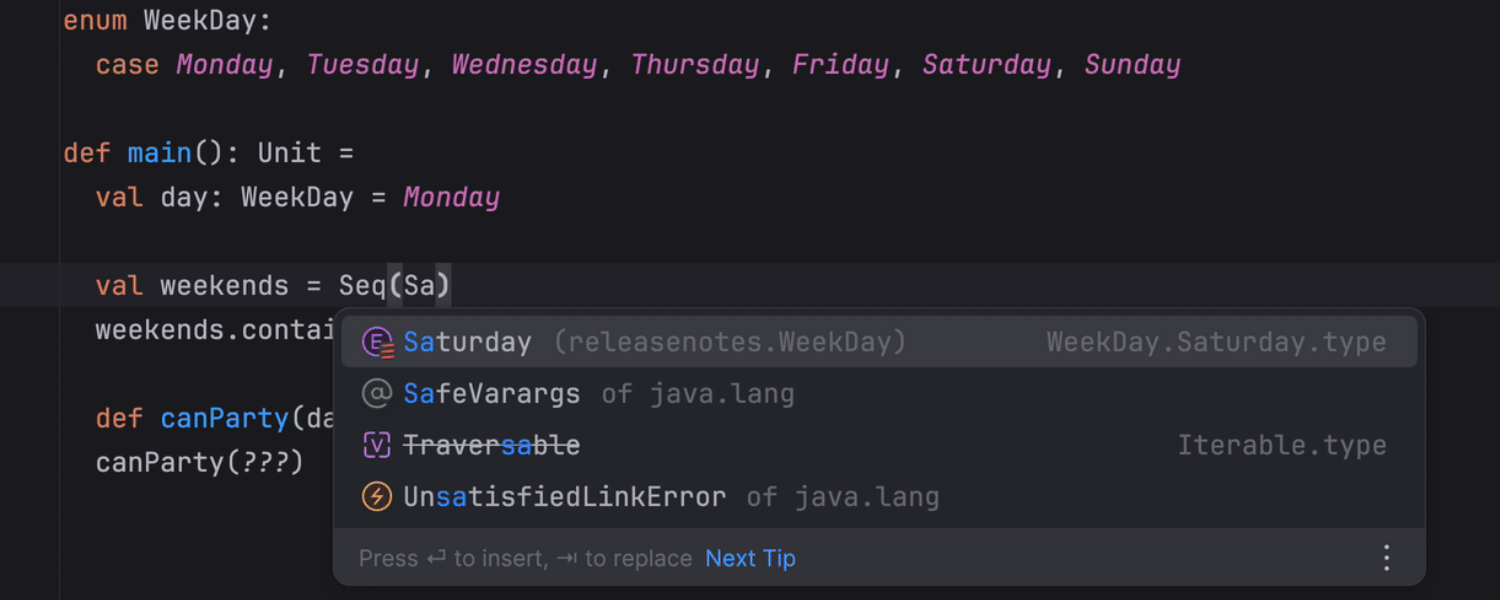
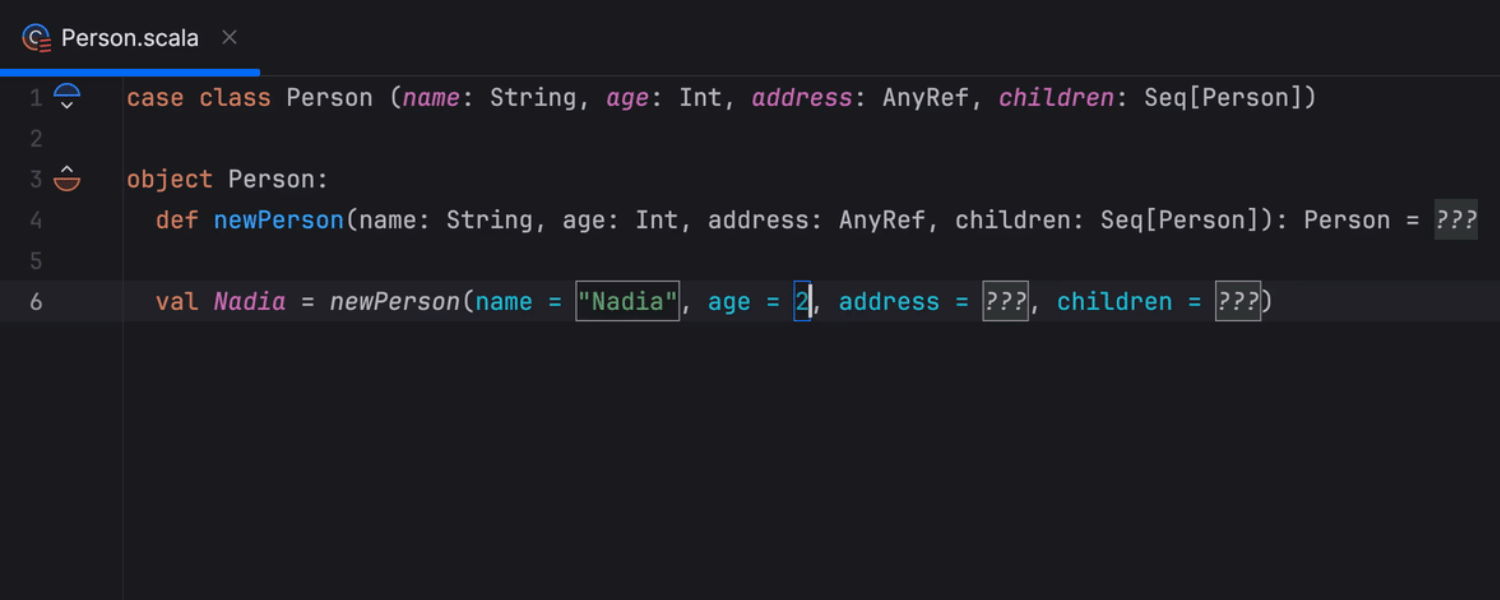
The IDE can now automatically fill out all named arguments of methods and autocomplete literal values of union types in Scala 3. Enum cases are now suggested whenever an enum type is expected. This feature works with Scala 3 enums and union types, Scala 2 ADTs and enumerations, and Java enums, simplifying your coding experience by providing more relevant suggestions.
Other improvements
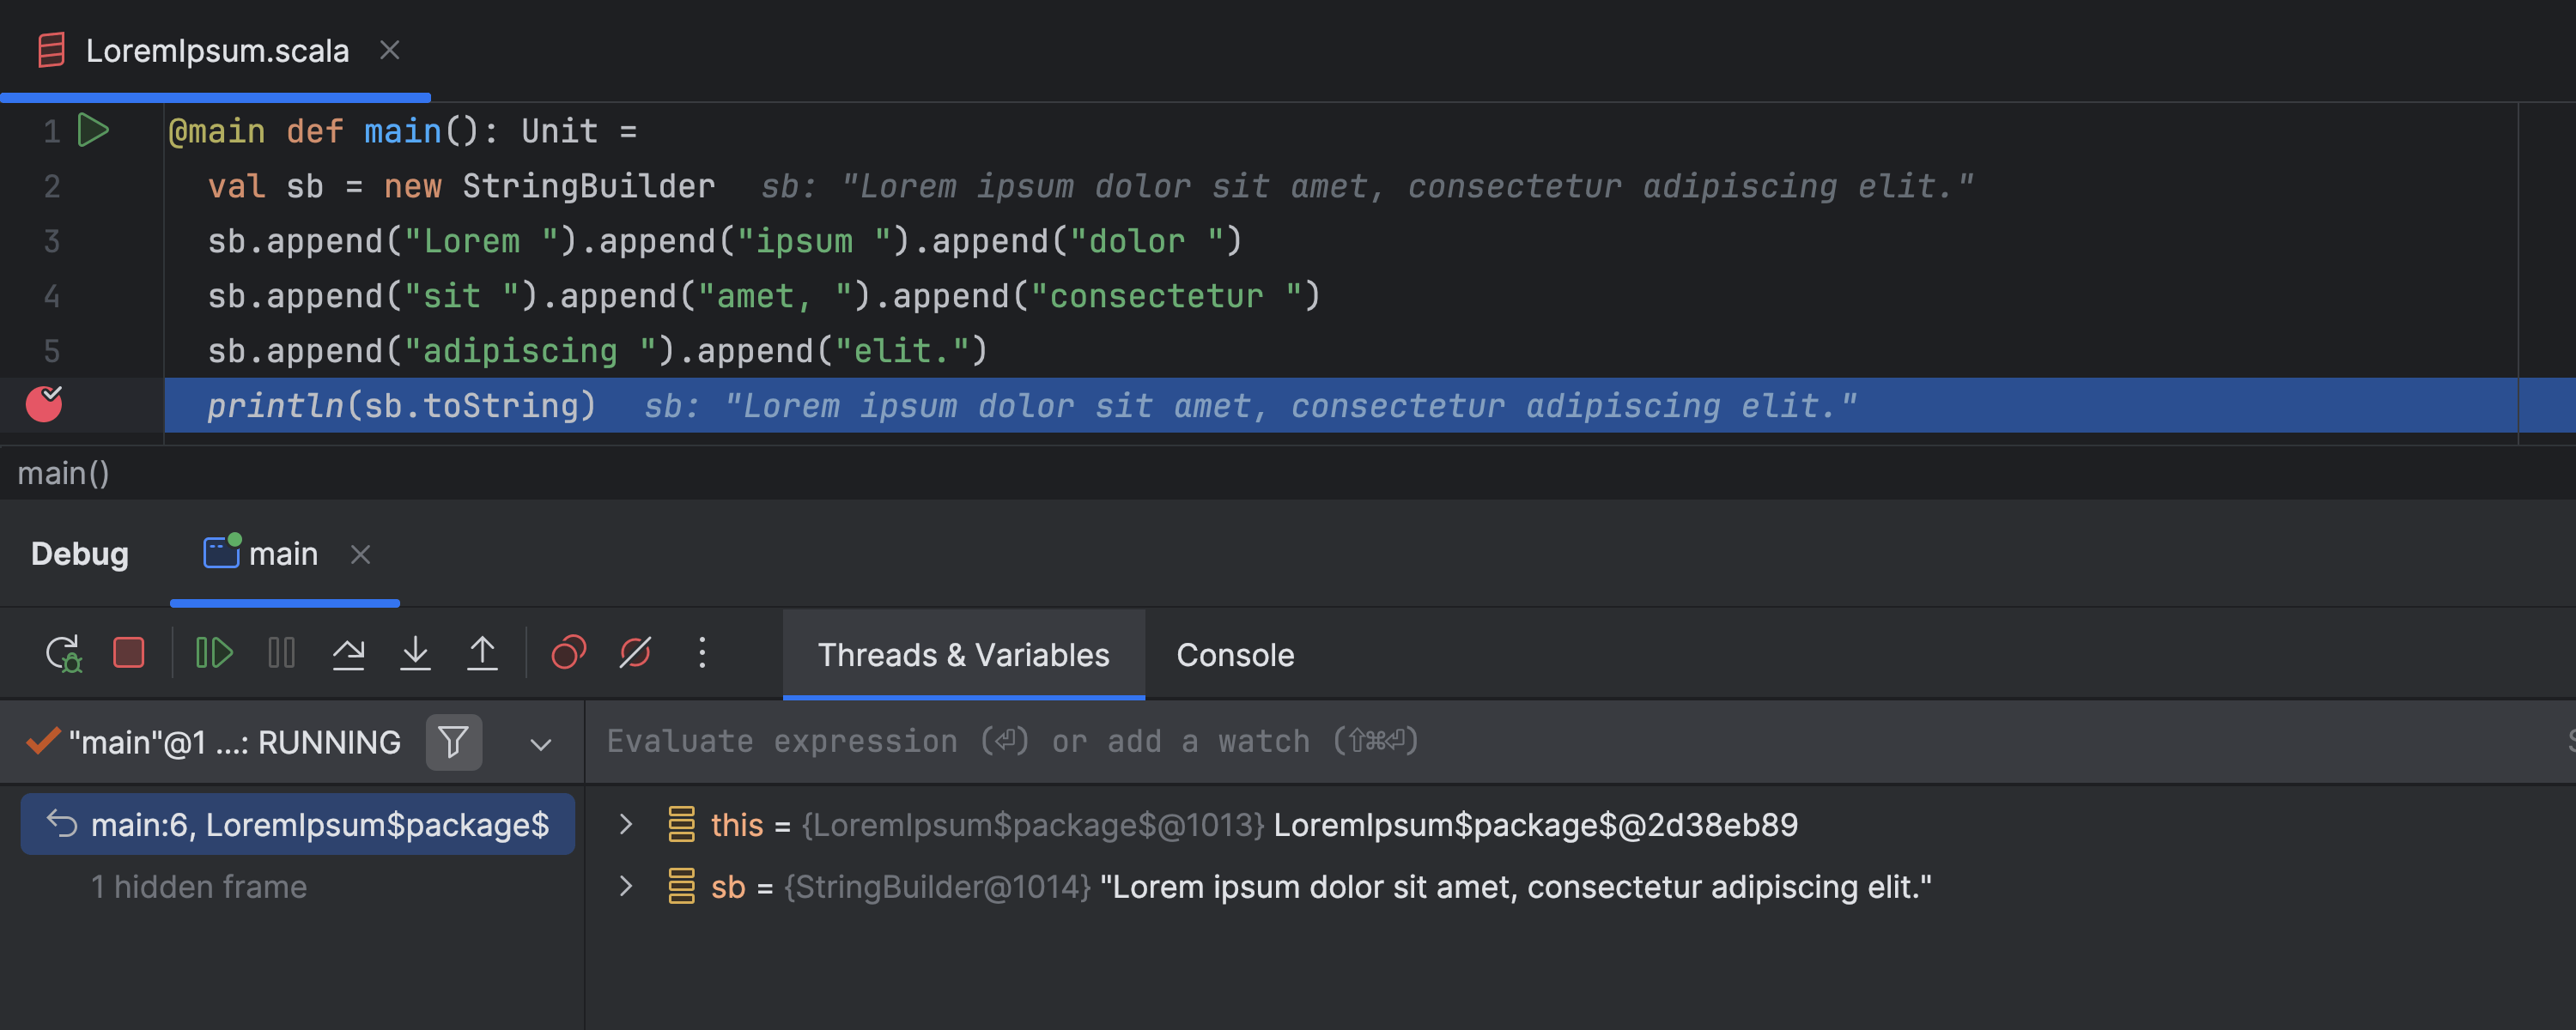
The contents of StringBuilder are now displayed as a string in the
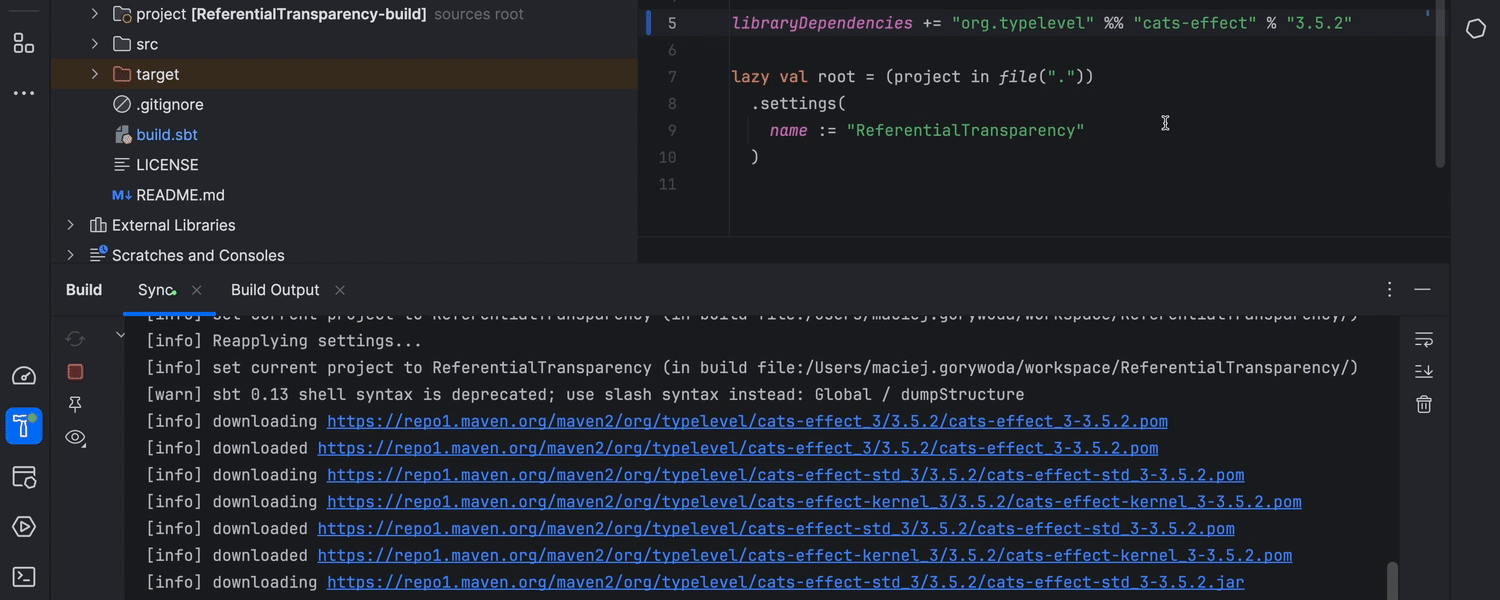
debugger. IntelliJ IDEA also offers onboarding tips for Scala. Library download
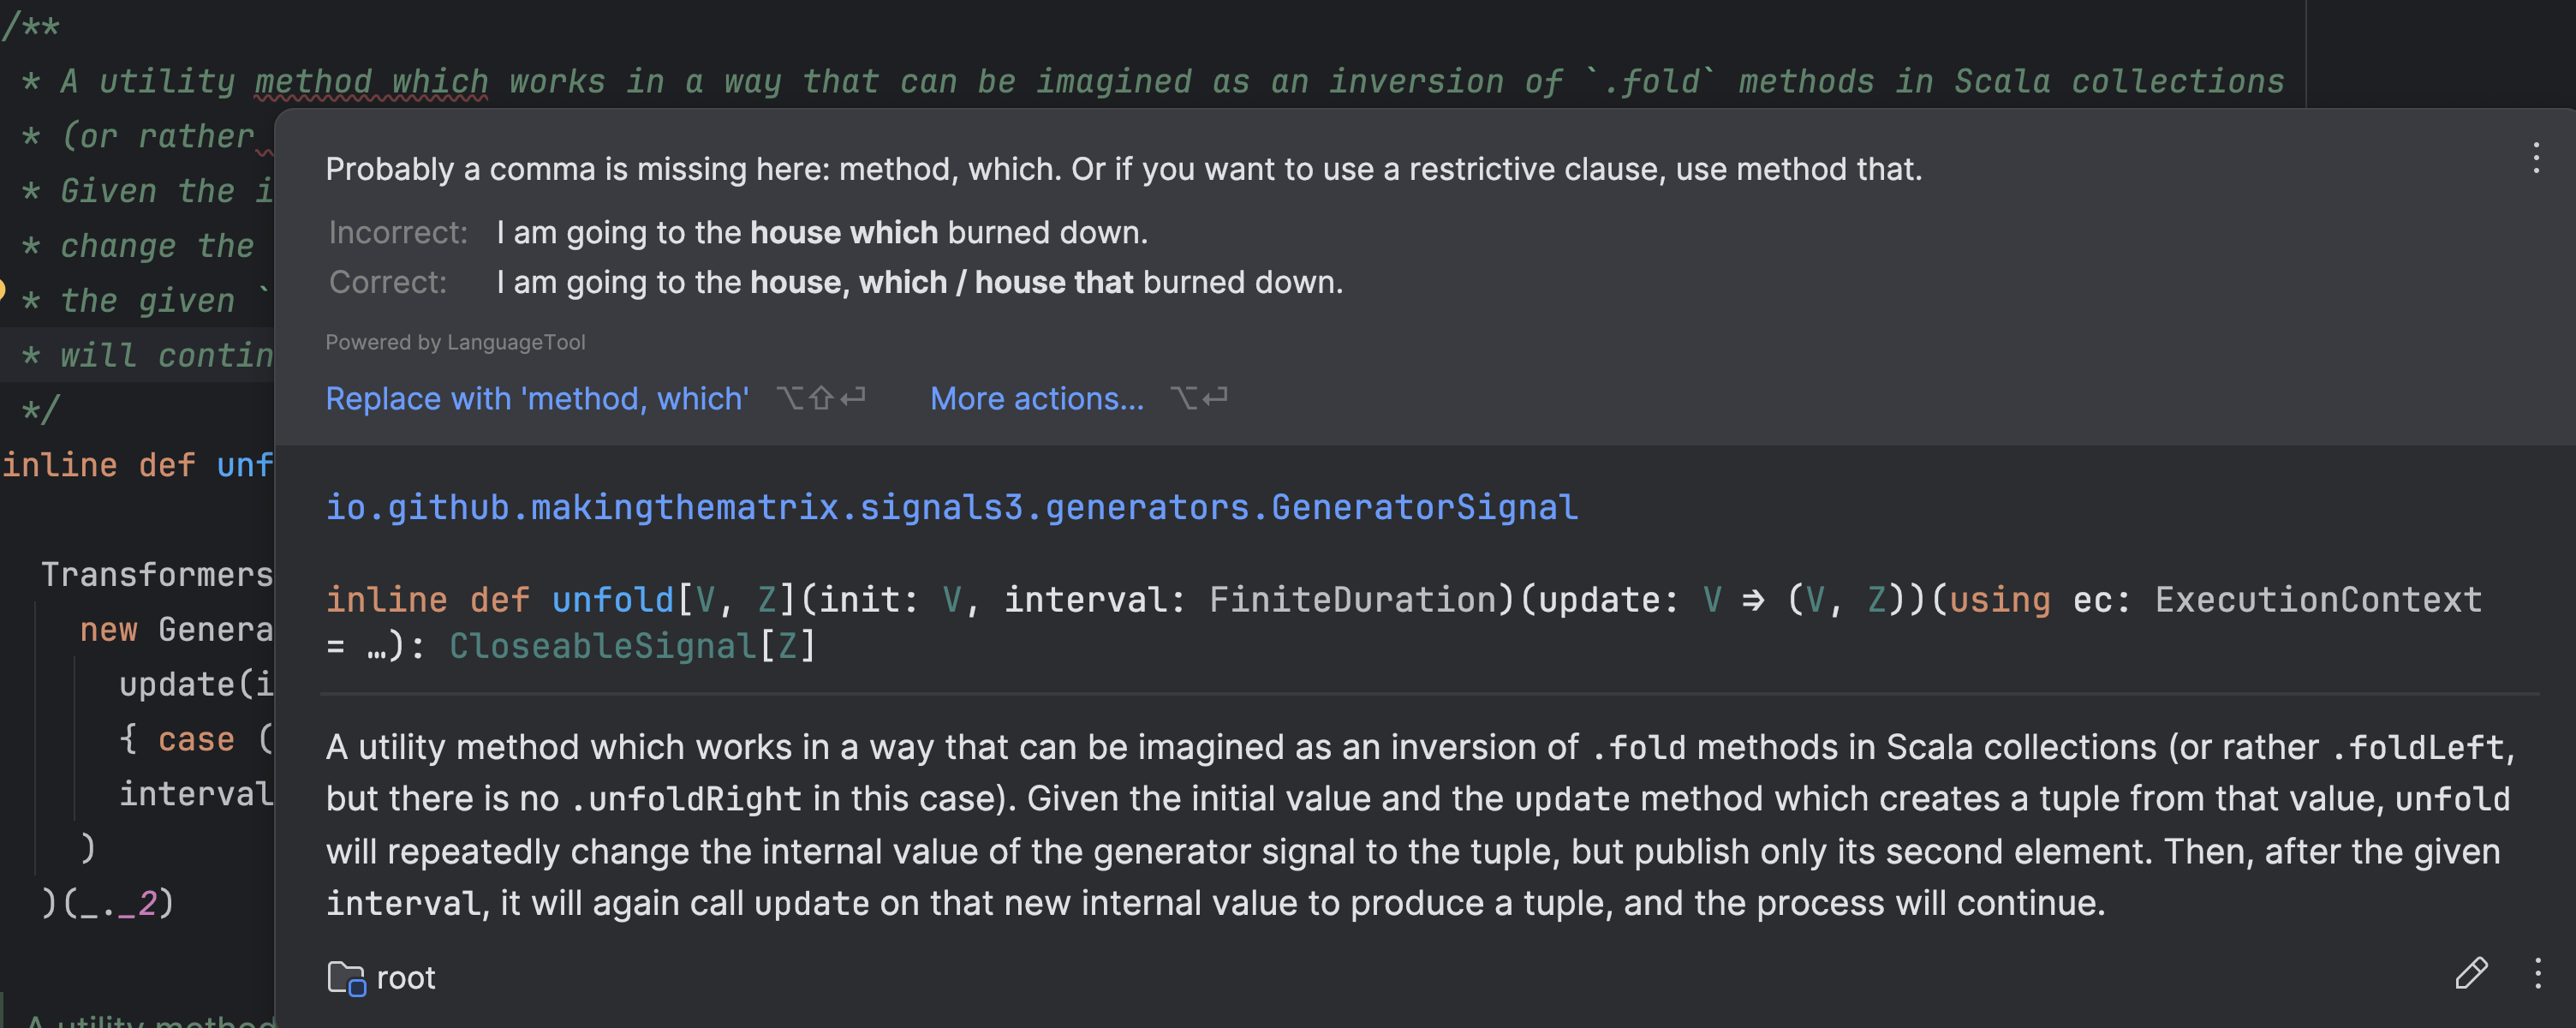
progress is now visible while you import sbt projects. Additionally, the Scala
support now includes the functionality of
Grazie, which provides advanced spelling
and grammar checks in Scala comments.
Improved compiler-based highlighting
We’ve enhanced the performance of compiler-based error highlighting. Outdated error highlighting information is no longer applied when the file has been modified. Additionally, IntelliJ IDEA now supports Scala compiler diagnostics, making them available as regular quick-fixes for easy application.
Code editor
Support for math syntax in Markdown files
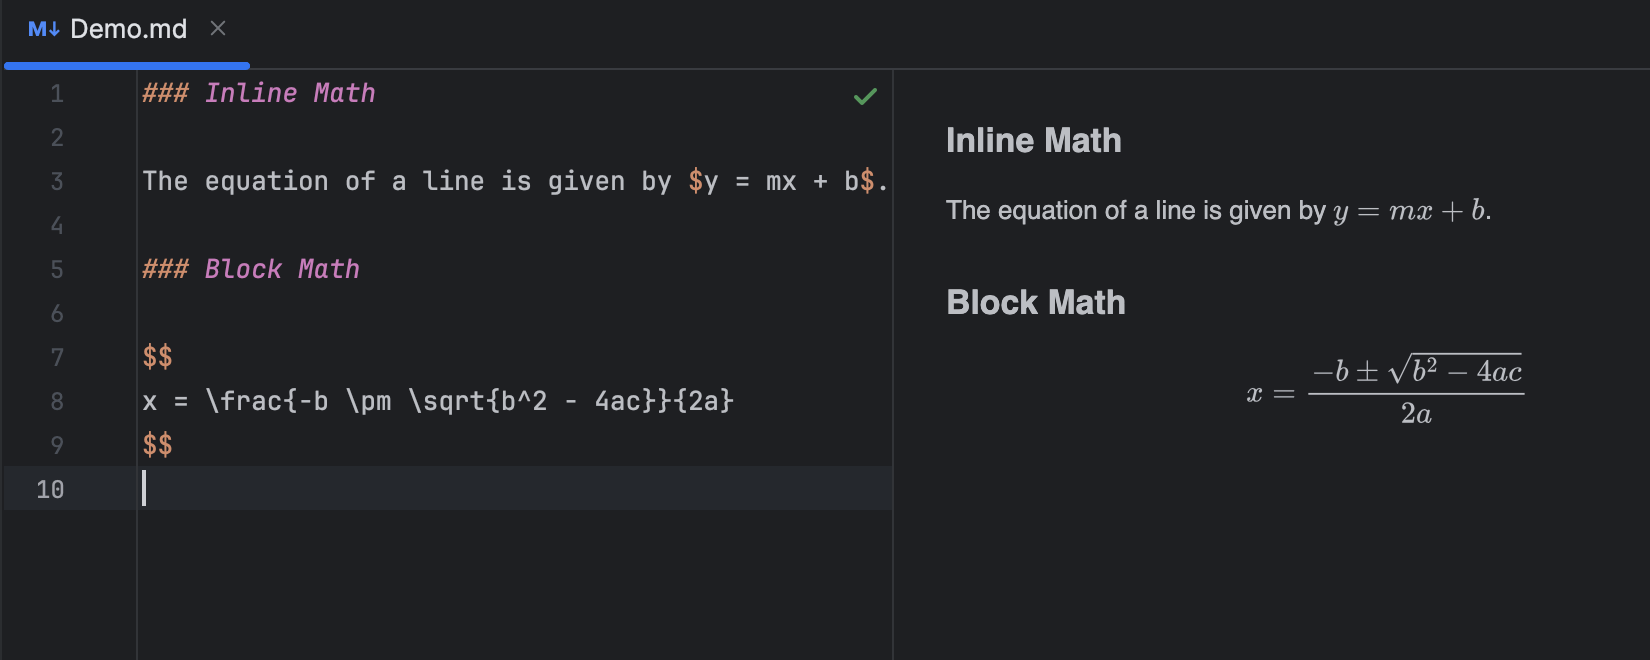
IntelliJ IDEA can now natively render mathematical expressions in Markdown files.
When working with Markdown, you can use $ to insert inline math
expressions and $$ for code blocks with math content.
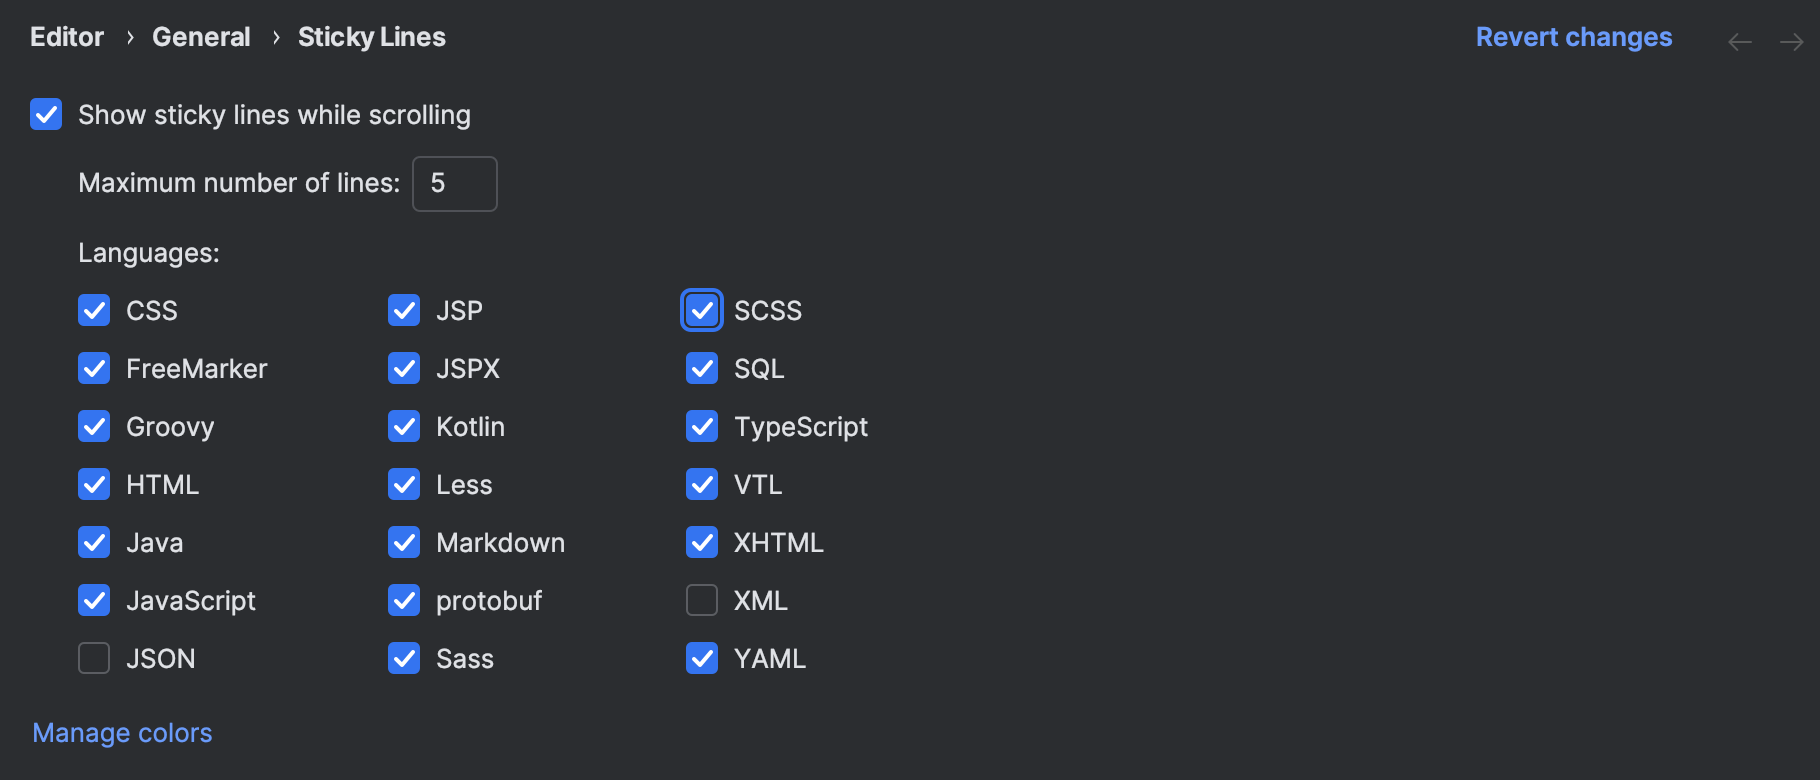
Language-aware sticky lines
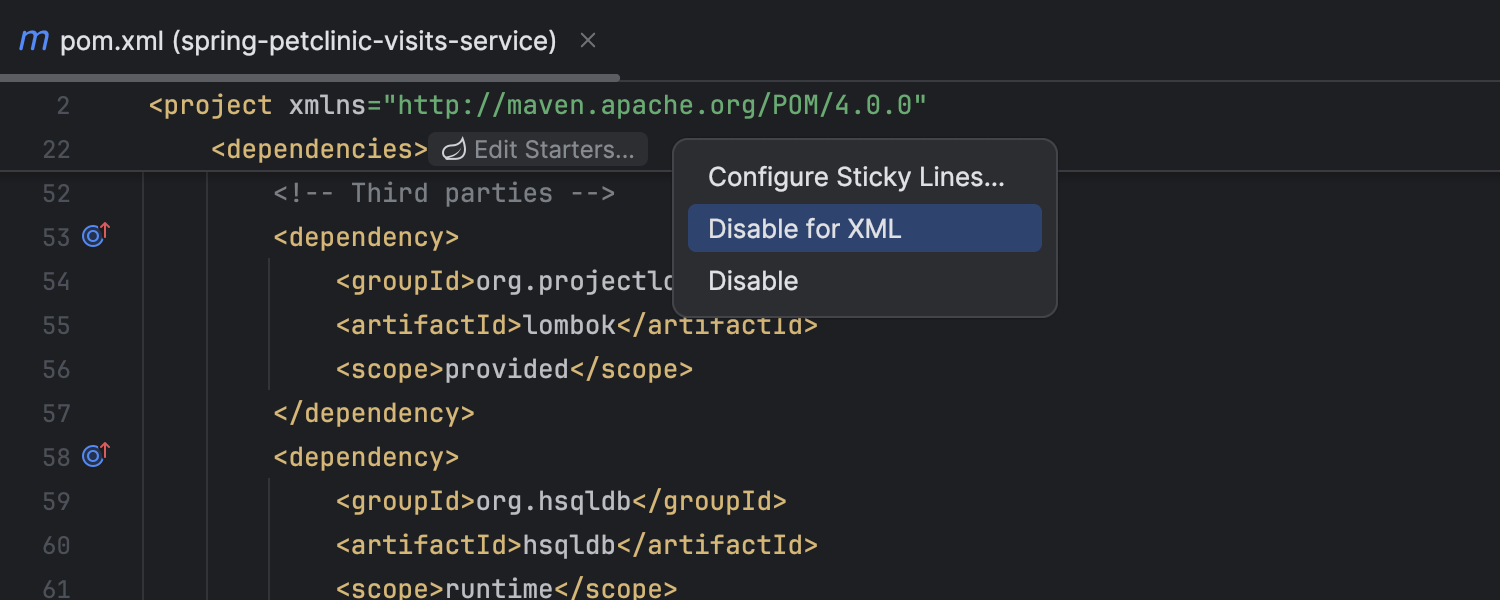
You can now choose the languages you want sticky lines to appear for. You can tailor the feature to your preferences either in Settings/Preferences | Editor | General | Sticky Lines or by calling the context menu with a right-click on a sticky line in the editor.
Profiler
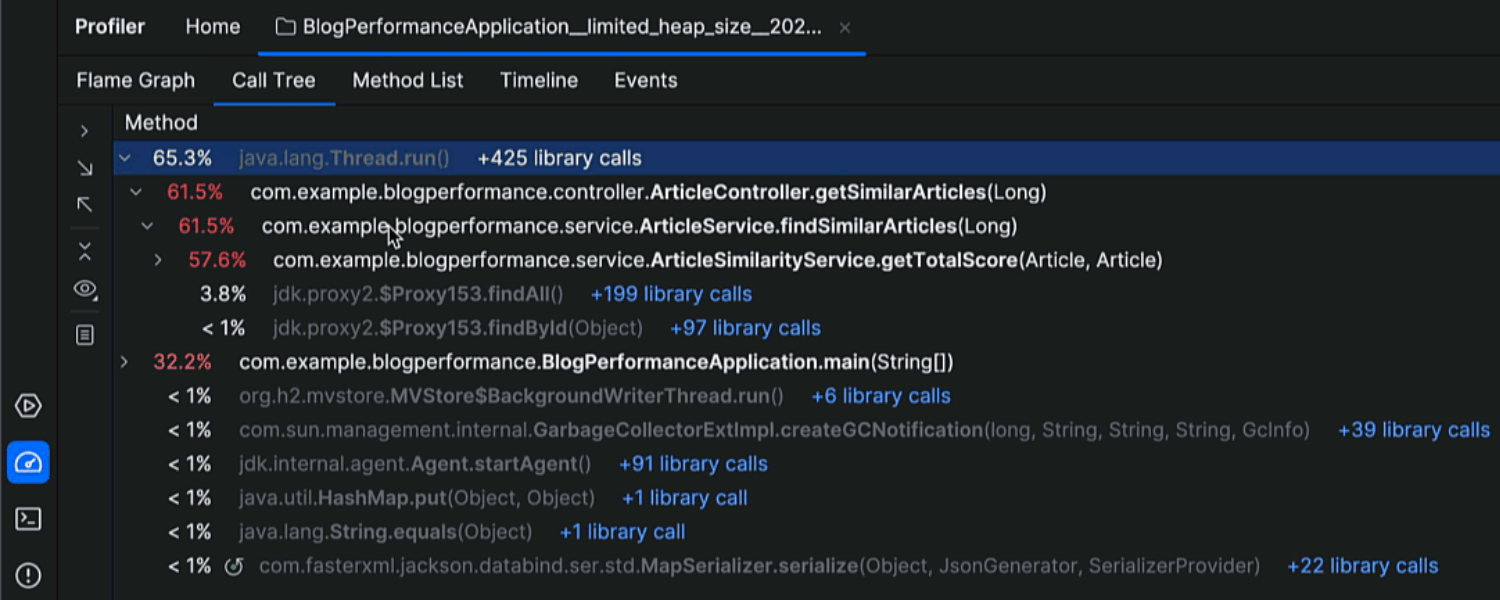
Focus on project methods in the profiler
Ultimate
IntelliJ IDEA’s built-in profiler has been upgraded to simplify investigating
performance bottlenecks. Now, IntelliJ IDEA puts more emphasis on your code by fading
out and collapsing library calls in the profiler. This ensures that you get data
focused on the calls in your project that most affect application performance,
filtering out methods that don’t require your attention. If you need a detailed
view of library calls, you can expand the hidden calls to see the entire call
sequence and corresponding execution times. Click on the hyperlink next to a call
or the + icon to explore further.
Run/Debug
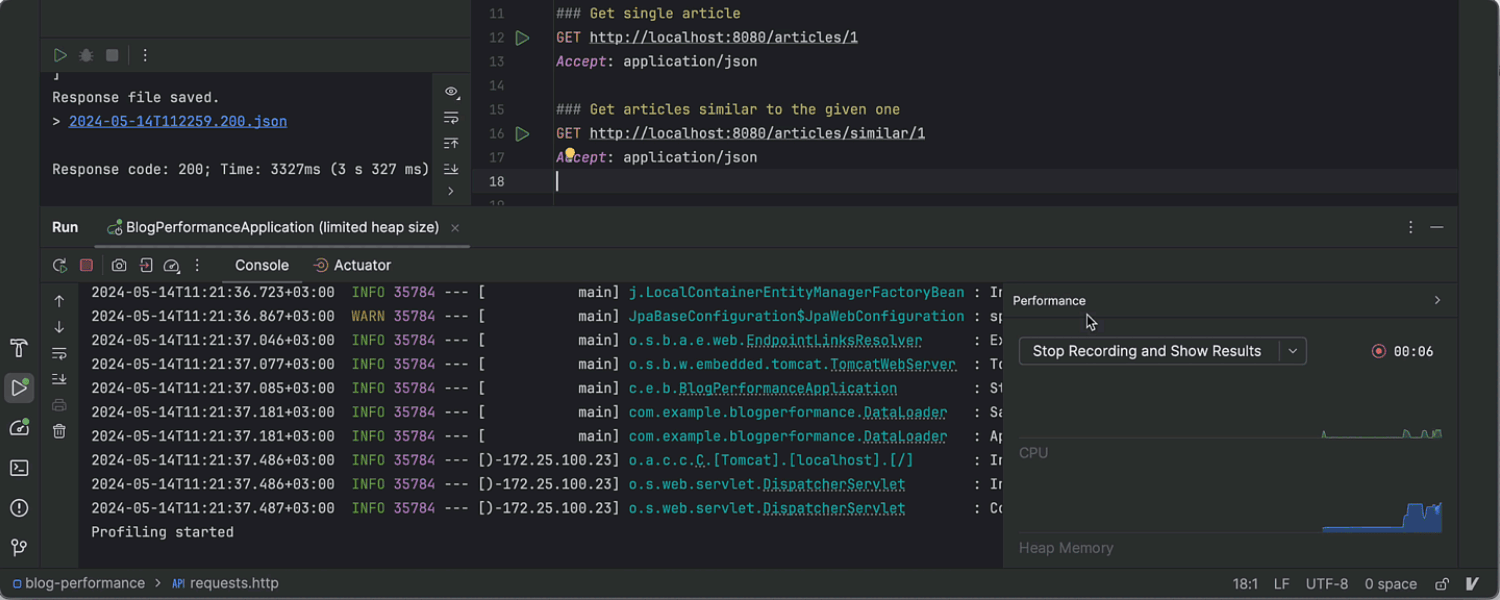
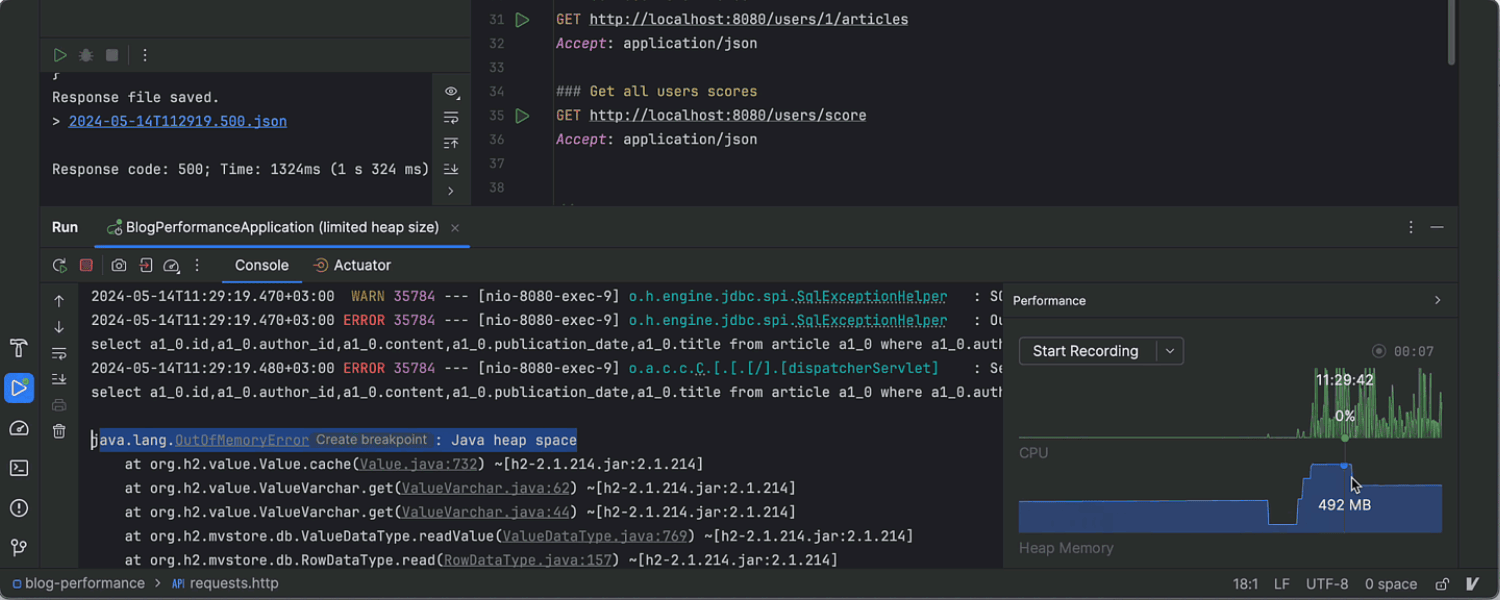
Performance charts in the Run tool window
To make performance analysis faster and more efficient, we've implemented the new Performance tab in the Run tool window. It provides real-time CPU and memory charts and allows you to pinpoint performance bottlenecks by capturing your code’s execution time and viewing it directly in the editor. Additionally, you can capture memory snapshots to examine objects and identify the root causes of memory leaks.
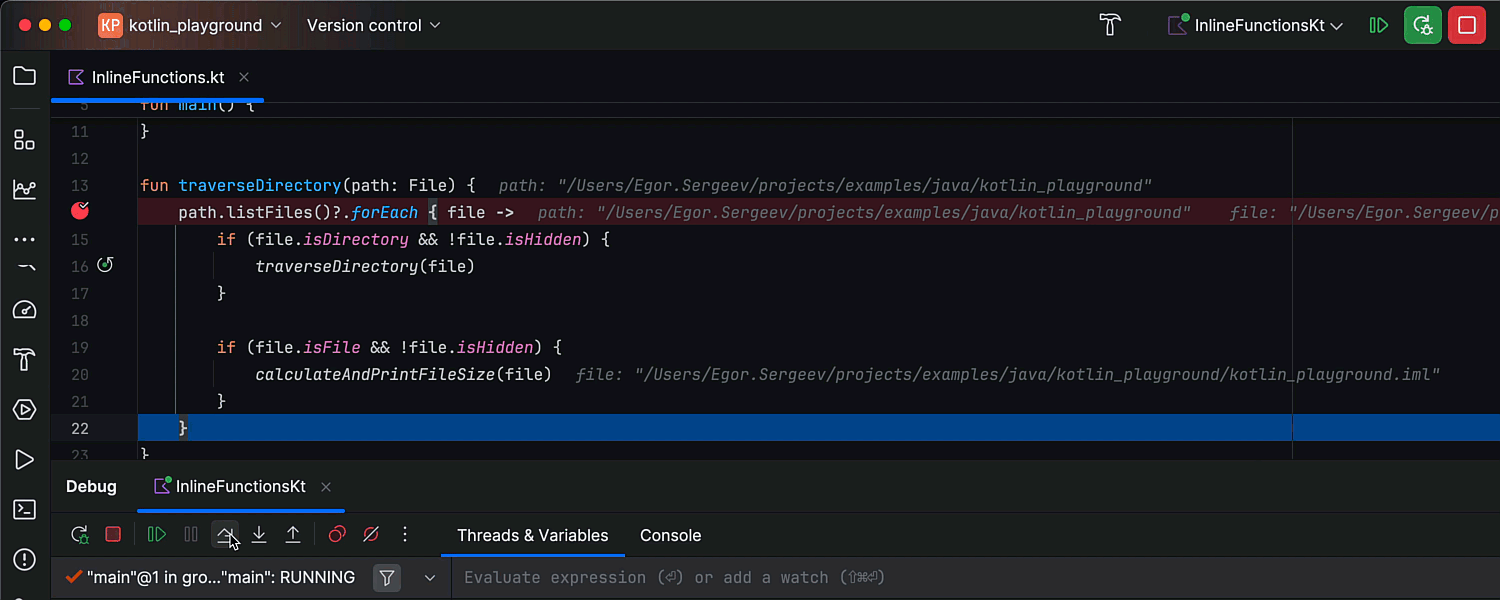
Enhanced Kotlin debugging experience
IntelliJ IDEA 2024.2 brings a significant improvement to the Kotlin debugging
experience. You can now use Step Over to iterate over forEach
loops and get into inline function lambdas without skipping important code. You no
longer need to remember to use Step Into for inline functions, which helps
ensure you don’t miss critical parts of your code. You can now step through
forEach, let, and filter inline functions
just as you would step through regular loops and conditions.
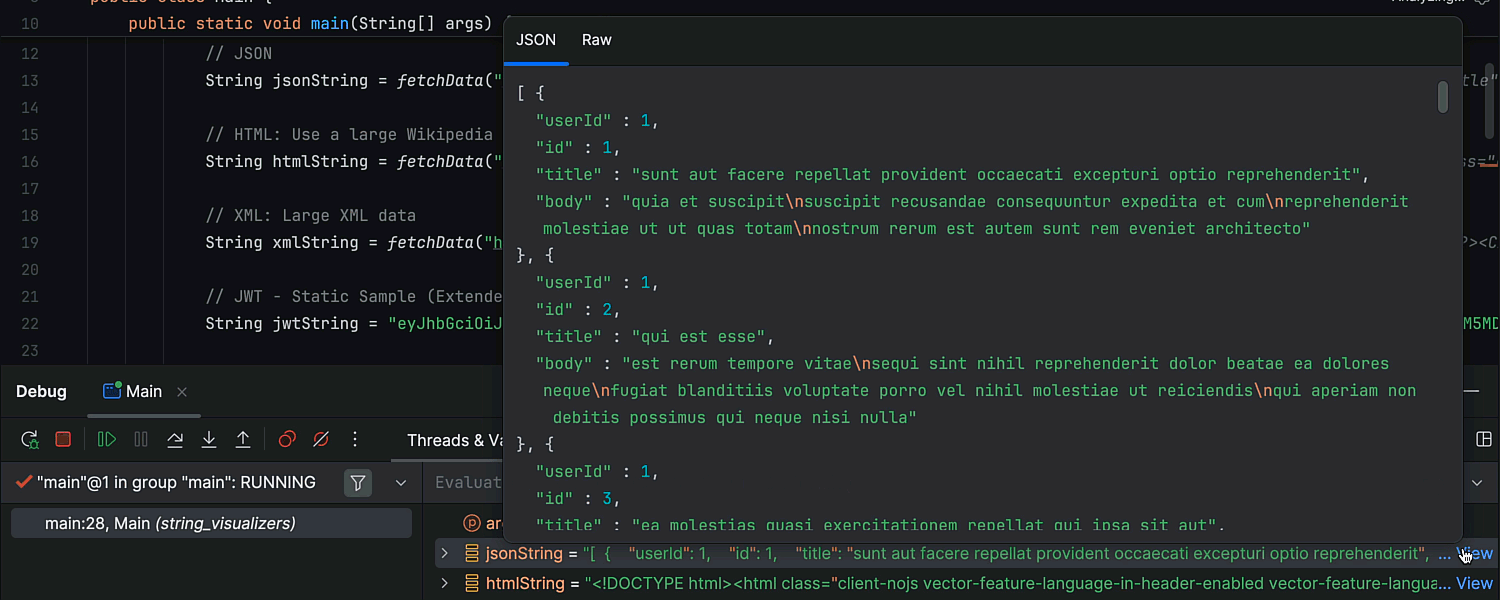
String variable visualizers for JSON, XML, and other formats
Debugging and browsing long string variables with complex data formats is now much easier. The updated debugger offers properly formatted visualizations for string variables with strings encoded in JSON, XML, HTML, JWT, and URL. Simply click the View hyperlink next to a variable – the relevant visualizer is automatically chosen based on the contents of your variable.
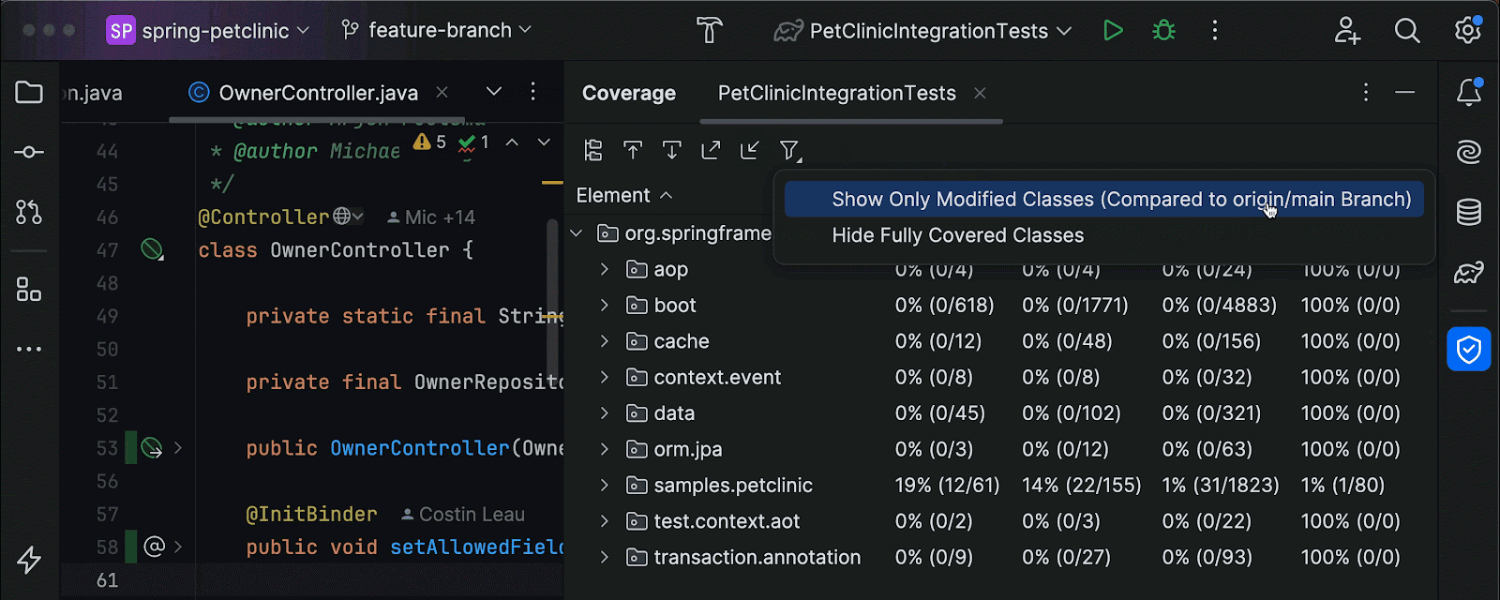
Test coverage for changes in the current feature branch
IntelliJ IDEA 2024.2 further improves your ability to quickly check and improve test coverage locally without needing to go through the slow process of using the CI/CD pipeline. The Coverage tool window now shows only the classes that have been changed in your current feature branch, allowing you to check the test coverage for your recent changes without browsing the entire project status. To review the entire project’s test coverage and see all classes, disable the Show Only Modified Classes option.
Build tools
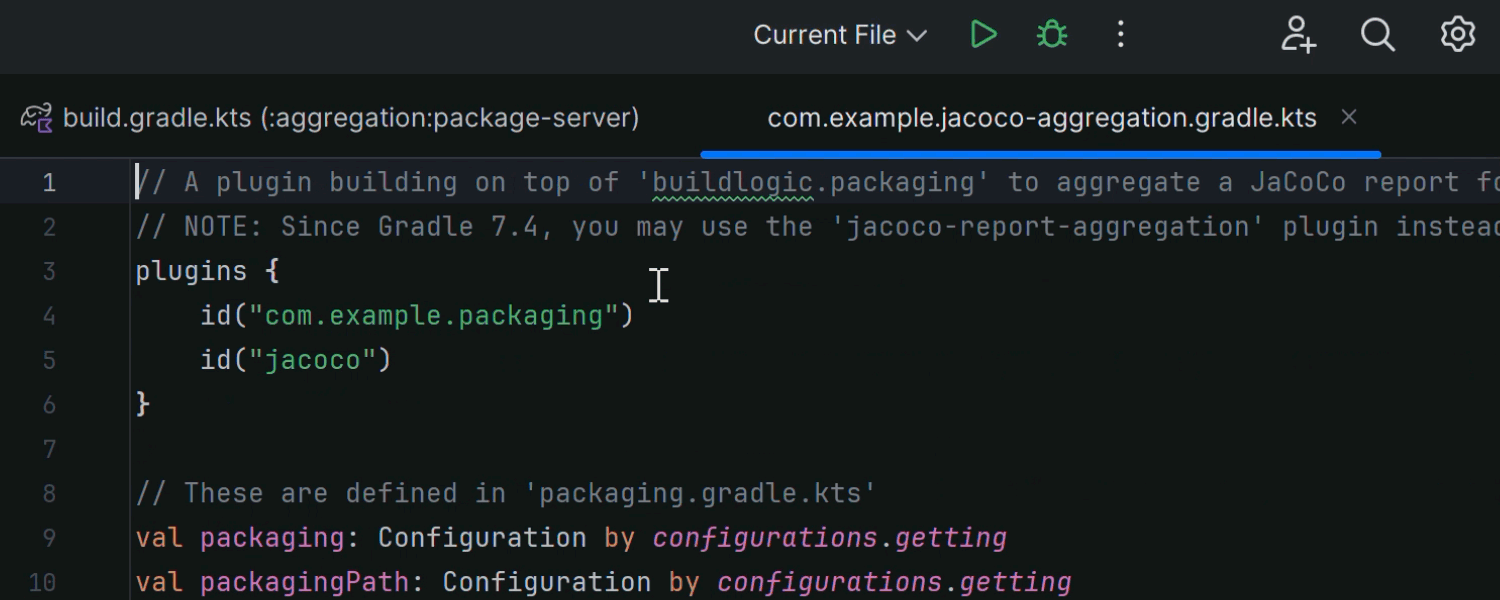
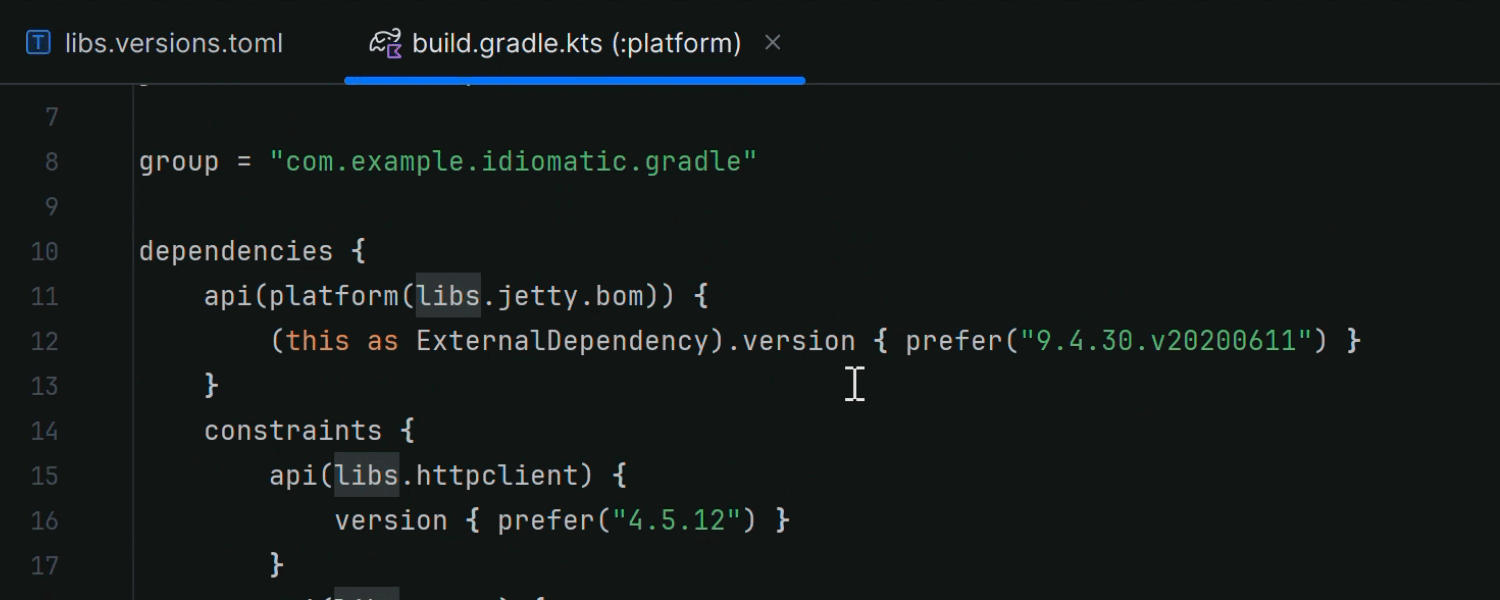
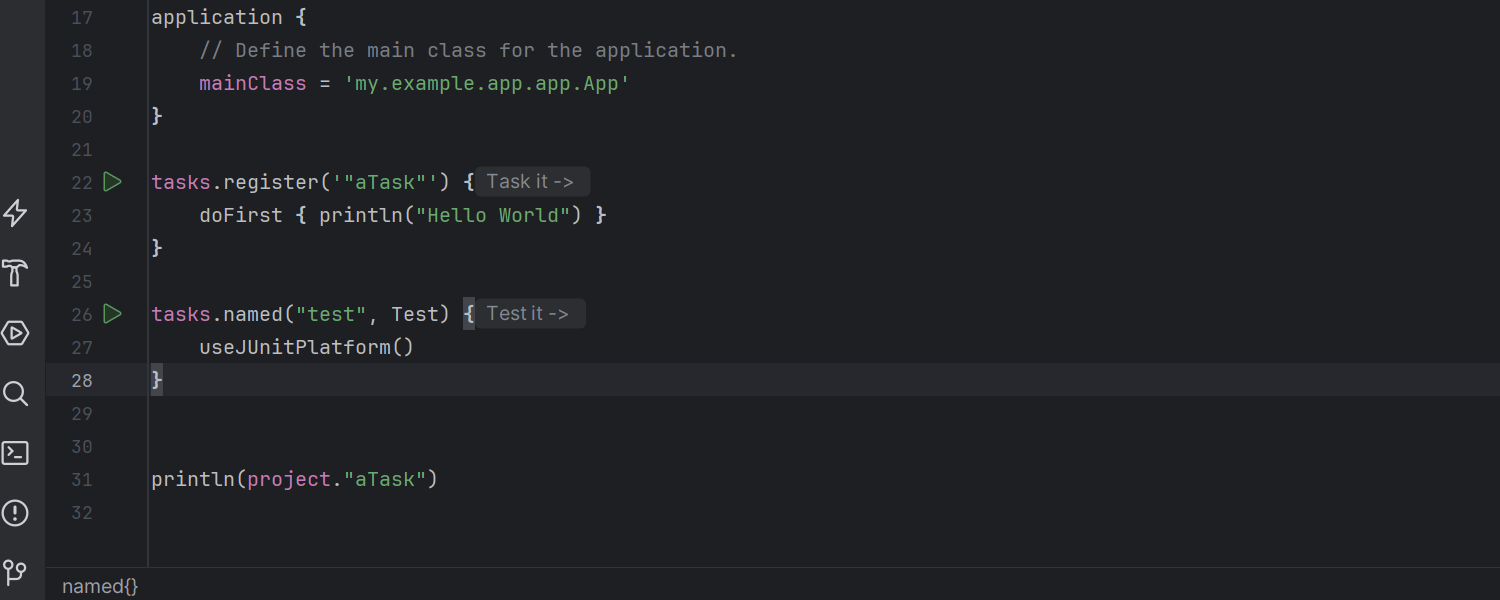
Improved experience with Gradle build scripts
IntelliJ IDEA 2024.2 offers new navigation and highlighting features for Gradle build
scripts. First, the IDE now provides smooth and accurate navigation to the Gradle
plugins declared in build scripts. Additionally, we’ve implemented navigation between
version catalog files and build scripts in the libs.versions.toml file,
as well as an option to run registered tasks directly from the gutter.
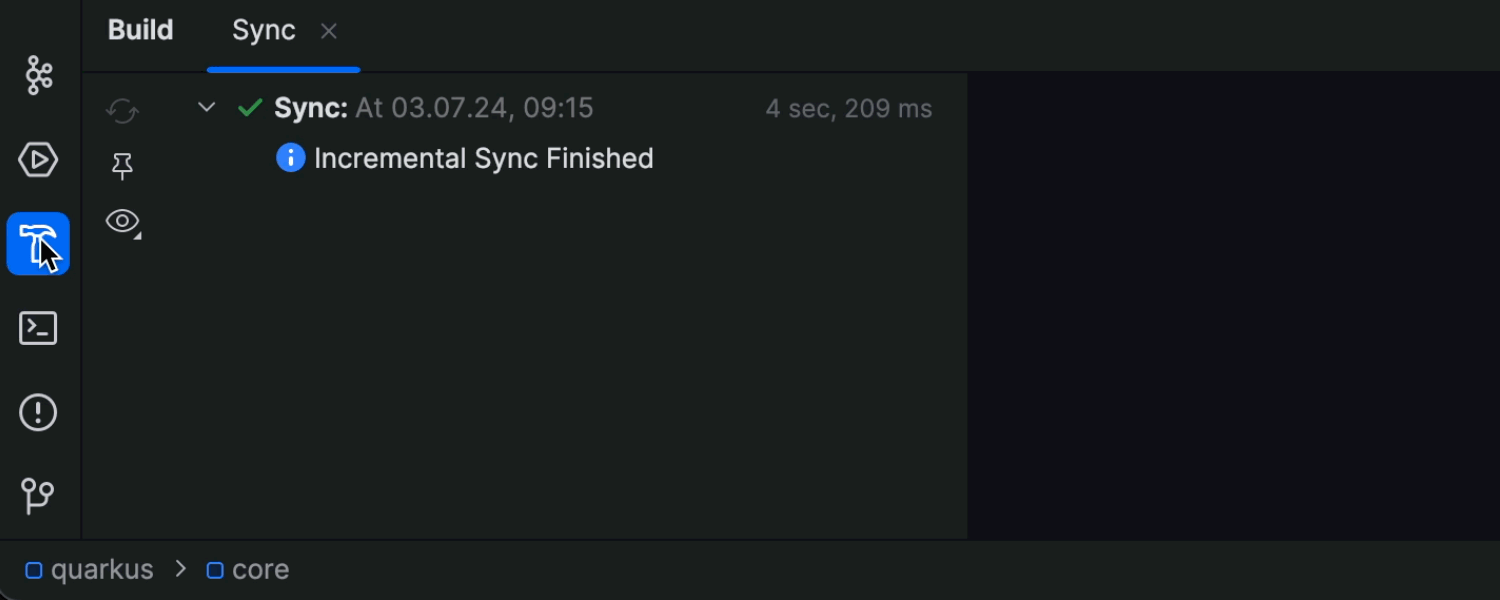
Incremental Maven project re-sync
We’ve made the re-sync workflow for Maven projects faster. After the initial full sync, the IDE now detects changes in specific parts of the project and only re-syncs those parts rather than the entire project.
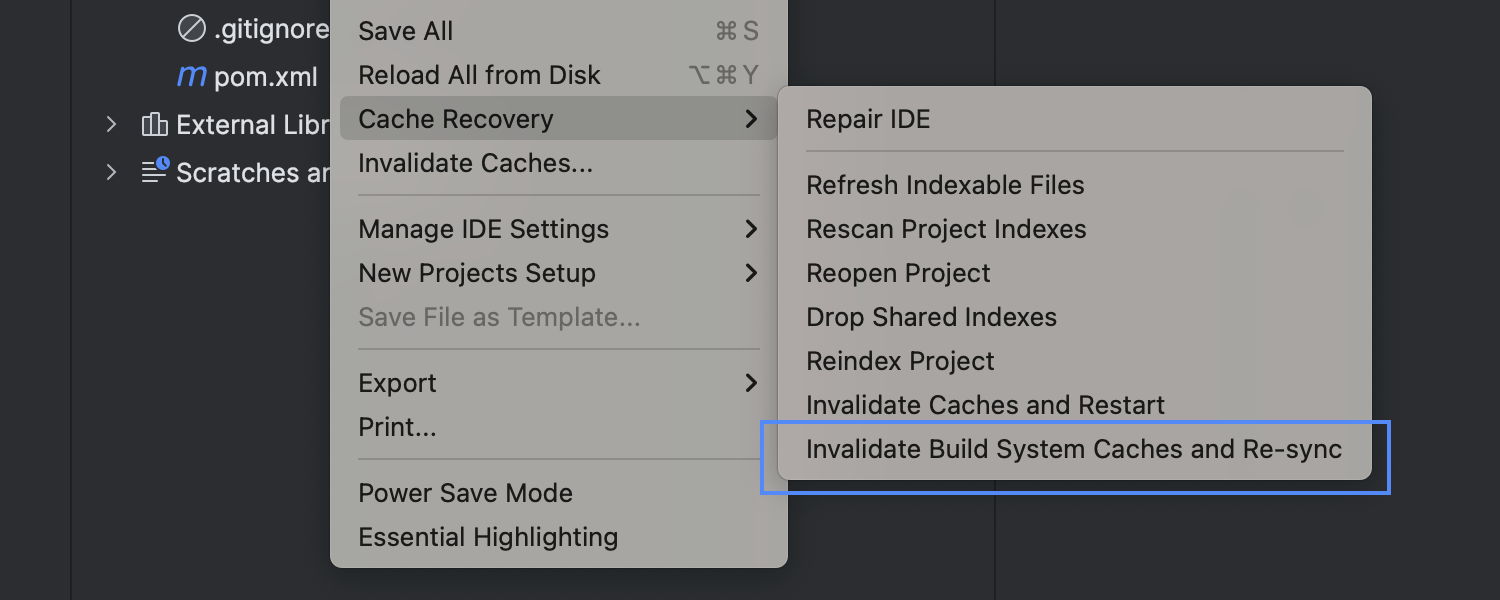
Action to invalidate build system caches
You can now clear build system caches, allowing you to instantly resolve issues related to the structure of Maven, Gradle, or sbt projects – such as those caused by an improper data import. You can access this action via File | Cache Recovery | Invalidate Build System Caches and Re-sync.
Version control systems
Import statement conflict resolution
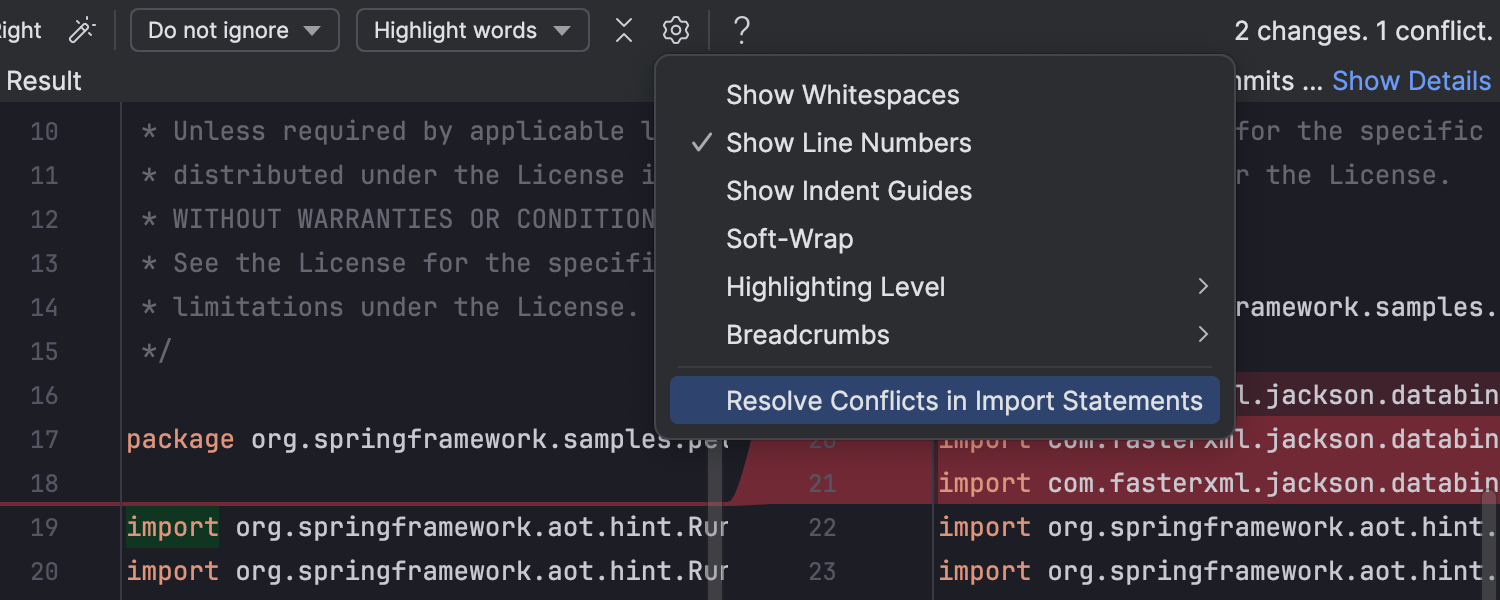
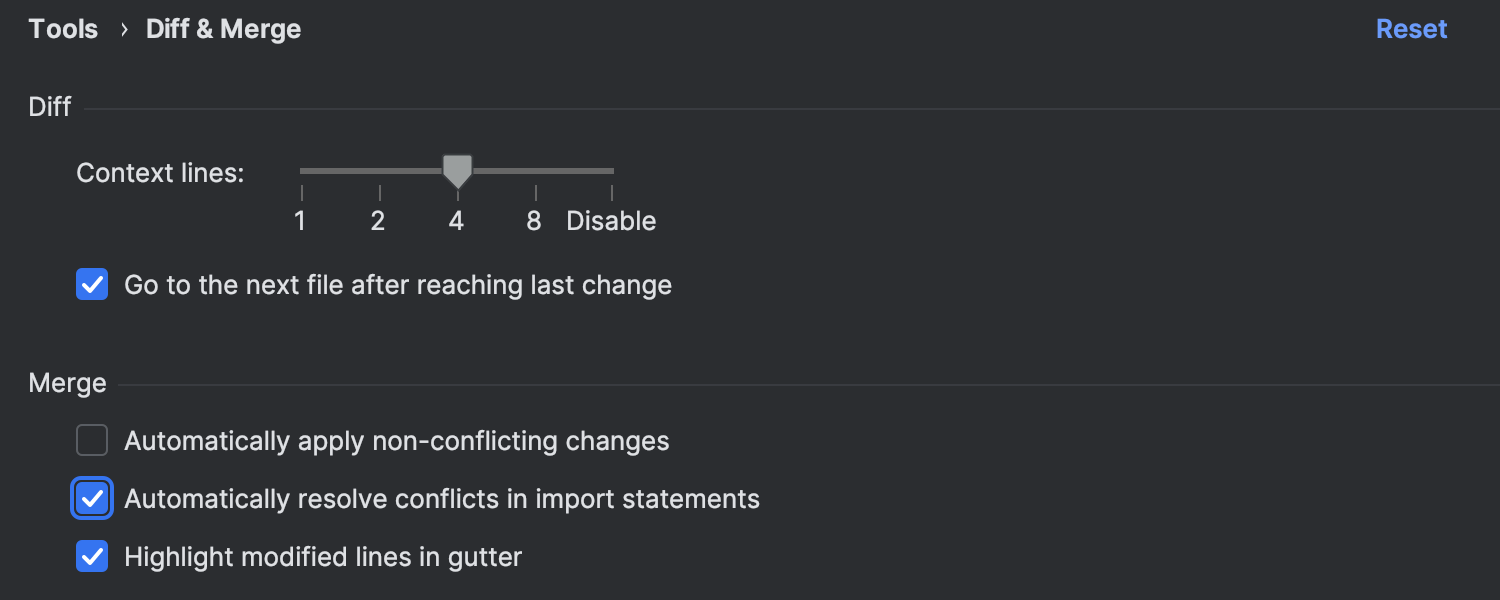
You can now easily identify and resolve conflicts in import blocks for Java and Kotlin. In the Merge window, click on the gear symbol and select Resolve Conflicts in Import Statements. Additionally, you can set the IDE to resolve conflicts in import statements automatically in Settings/Preferences | Tools | Diff & Merge.
Tags in the Version Control widget
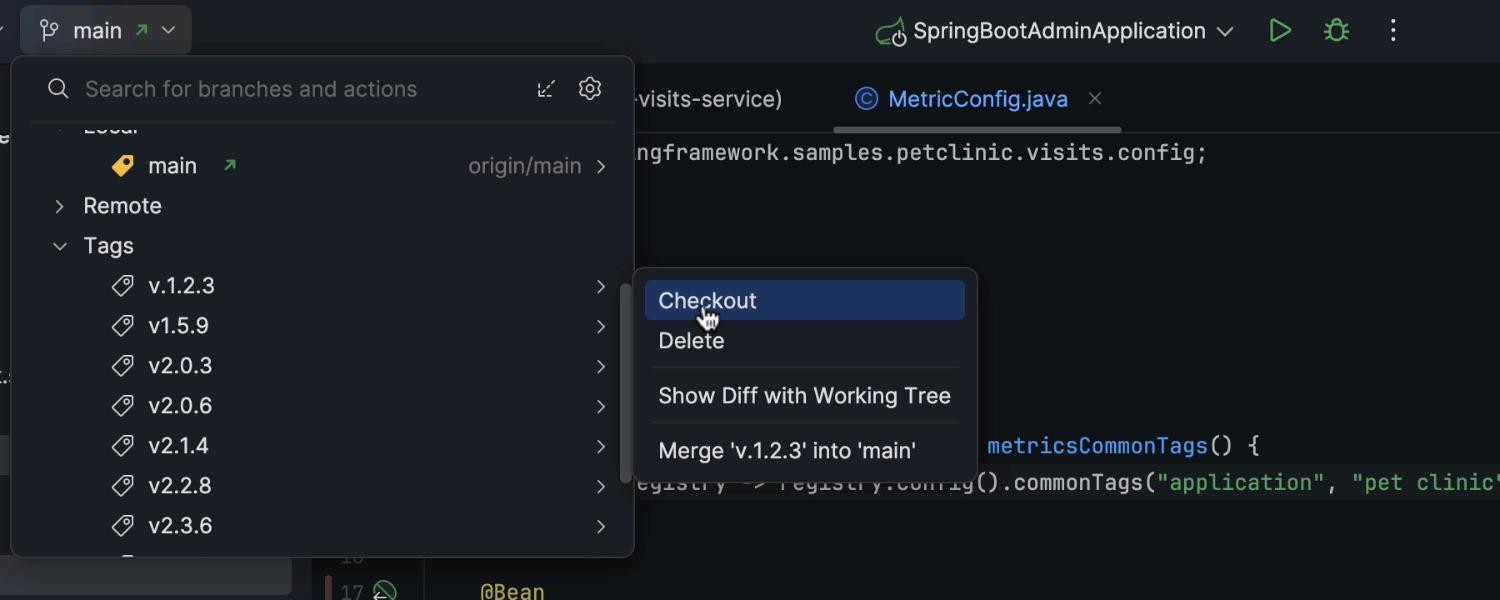
We’ve given tags a dedicated node in the Version Control widget, making it easier to check them out. The node is displayed by default, but if you prefer to hide it, simply click the gear icon and uncheck the Show Tags option.
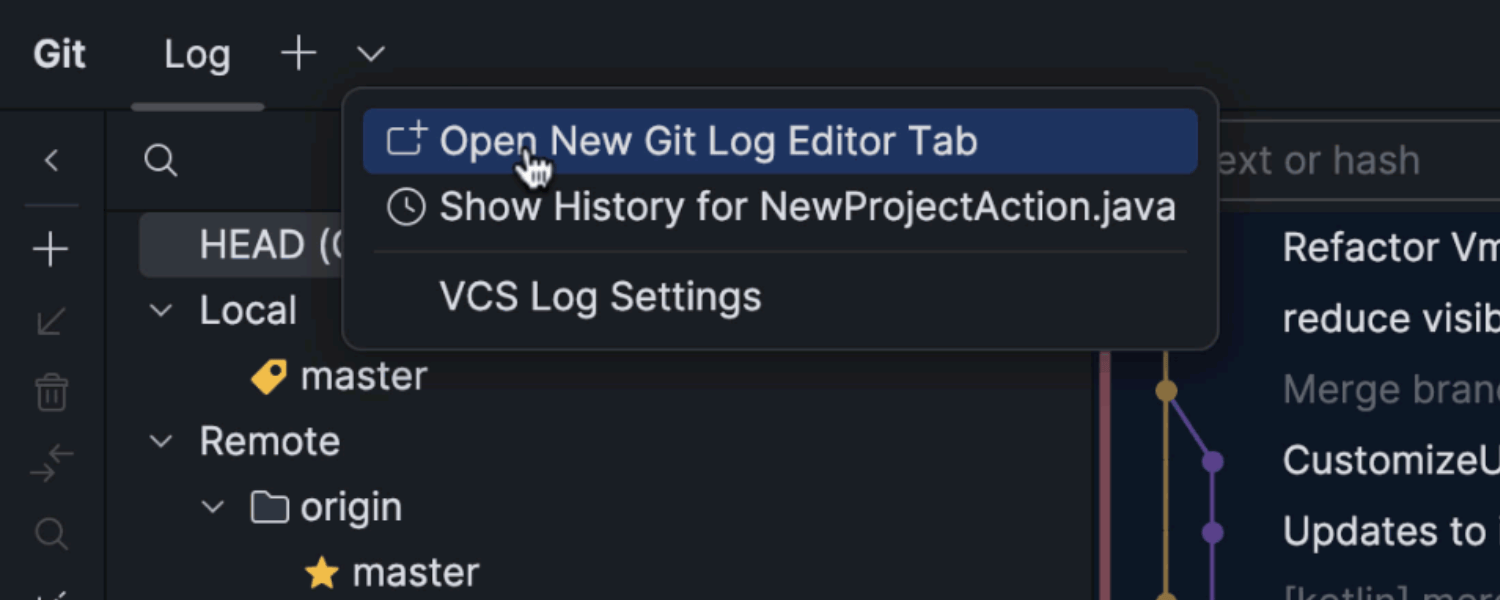
Improved user experience with the Log tool window
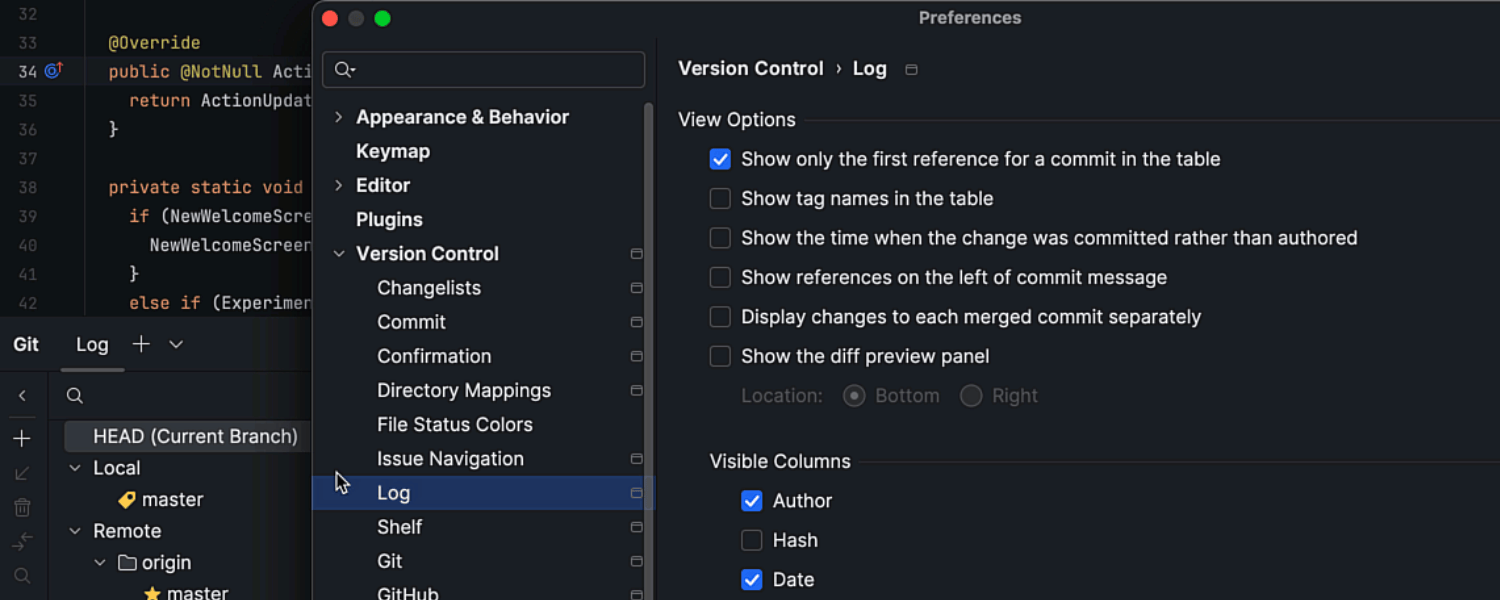
All settings related to the Log tool window have been consolidated into a dedicated settings page, which you can access either through Settings/Preferences | Version Control | Log or via a new drop-down menu on the Log tool window’s toolbar. Additionally, you can now open the Git log as a tab in the editor, providing more workspace and easier navigation through the list of commits and related details. This action is also available through the drop-down menu in the Log tool window’s toolbar.
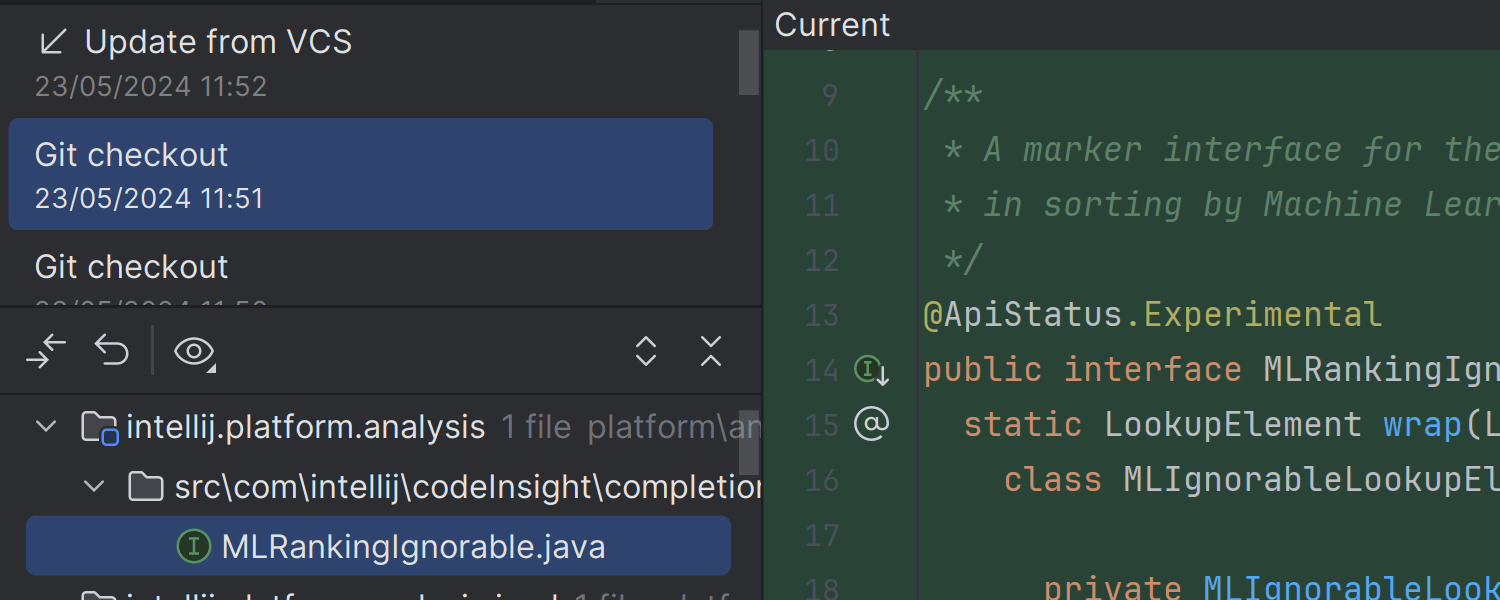
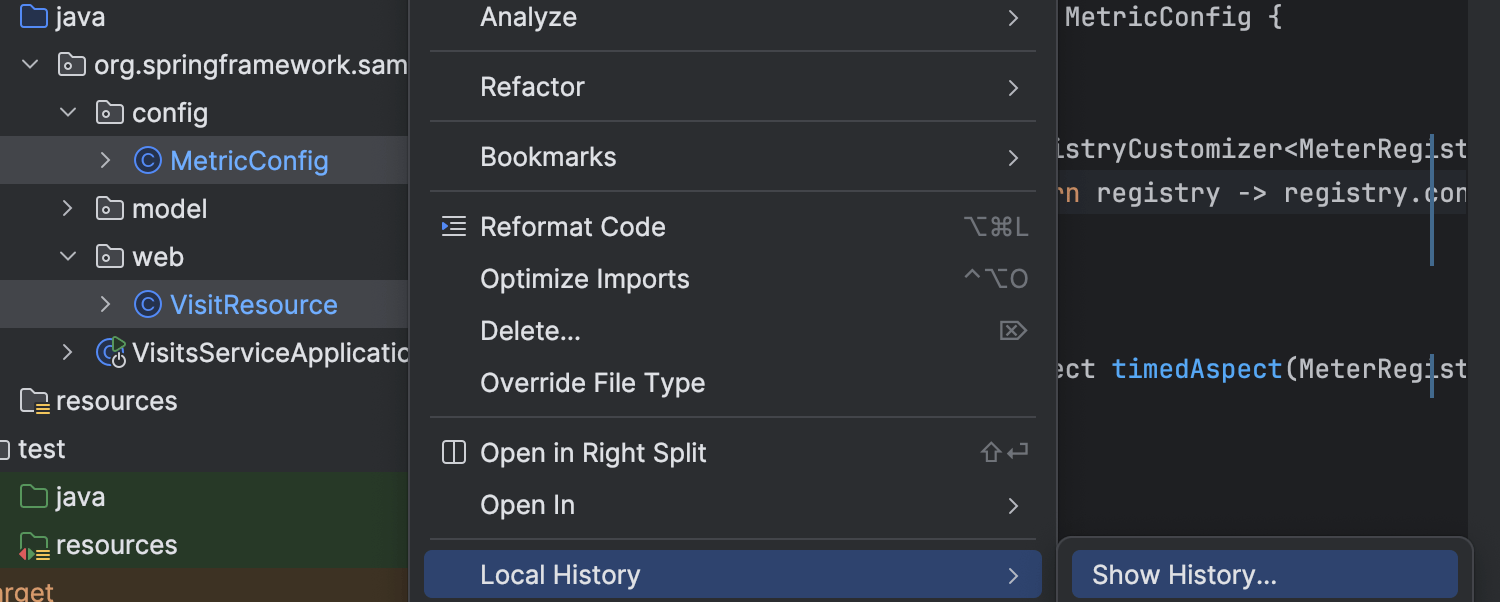
Enhanced user experience with local history
We've modernized the UI of the Local History dialog. Additionally, when accessed for a directory, the dialog now features a diff view alongside the list of changes, making them easier to understand. To simplify reviewing changes in complex projects, we’ve made the Local History action available for multiple files or directories simultaneously. In the Project tool window, select multiple files or folders and choose Local History | Show History to view a popup with the change history for your selections.
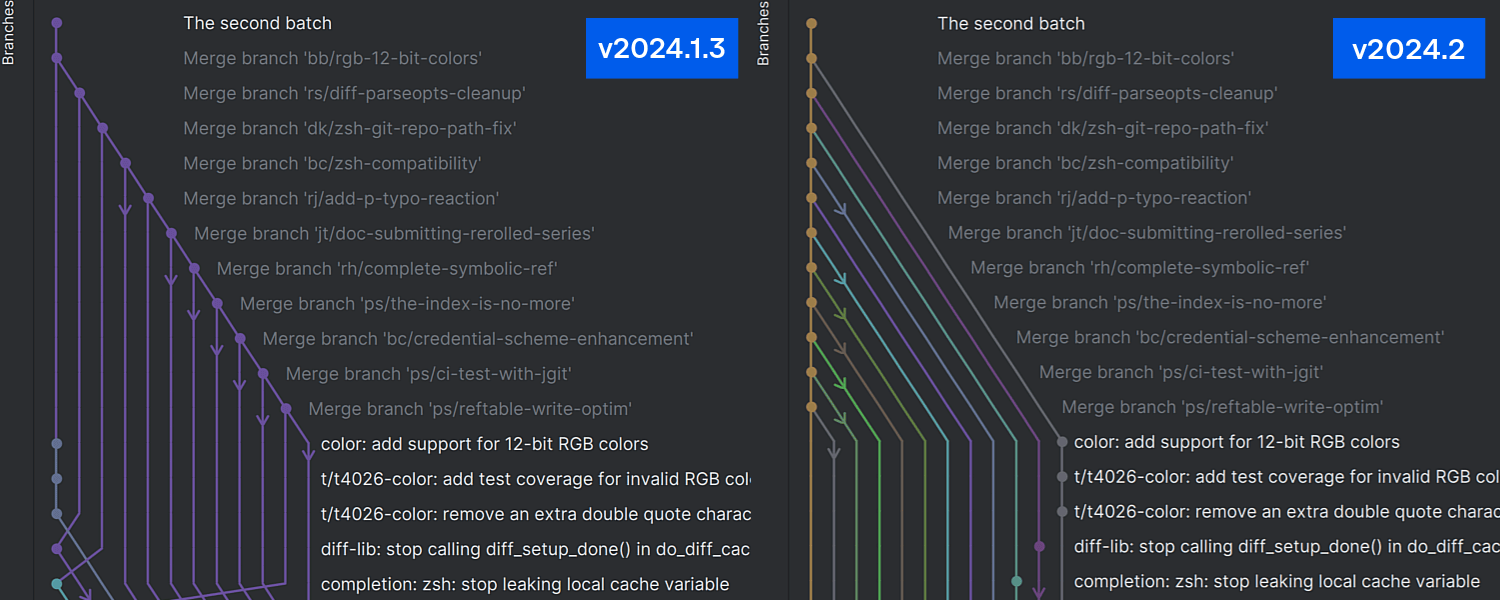
Improved commit graph in the Log tab
We’ve refined the color encoding and layout of branch lines for the commit graph in the Log tab of the Git tool window. Important branch lines now consistently remain on the left-hand side of the graph and retain their designated colors, making them easier to identify and follow.
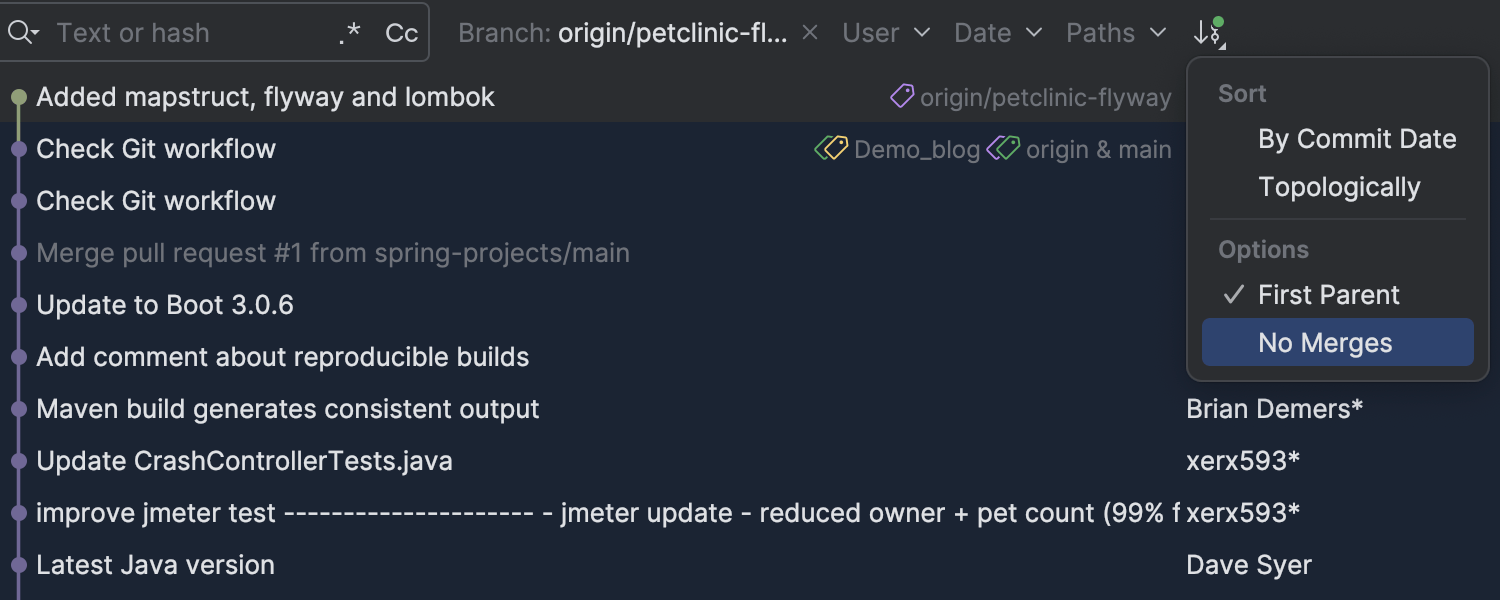
New First Parent and No Merges in Graph Options
We’ve added new Git options to simplify viewing branch histories. Use the First Parent option to focus on the mainline changes by hiding individual commits from merges. Alternatively, you can filter out merge commits entirely with the No Merges option. Both options are now available under the Graph Options icon in the Git tool window, making it easier to track changes in your branches.
Terminal
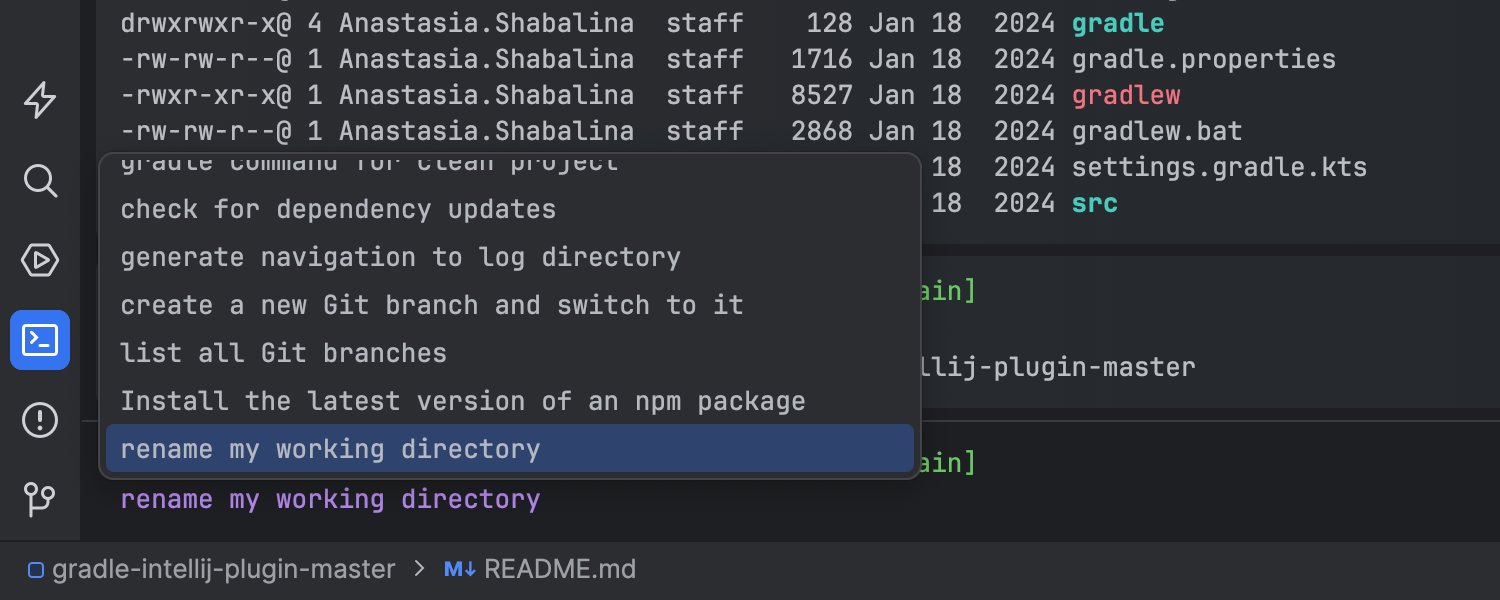
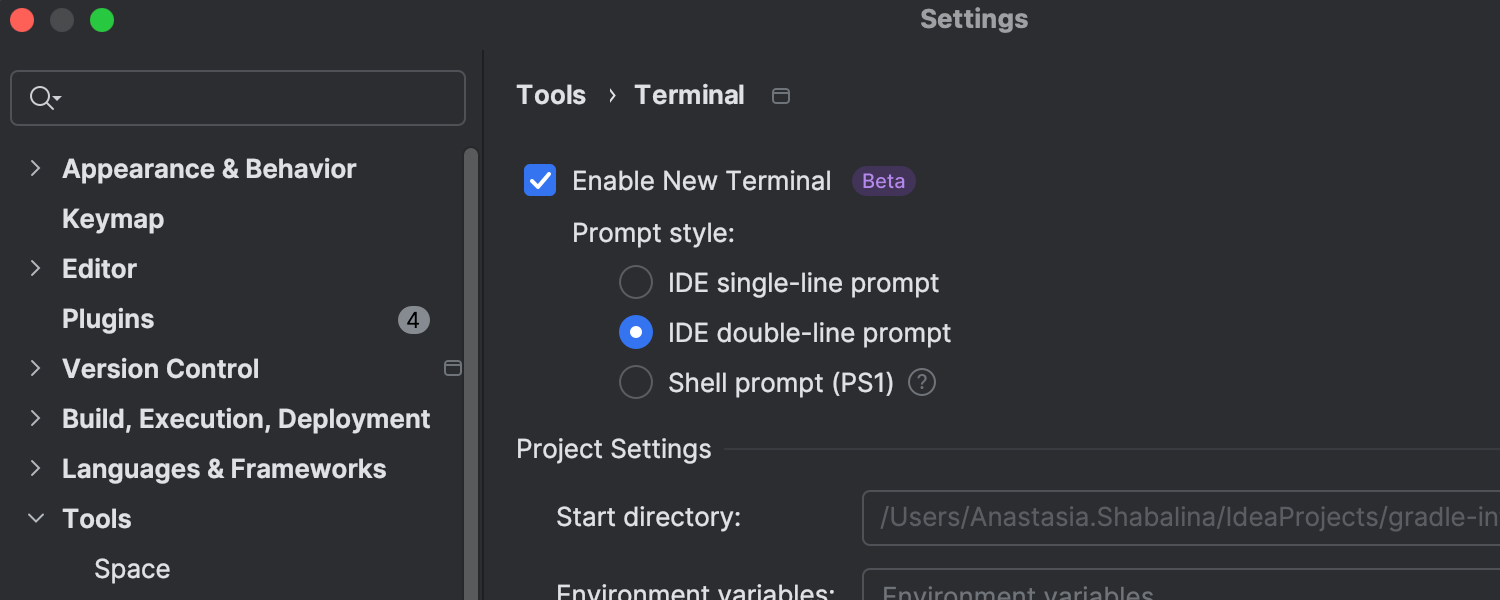
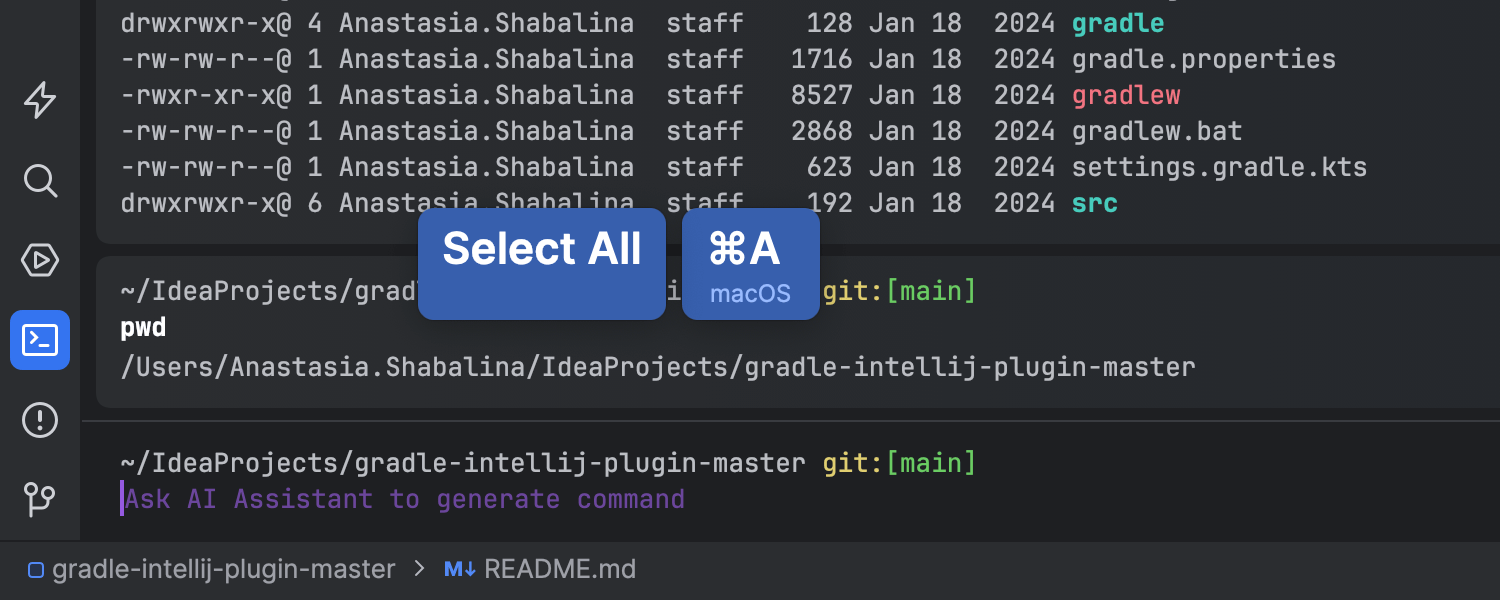
The New Terminal
Beta
The new terminal in v2024.2 introduces updates that enhance functionality and the user experience. Key improvements include AI-powered command generation, which allows you to describe a command in natural language and have AI create it for you. Additionally, you can now choose between single-line or double-line settings for better space utilization or readability, and custom shell prompt settings are now supported. Finally, command completion has been enhanced for Git aliases and branches, npm packages, PHP commands, and Ruby CLIs.
Learn more in this blog post.
Frameworks and technologies
Autocompletion for Micronaut and Quarkus beans
Ultimate
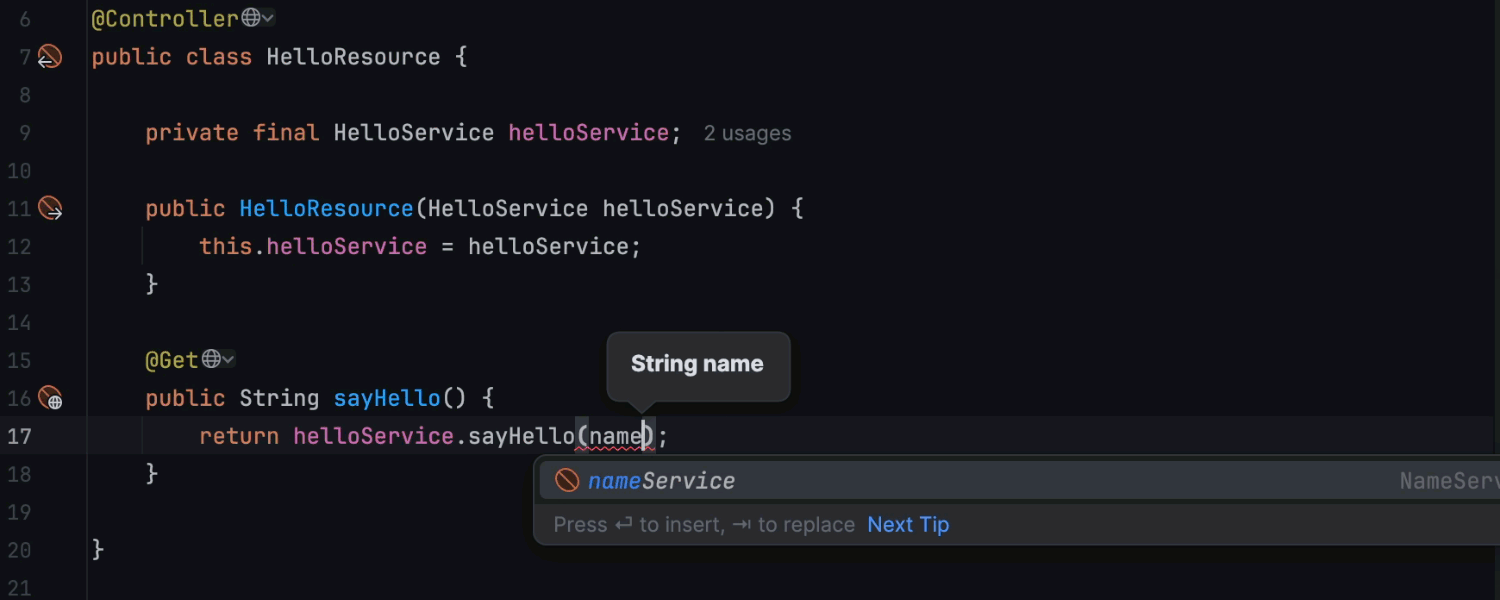
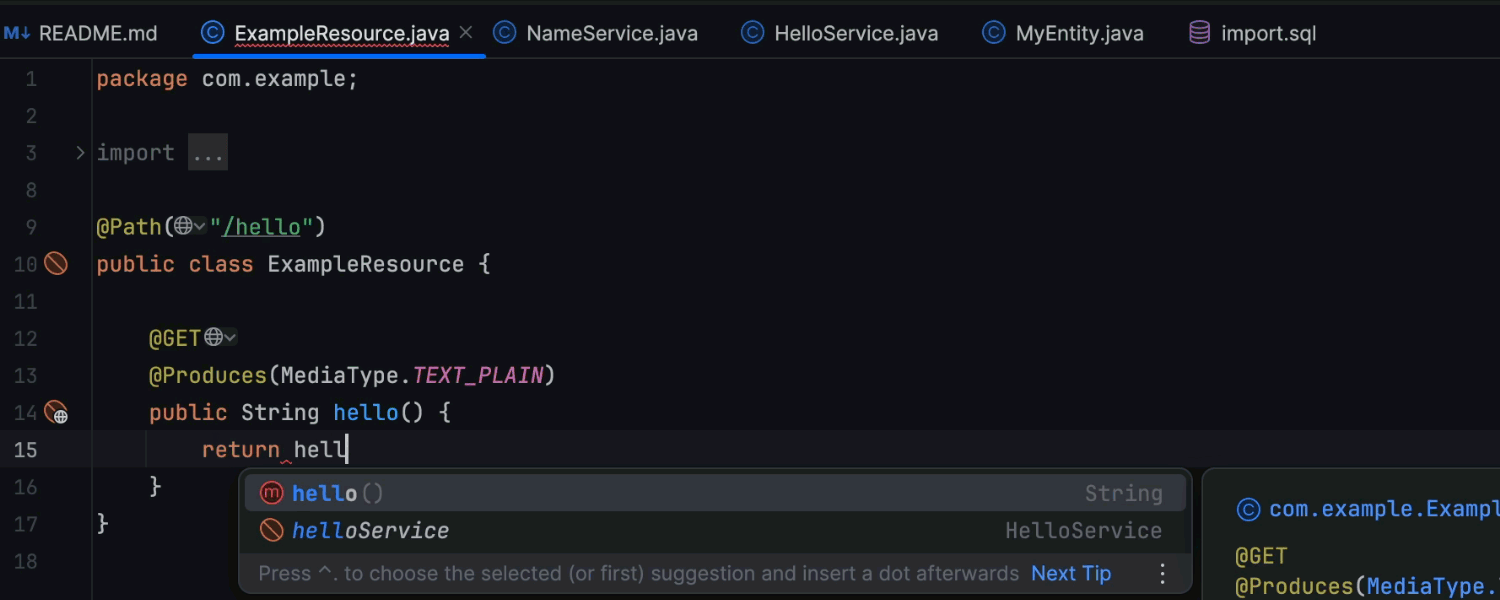
IntelliJ IDEA Ultimate now provides bean autocompletion and injection for Quarkus
and Micronaut applications. When you need to inject a bean into your code, simply
start typing its name and select it from the code completion popup. The IDE will
automatically add a constructor parameter or field with the @Inject
annotation, depending on your code style.
Extended JPA support
Ultimate
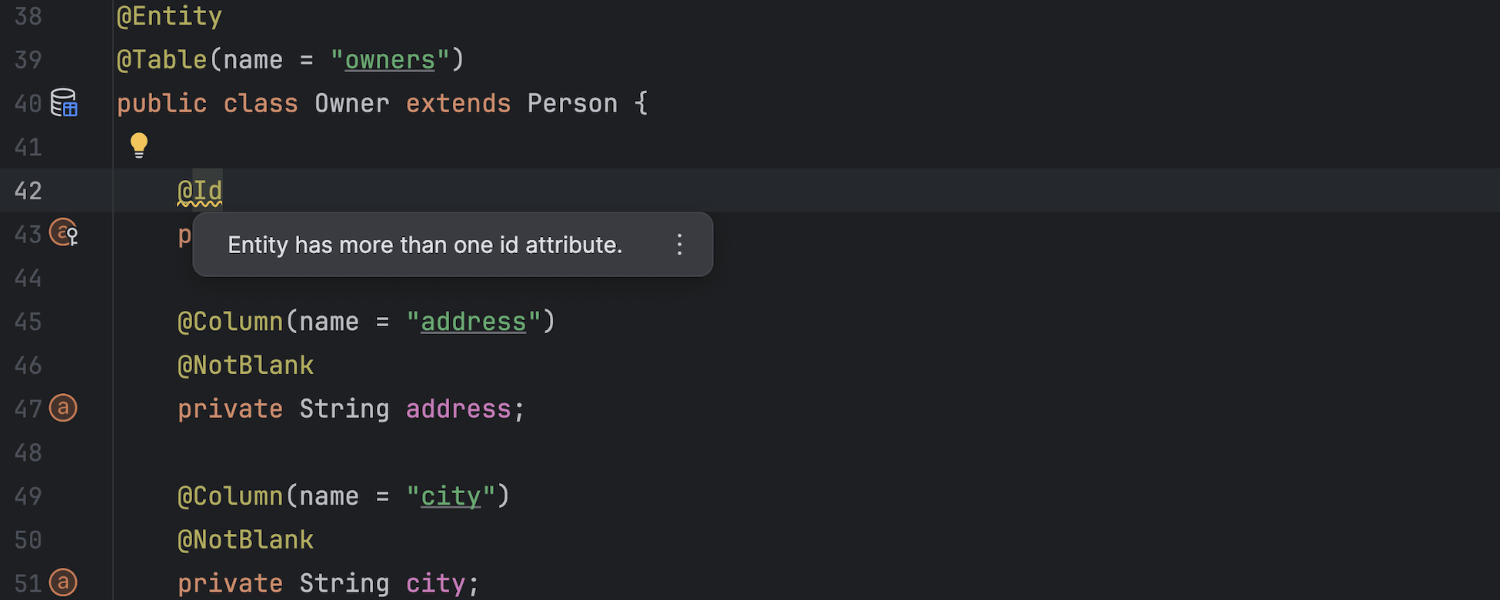
We’ve extended IntelliJ IDEA Ultimate’s JPA support with several new inspections.
These enhancements enable the IDE to detect and fix issues that may cause
performance degradation or runtime errors when using Lombok annotations with JPA
entities. The IDE can also identify missing parameters in Spring Data JPA repositories,
check if all associations are correctly marked, and prevent accidental deletions by
detecting the CASCADE parameter for @ManyToMany associations.
Ktor development mode support in run configurations
Ultimate
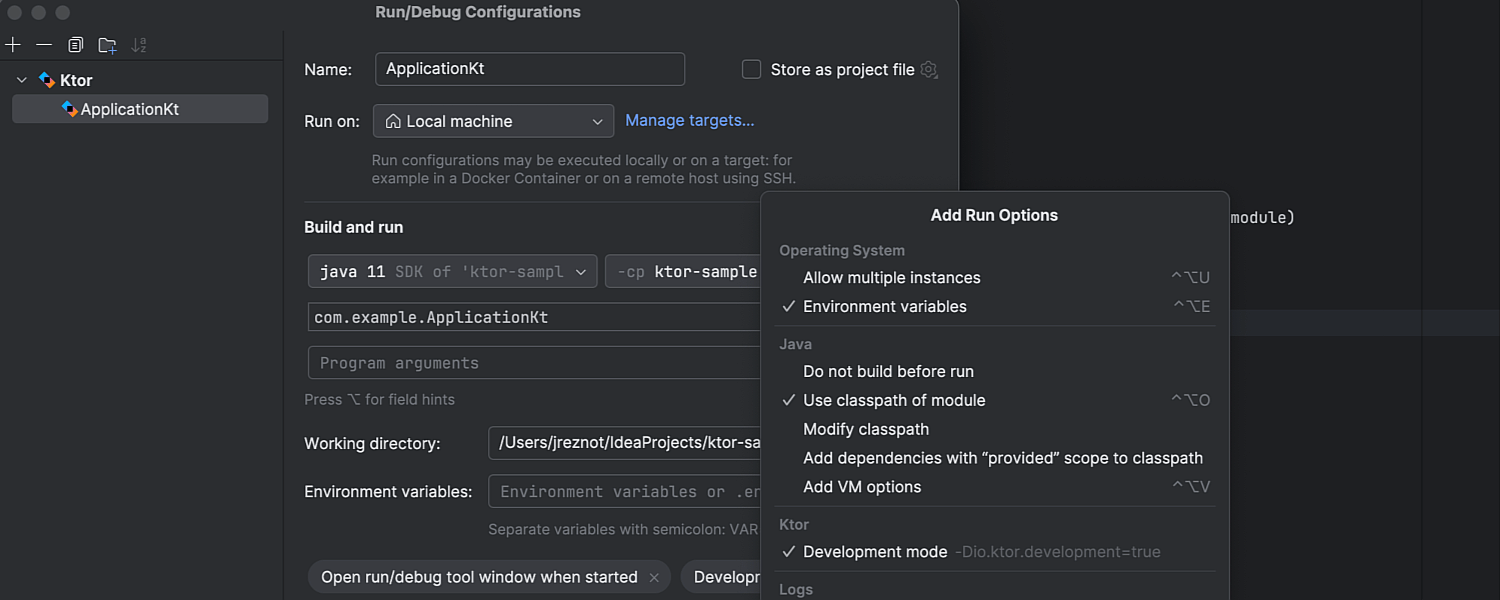
IntelliJ IDEA 2024.2 provides an easy way to enable Ktor’s development mode in run configurations. This mode is now set by default when creating a new run configuration and can be managed in the updated Run/Debug Configurations dialog. In addition, we’ve made the UI of this dialog cleaner and more user-friendly for Ktor users.
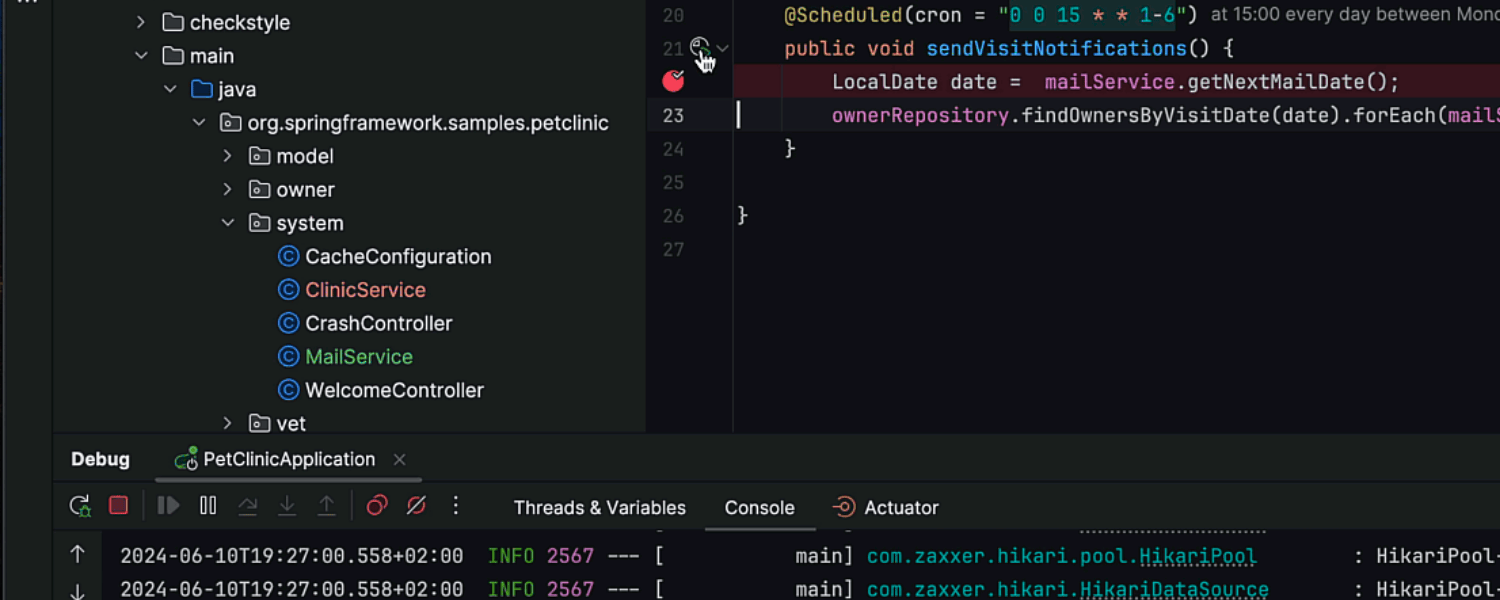
Ability to trigger Spring @Scheduled methods in debug sessions
Ultimate
@Scheduled methods in debug sessions
IntelliJ IDEA 2024.2 Ultimate features debugging capabilities for asynchronous
@Scheduled methods in Spring Boot. This update eliminates the need
to manually adjust a method’s schedule and wait for it to start. Simply set a
breakpoint and trigger the method’s execution directly from the IDE whenever you need.
Jakarta Data support
Ultimate
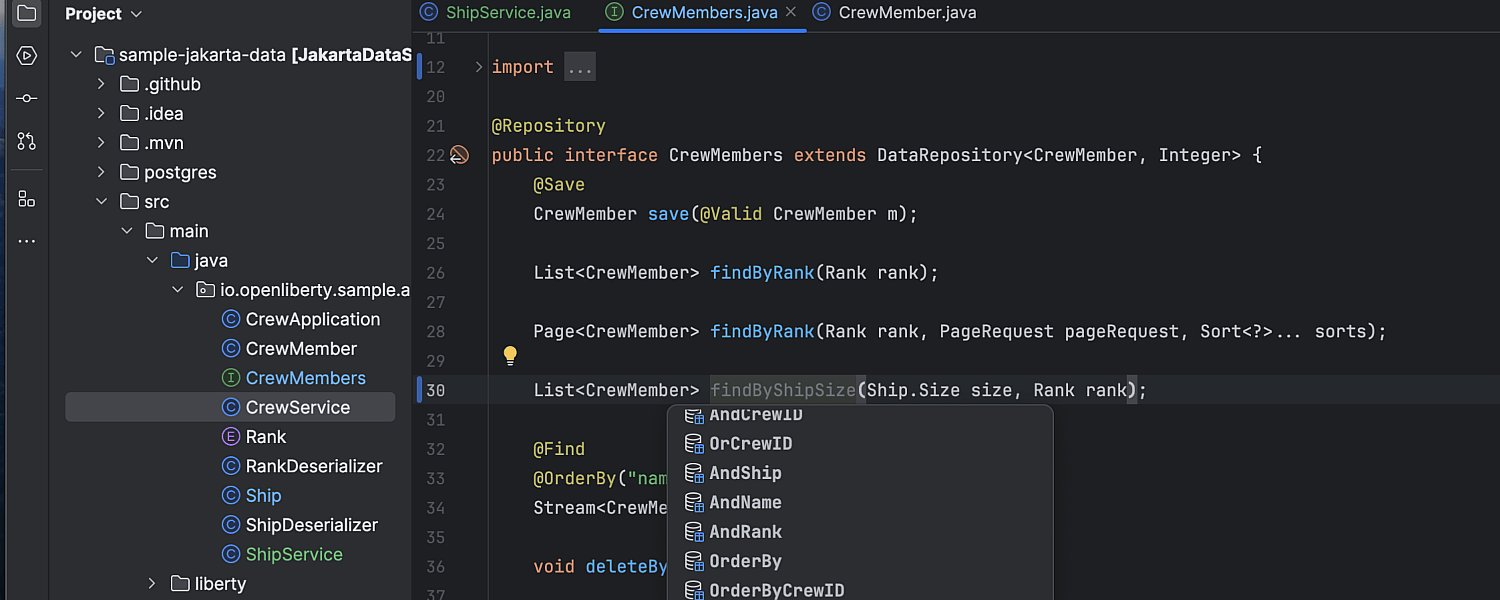
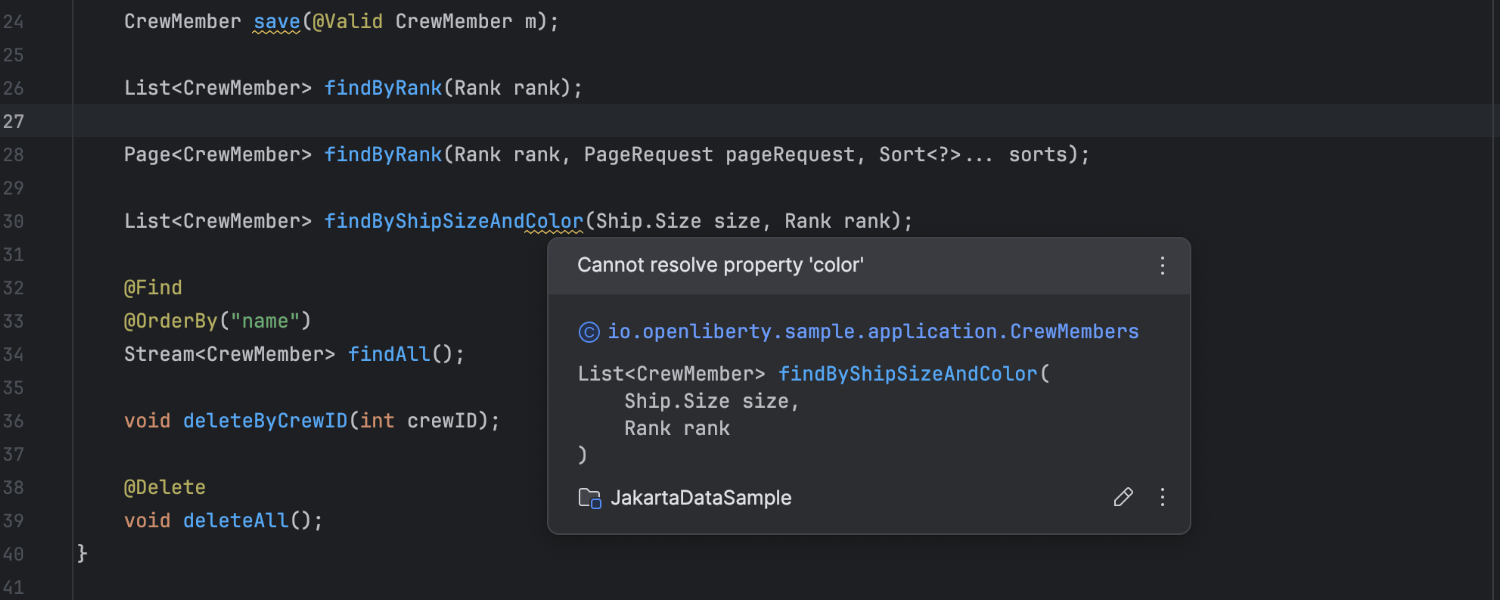
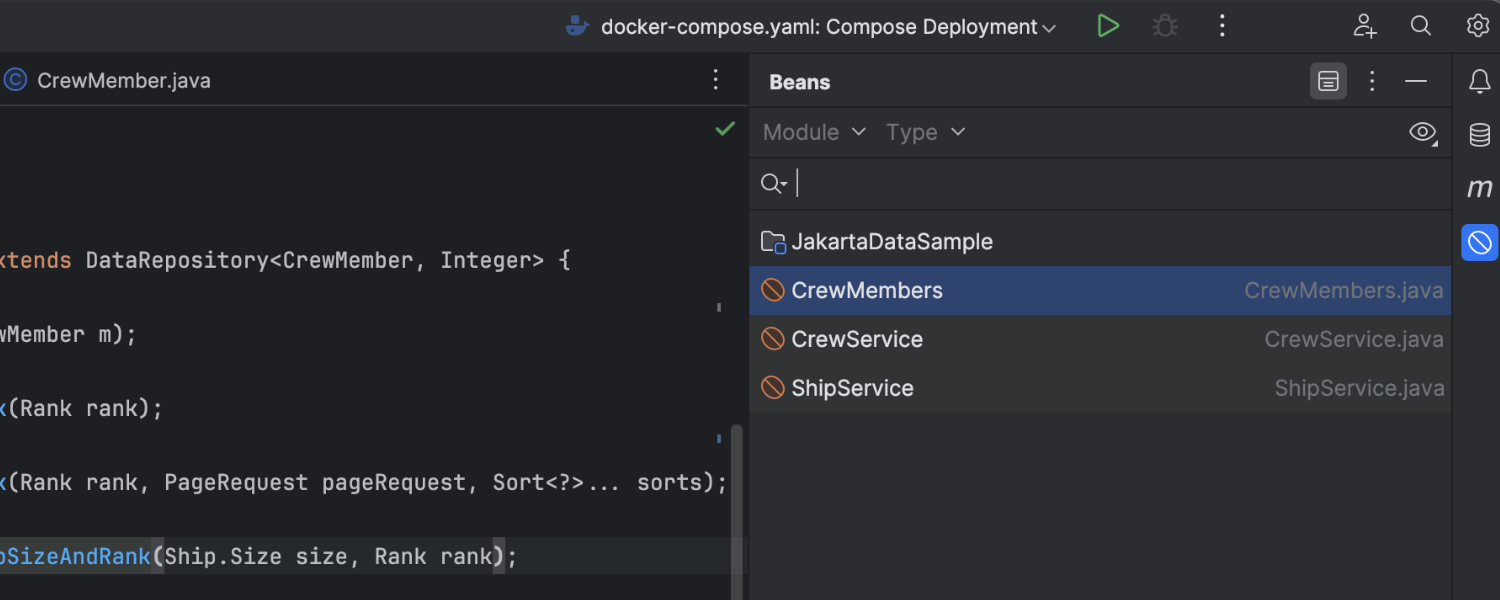
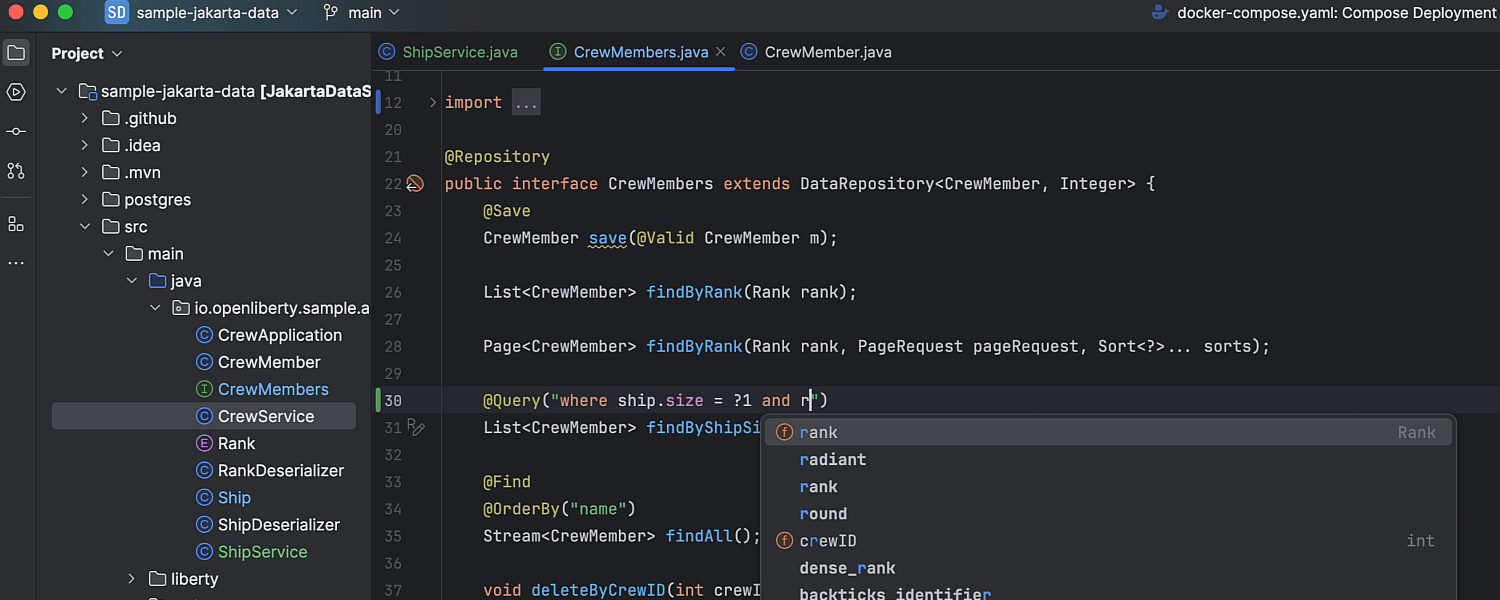
With IntelliJ IDEA Ultimate 2024.2, we are introducing support for Jakarta Data. The IDE now provides coding assistance and inspections for repositories, including method name completion and validation based on the data model as well as parameter validation based on the method name. Jakarta Data repositories are displayed in the Beans tool window to simplify navigation. Additionally, Jakarta query language support is now available, offering syntax highlighting, statement validation, and statement autocompletion based on the data model.
Enhanced Terraform support
Ultimate
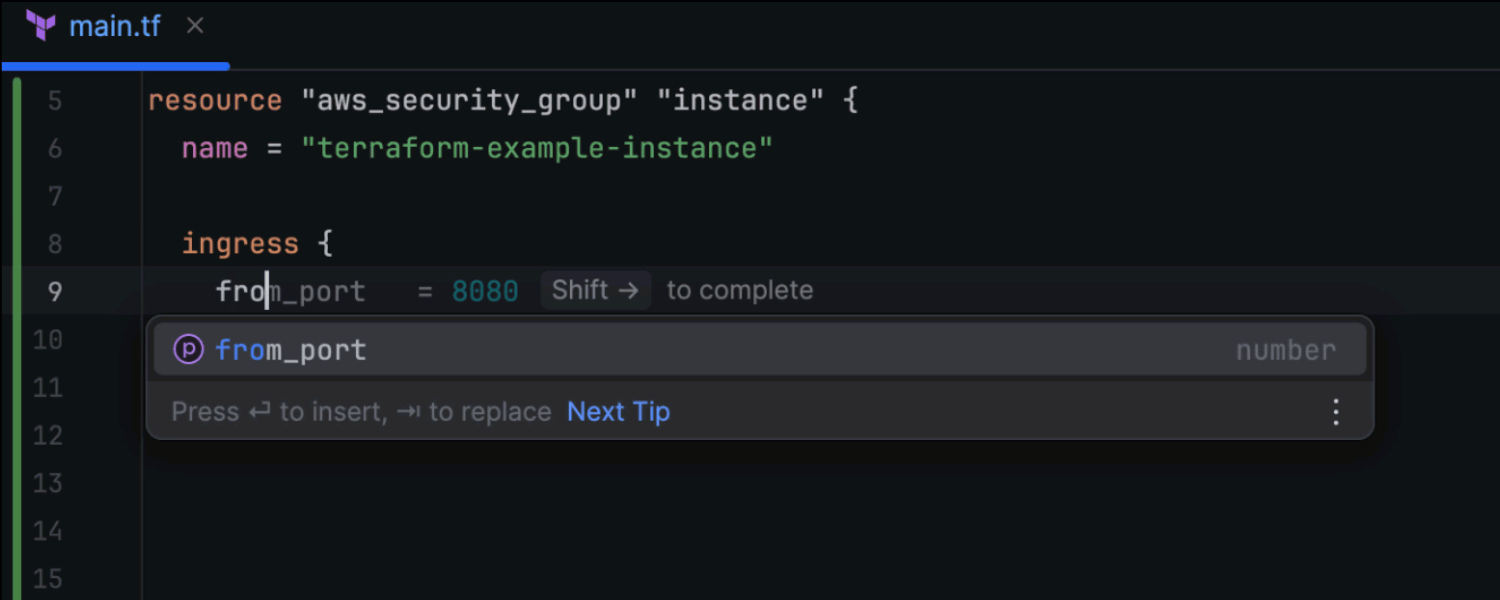
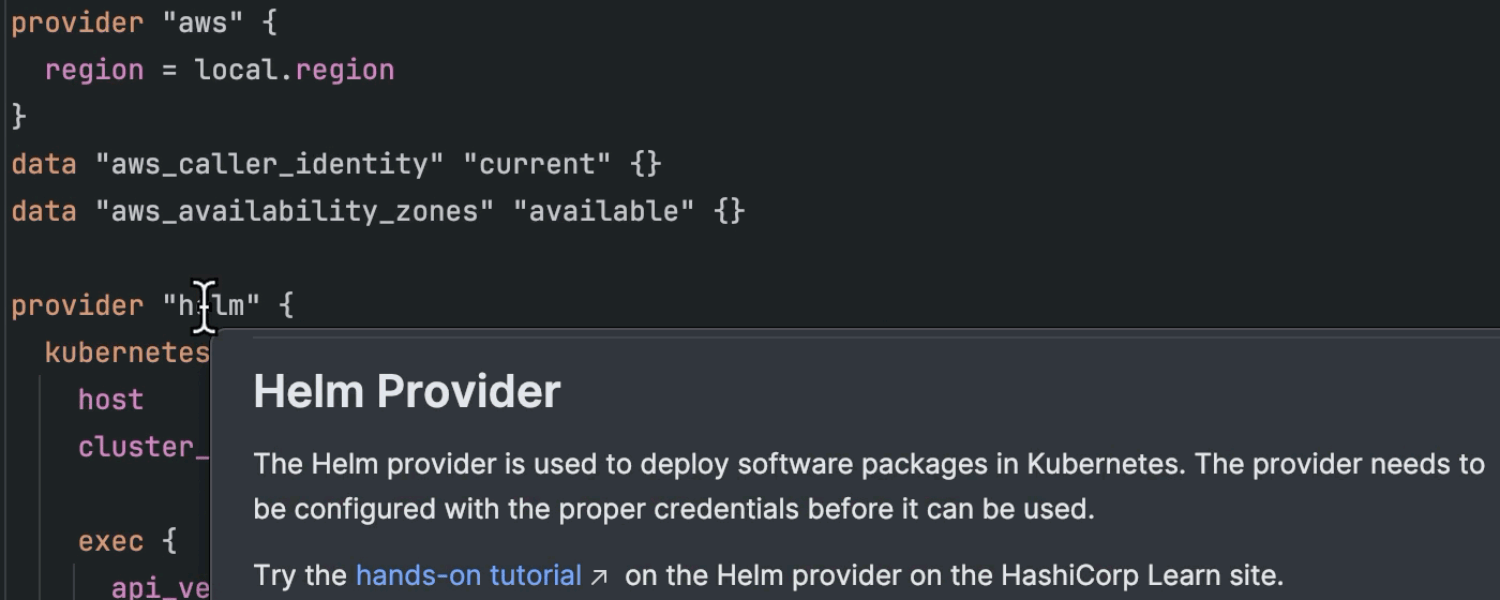
We’ve significantly extended IntelliJ IDEA Ultimate’s coding assistance for Terraform by making full line code completion available for it. Additionally, essential code insight features such as context-aware code completion, refined syntax highlighting, and the error detection system with quick-fix suggestions have been improved for Terraform. We've also added a quick documentation feature that displays tooltips when you hover over elements, providing instant information to help you use Terraform resources more effectively without interrupting your workflow.

HTTP Client improvements
Ultimate
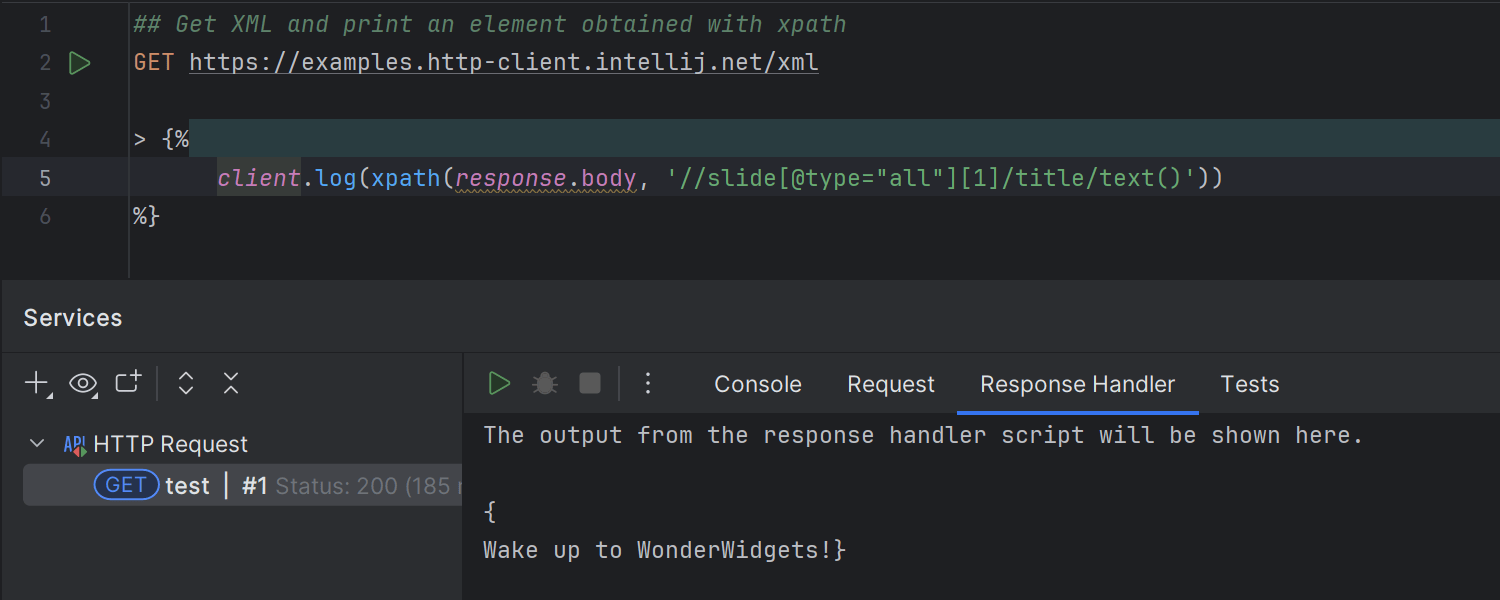
We’ve introduced valuable updates to the HTTP Client. The new XPath
function allows you to query elements directly from XML and HTML documents.
Additionally, we’ve added numerous methods for manipulating XML and HTML documents,
eliminating the need to parse XML manually.
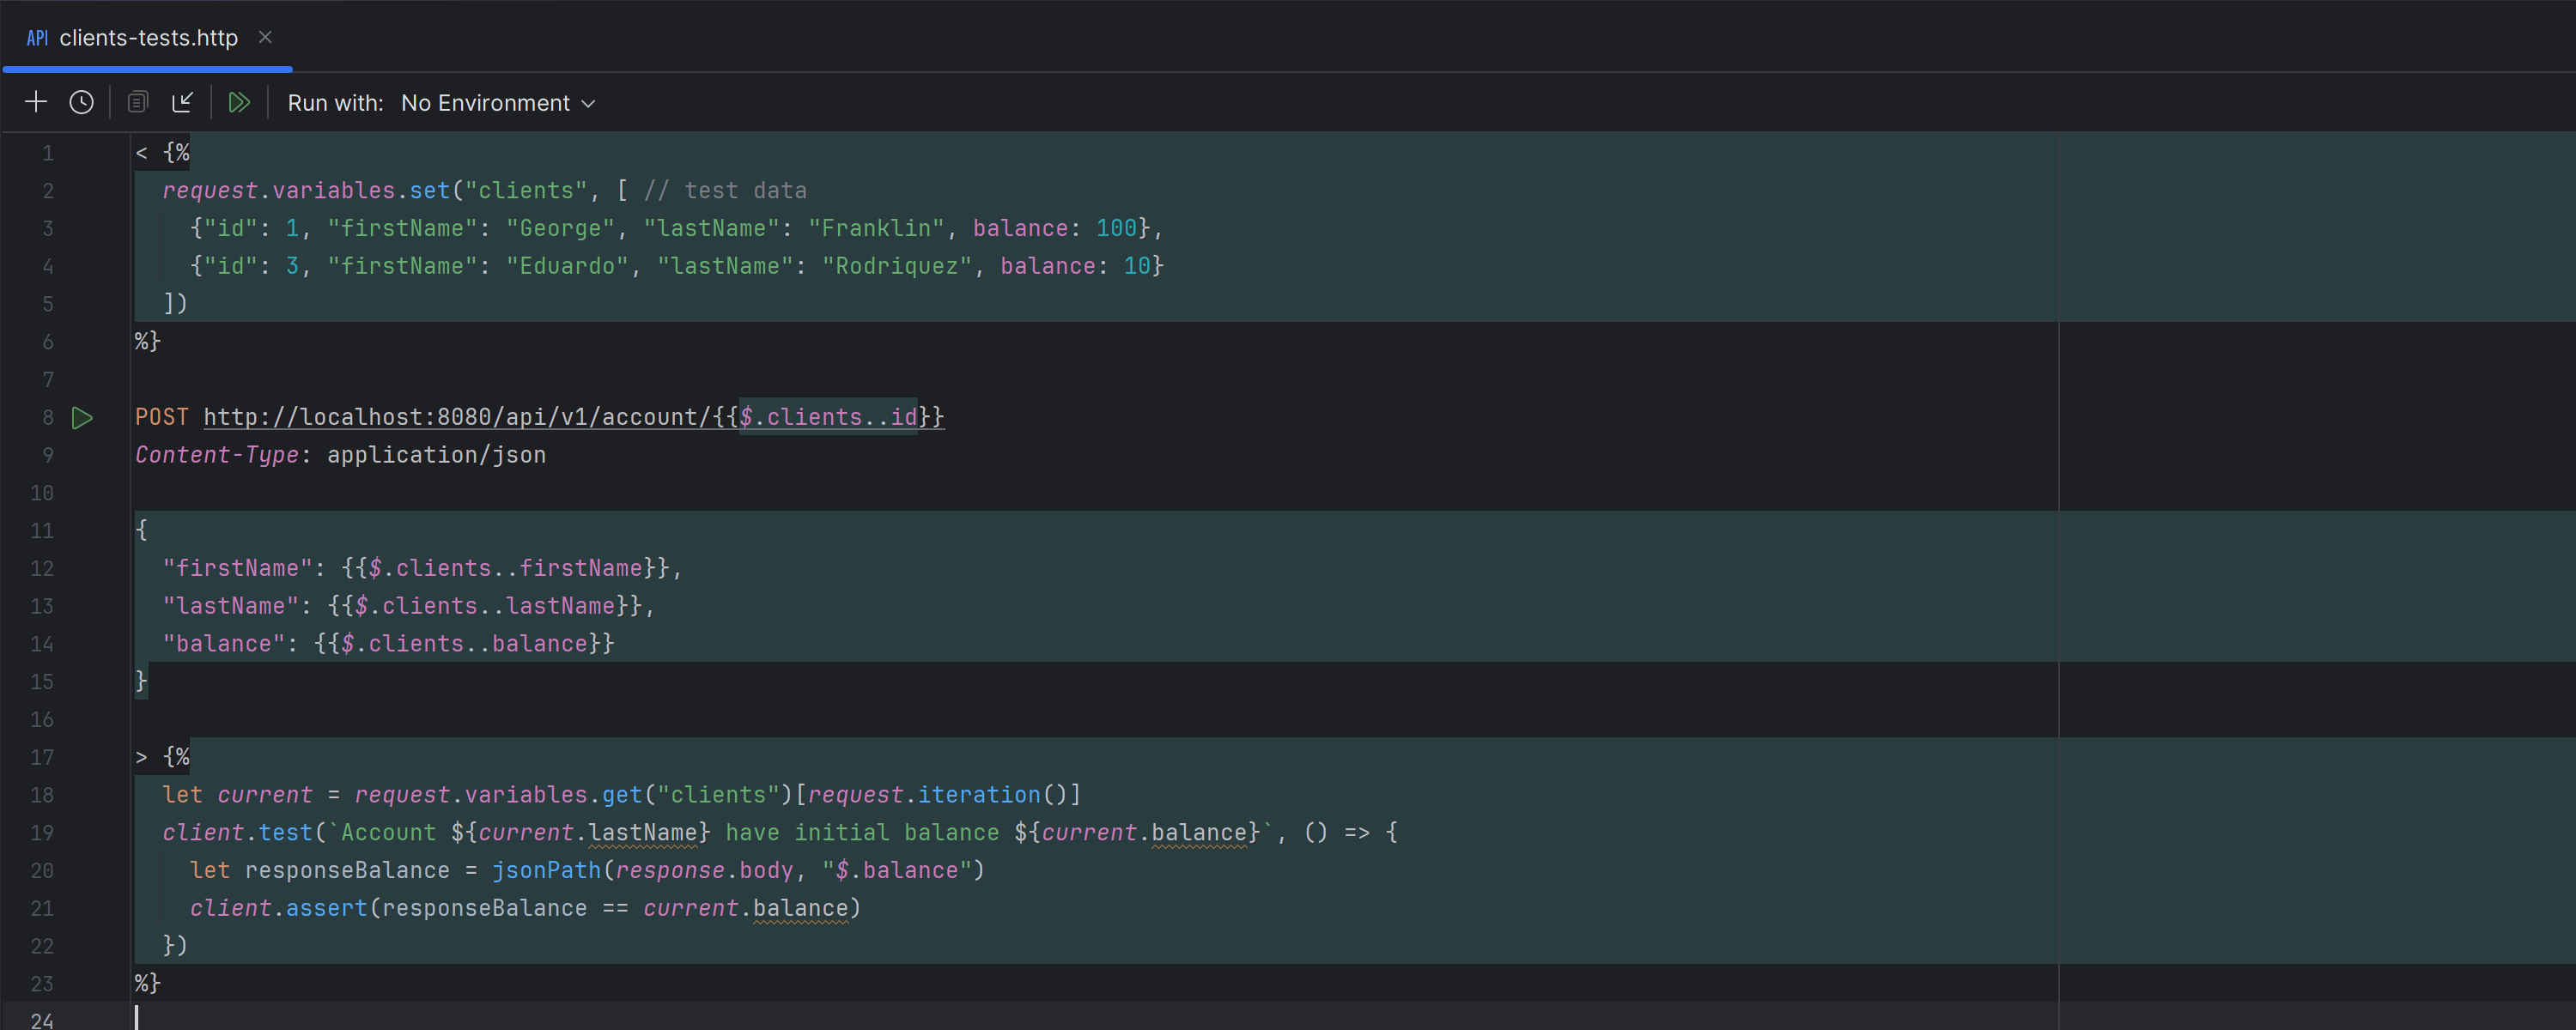
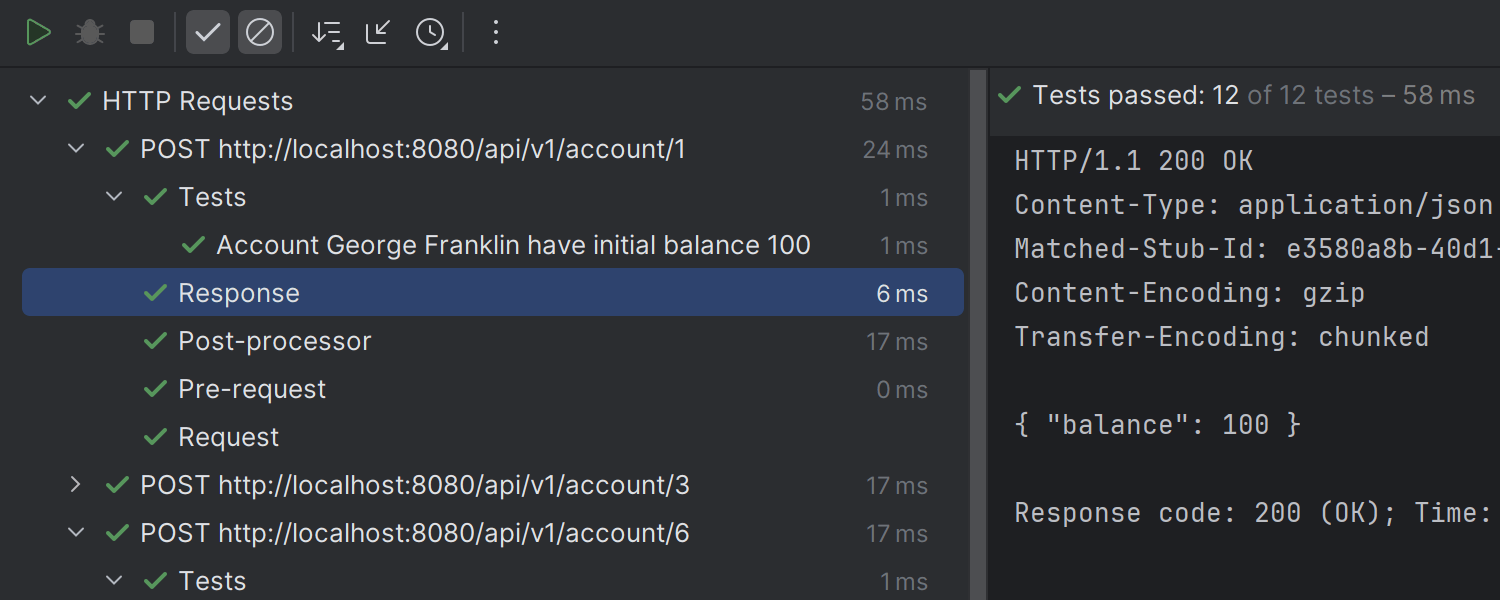
The HTTP Client now also supports iterating through variable collections, allowing you to compose a single HTTP request with a JSONPath collection and automatically send requests for each element in the collection. Furthermore, you can access specific collection items in post-processing scripts using JSONPath syntax.
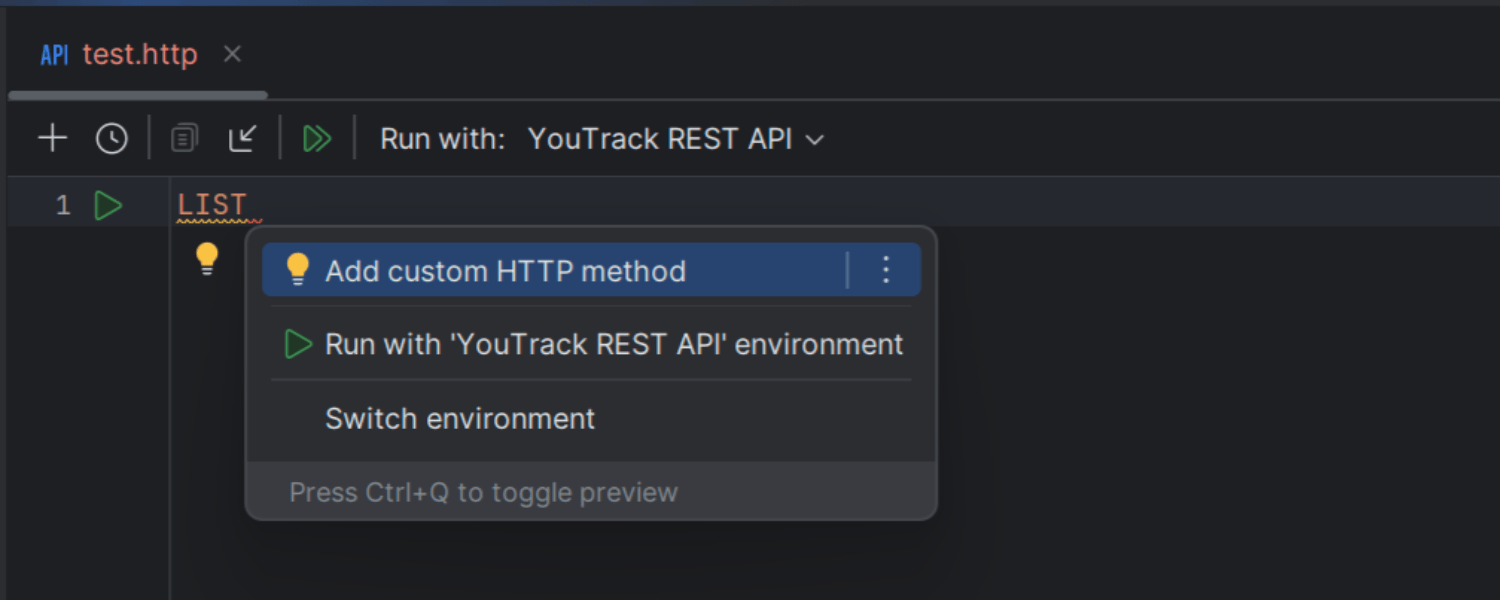
Additionally, we've streamlined working with APIs that provide specific methods. To work with these APIs, you can add custom methods on the fly with a quick-fix or enter them with a comma-separated list in Settings/Preferences | Tools | HTTP Client.
Remote development and collaboration
Streamlined setting management in remote development
Ultimate
The JetBrains Client and your desktop IDE now share the same settings, so any setting changes made in the locally installed IDE are automatically synced with the remote IDE via the JetBrains Client, ensuring your development environment remains consistent. The scope of shared settings has been extended to include console, debugger, and smart key configurations, among other things.
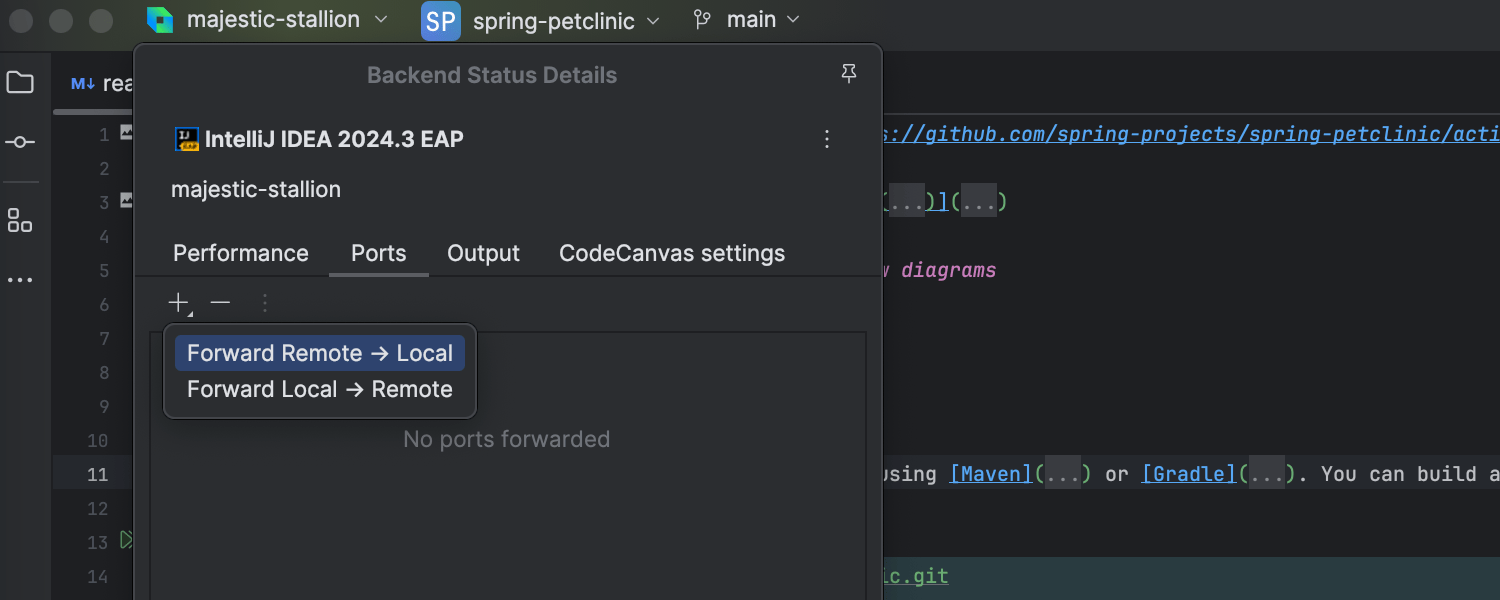
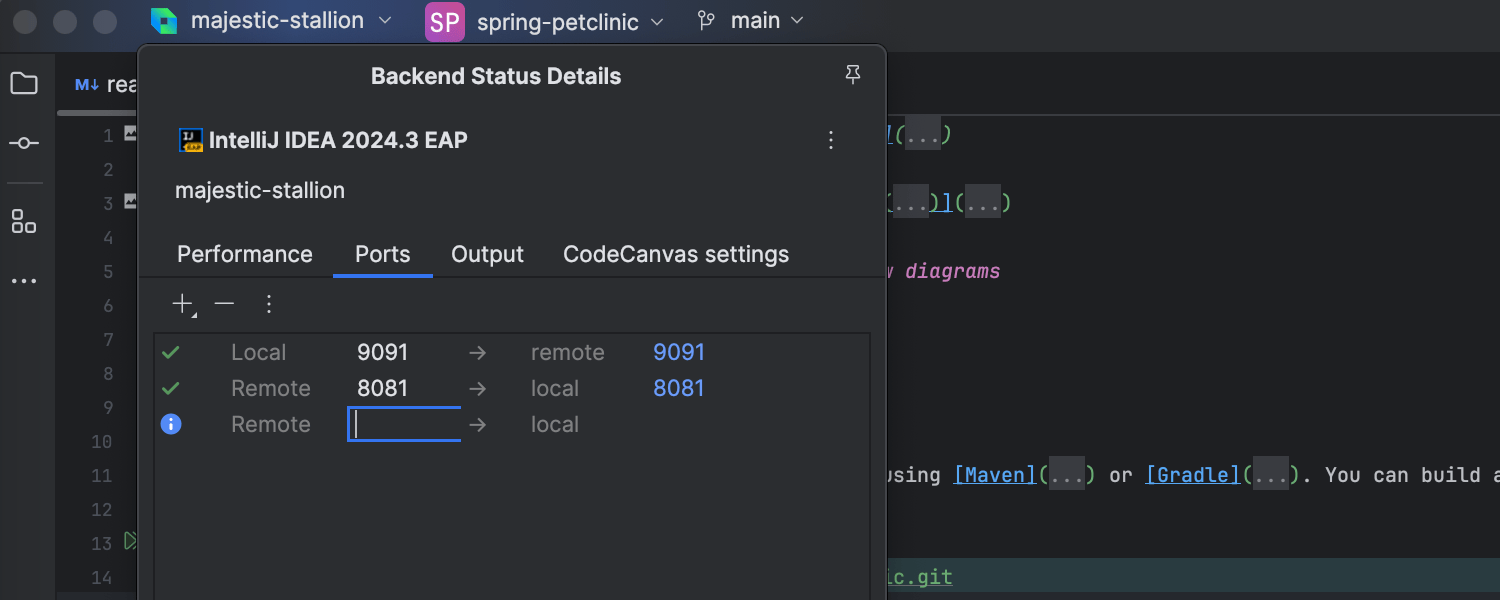
Reverse port forwarding for remote development
Ultimate
We've added reverse port forwarding for remote development workflows. This new feature allows the remote IDE to connect to ports available on the client machine. It is particularly useful for mobile development and connecting to local databases.
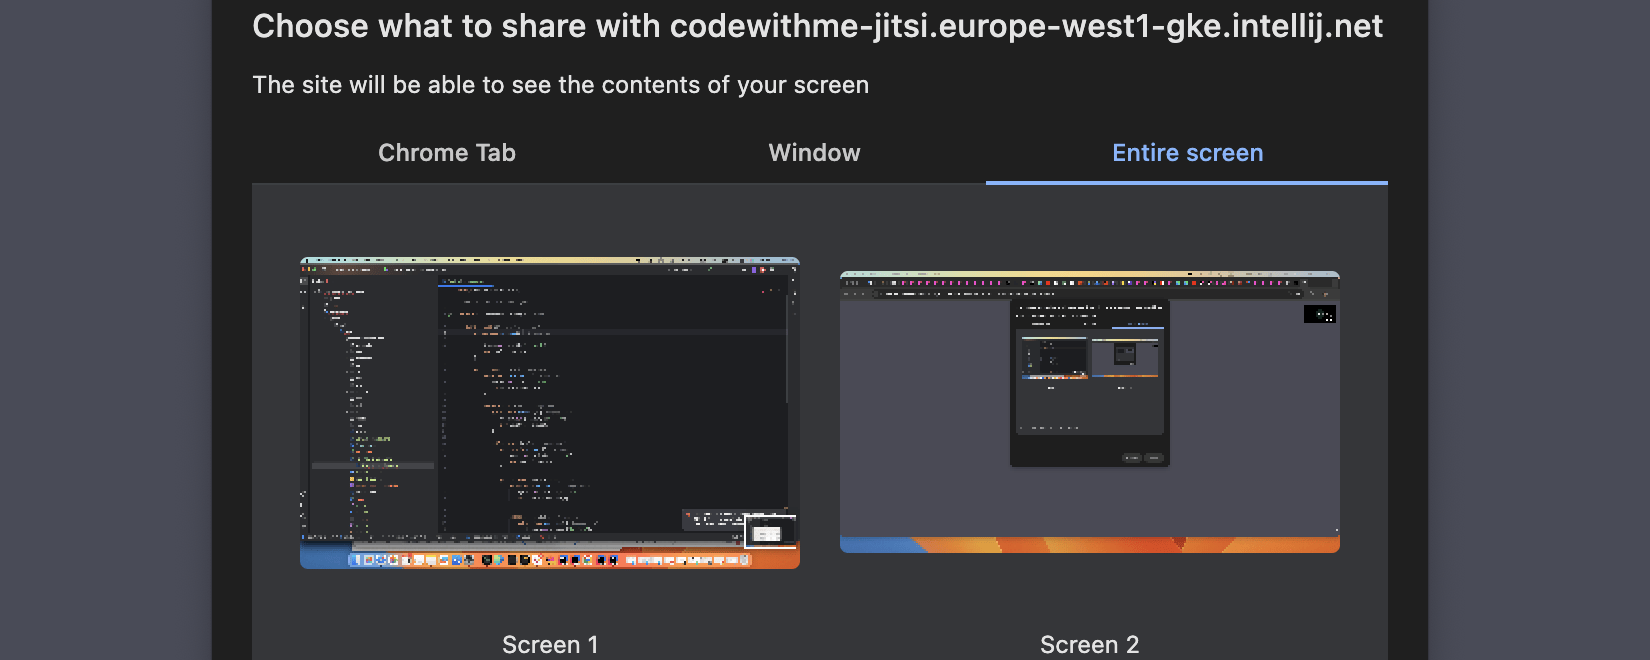
Enhanced screen sharing in Code With Me
Screen sharing in Code With Me calls is now redirected to the browser, allowing you to specify the sharing source – either a specific window or the entire screen. Previously, all screens and windows were shared by default, with no option to choose a specific source.
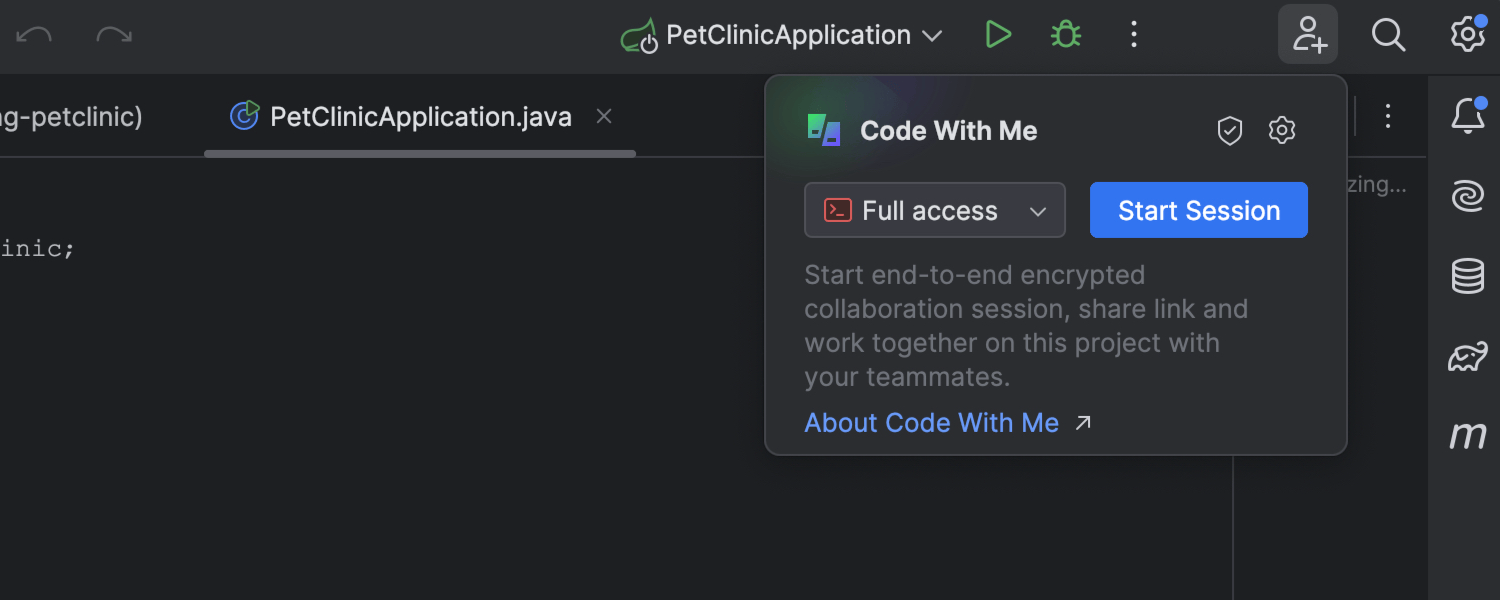
Simplified Code With Me session startup
The Code With Me session startup popup has been redesigned to streamline the process. It now includes all permission settings, reducing the steps required to start a new session, and permissions are preserved, allowing every session to start with just two clicks. Additionally, permissions can be changed during the session directly from the popup.
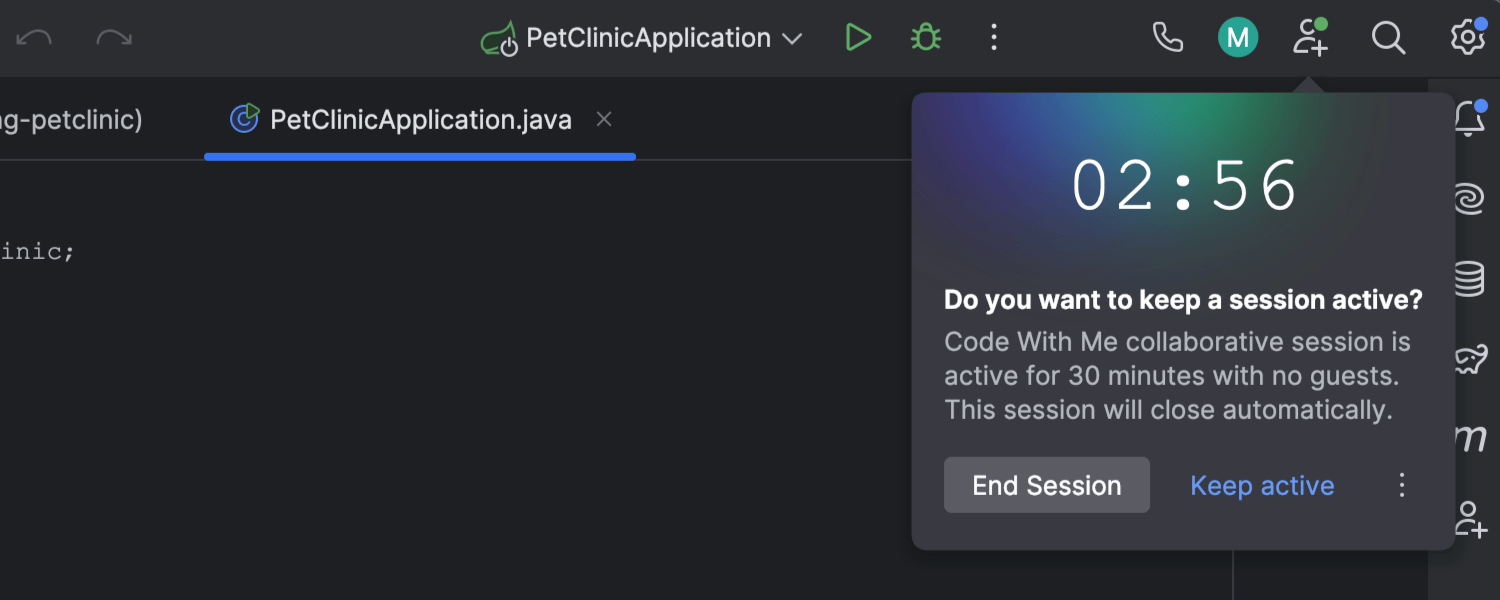
End Session popup
A popup will now appear if no one has joined your Code With Me session after 30 minutes. You can choose to end the session, keep it active, or close the popup. If no action is taken within three minutes of the popup appearing, the session will automatically end.
Database tools
AI Assistant features
Ultimate
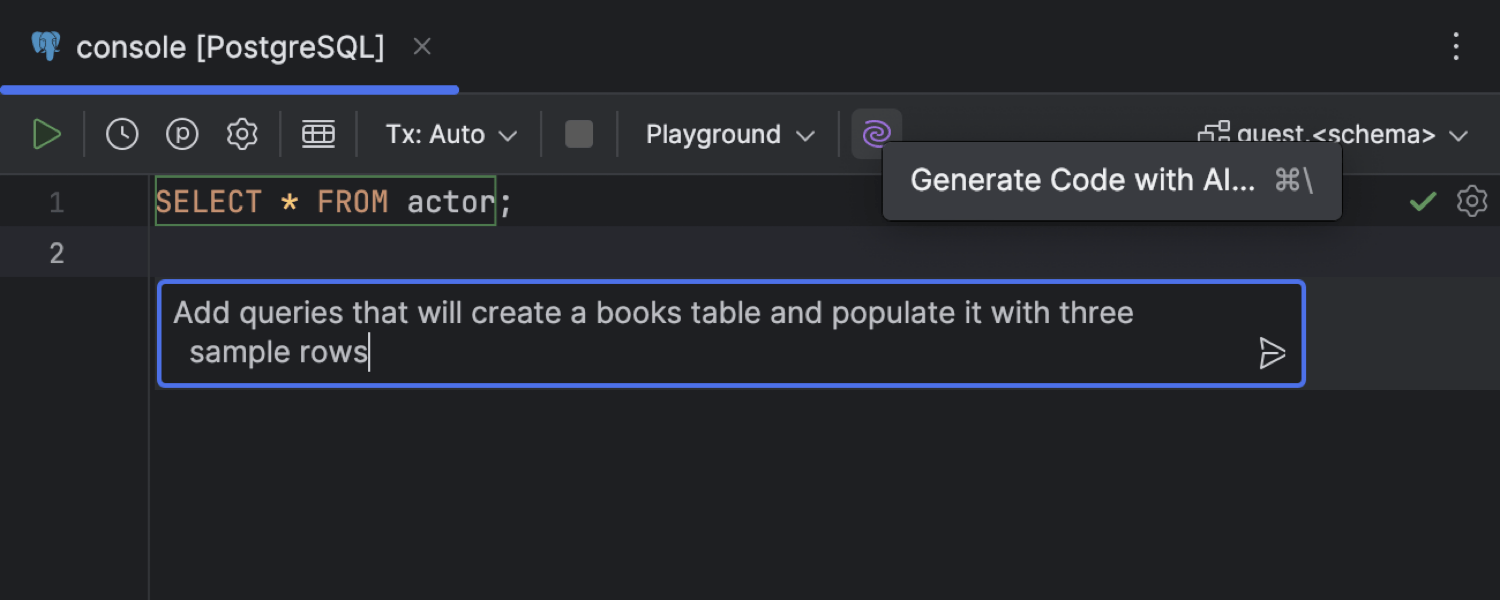
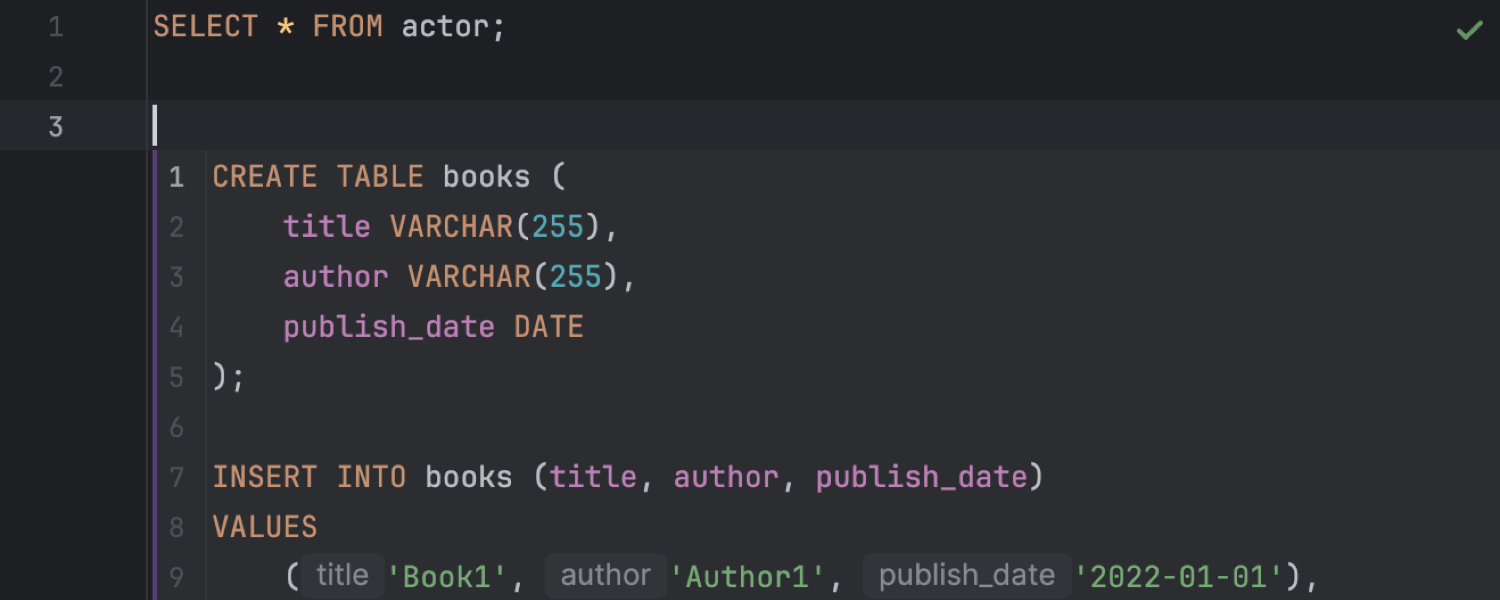
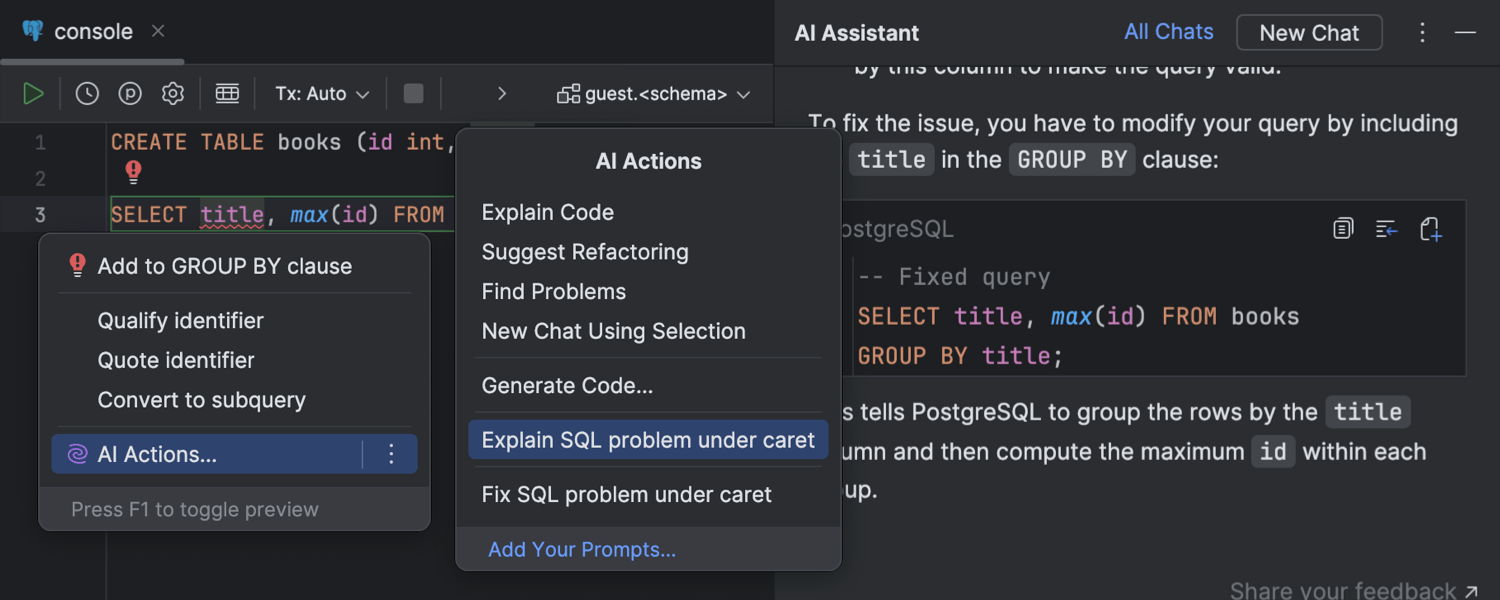
In this release, we’re introducing new AI Assistant features for databases. With the
text-to-SQL feature, you can generate SQL code directly in the editor by clicking
Generate Code with AI and entering your prompt. You can accept, recreate, or
refine the code, and take it to the AI chat if you have further questions.
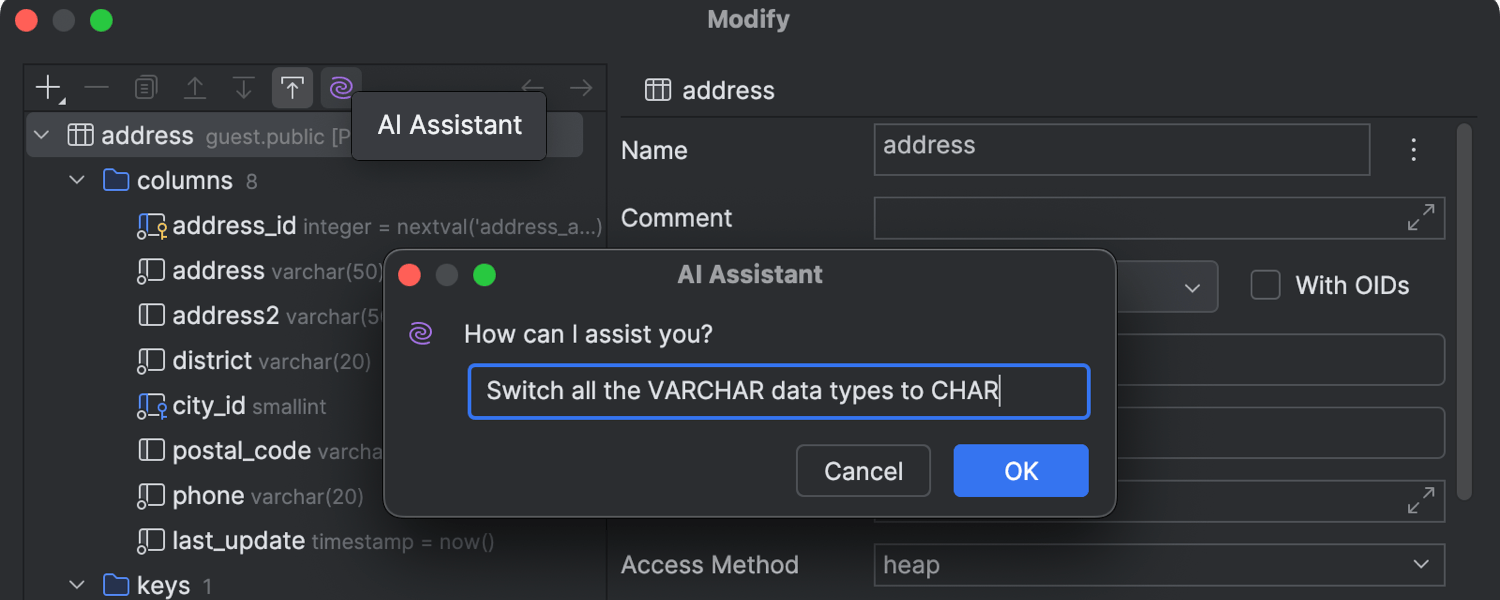
Additionally, AI Assistant can help with modifying tables, allowing you to request
changes like switching all VARCHAR data types to CHAR.
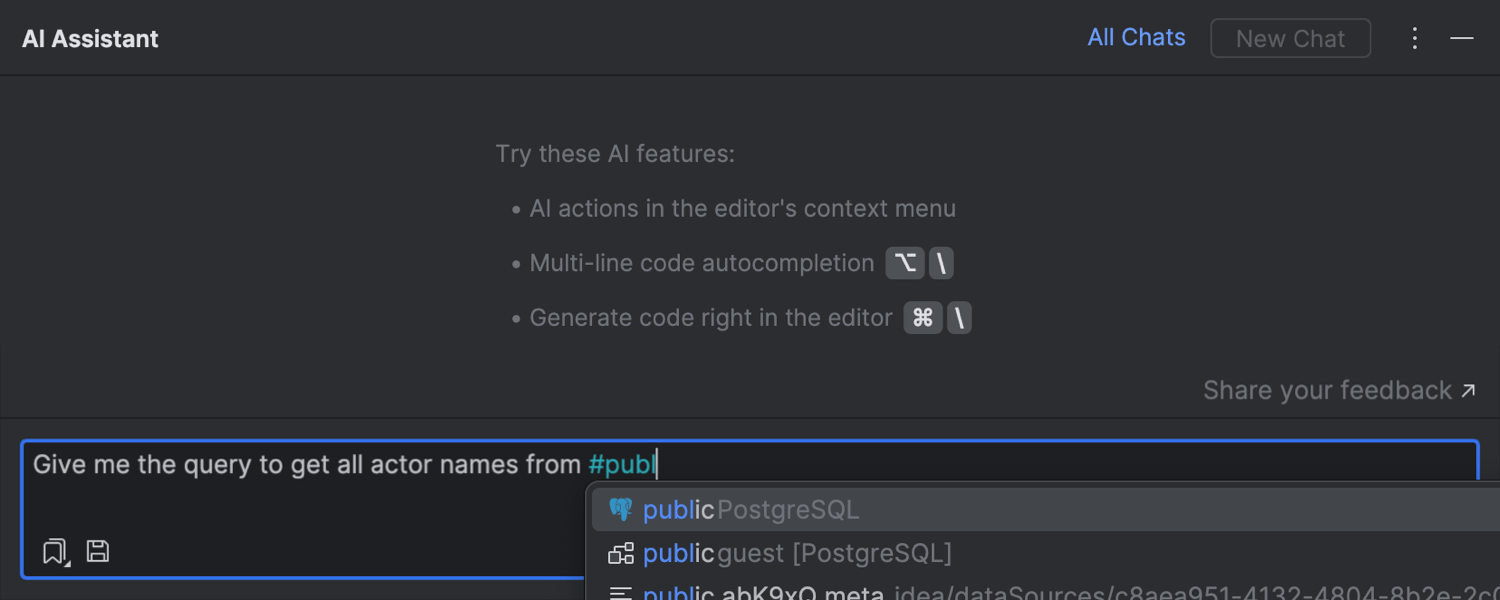
It can also help you understand and fix SQL problems, suggesting explanations and
fixes. In addition, you can attach your database schema to the AI chat by typing
# followed by the name of the database schema you want to add to the prompt.
Customizable data import via scripted loaders
Ultimate
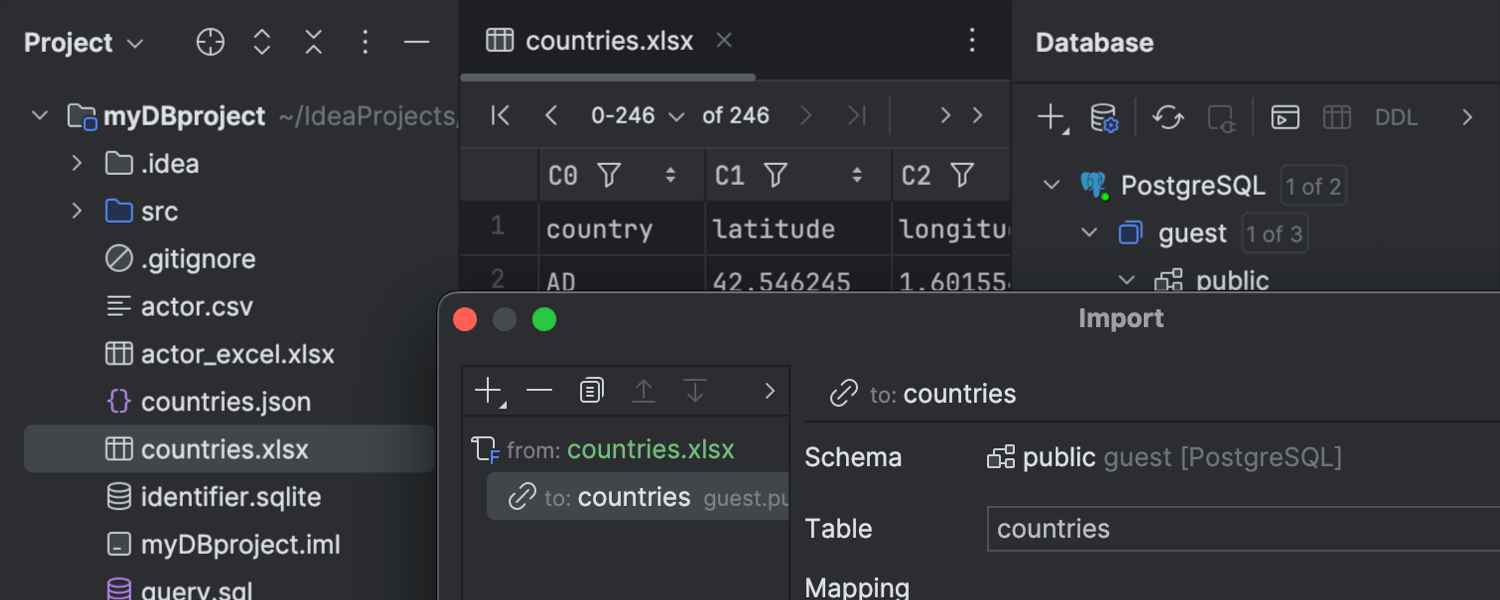
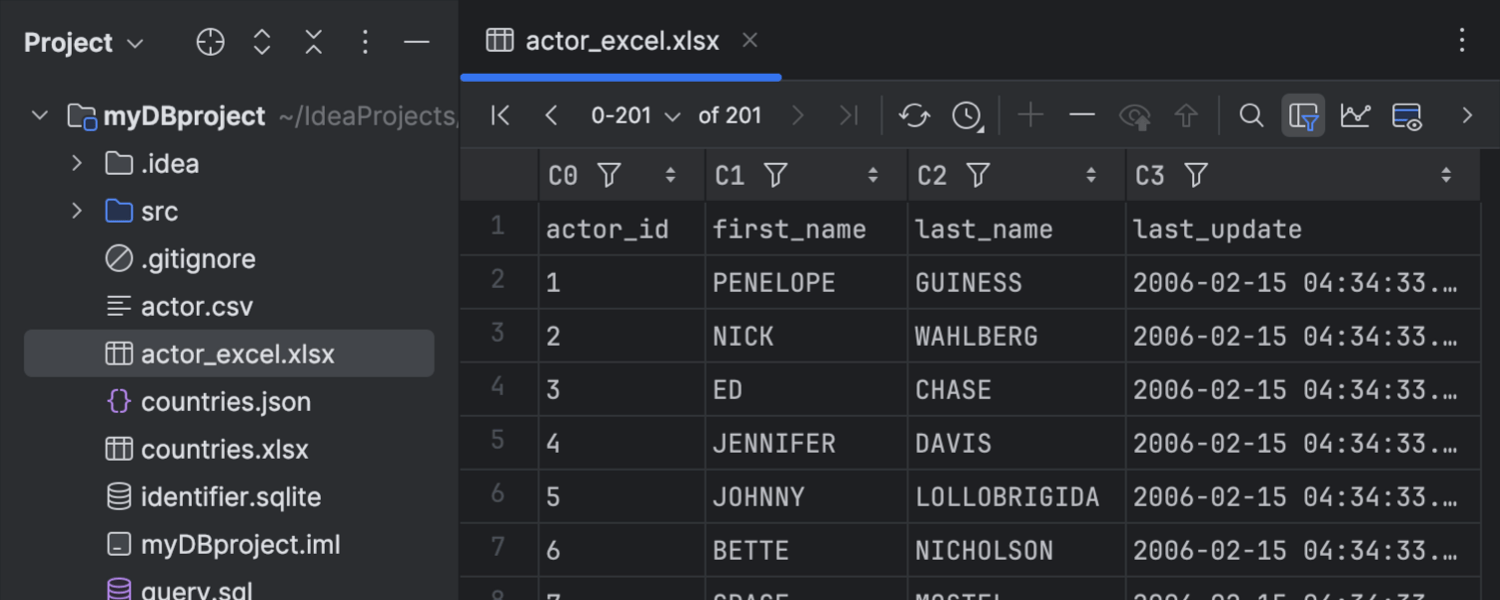
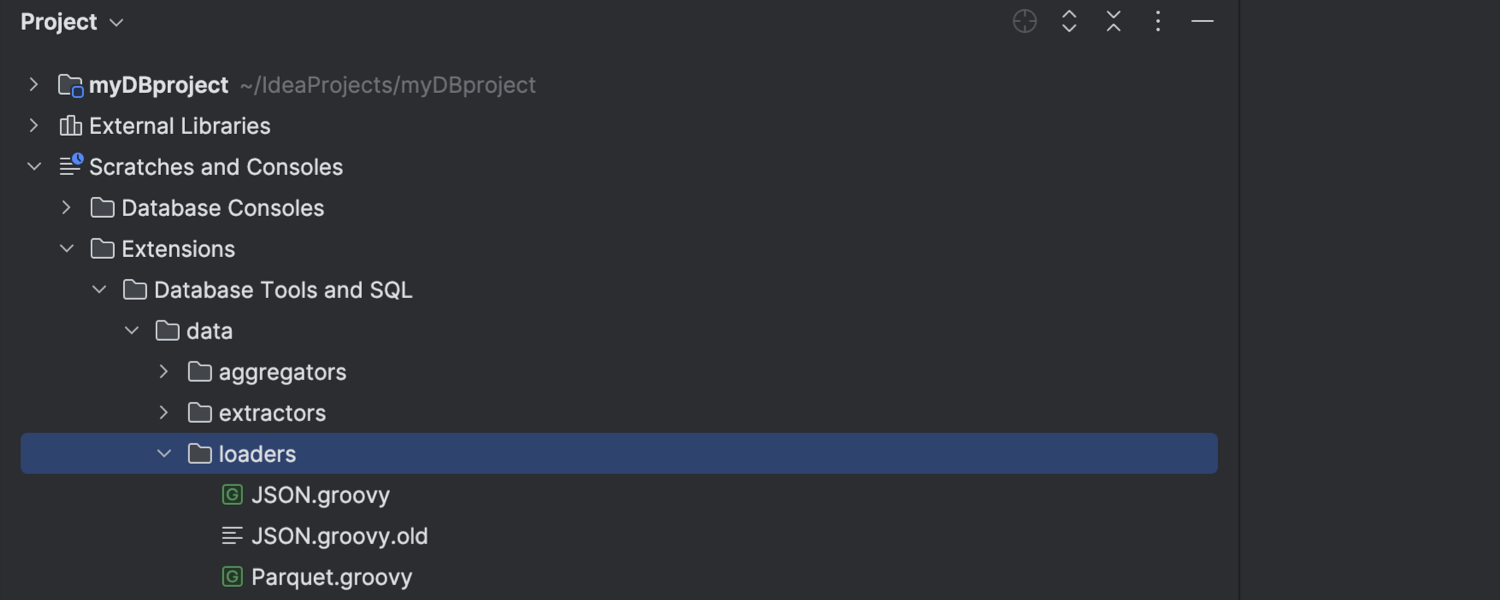
You can now import data from tabular files using customizable scripted loaders for the Excel, JSON, Parquet, and shapefile formats. Drag your file from the Project tool window to the schema in the database explorer and configure the settings in the Import dialog. In addition, you can view these files in the data editor with a single click in the Project tool window. To disable this behavior, go to Settings/Preferences | Advanced Settings | Open file as table if detected by scripted loader. You can also create custom loaders by placing them in Scratches and Consoles | Extensions | Database Tools and SQL | data | loaders.
Related Rows action in the floating toolbar
Ultimate
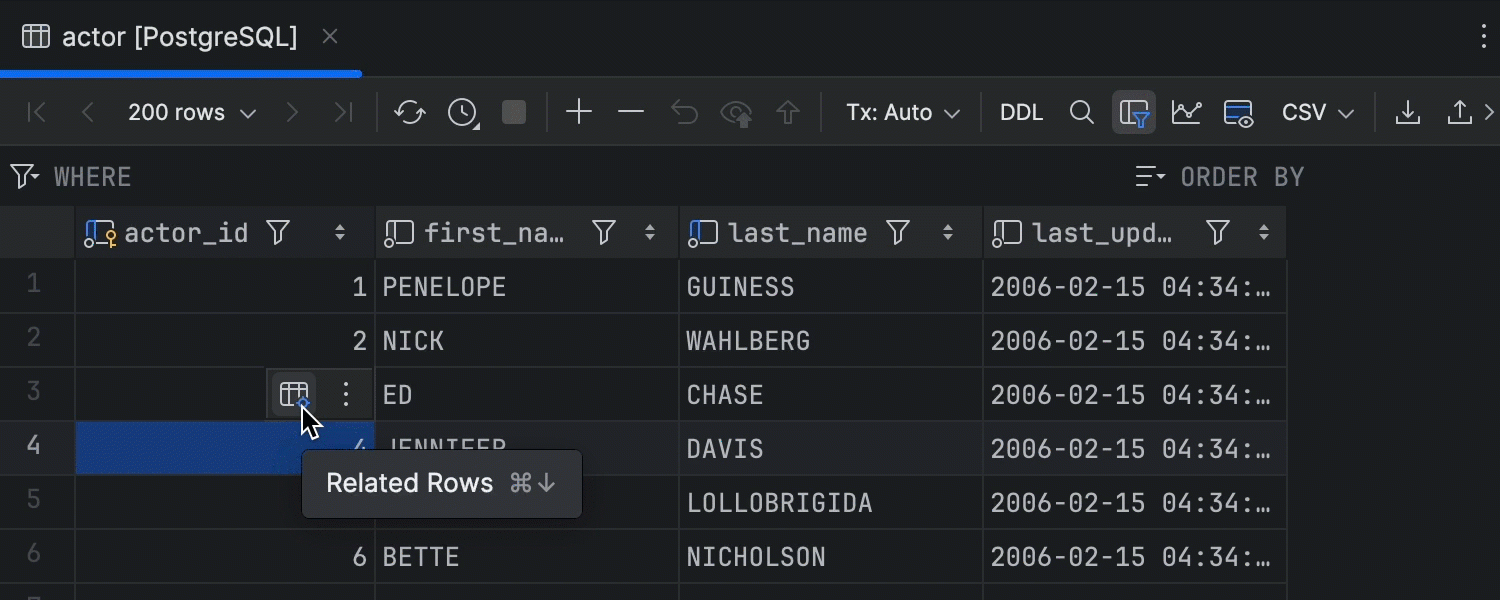
You can now easily access rows related to a given cell by selecting the cell and then clicking the Related Rows icon. You can specify whether this feature appears in the floating toolbar via the Customize This Toolbar option in the kebab (three vertical dots) menu. We’ve also moved the settings for the Related Rows action into Settings/Preferences | Advanced Settings. The Navigate and select first option shows all rows, highlighting the first ones referenced, while the Navigate and filter all option shows only the referenced rows.
Automatic value completion
Ultimate
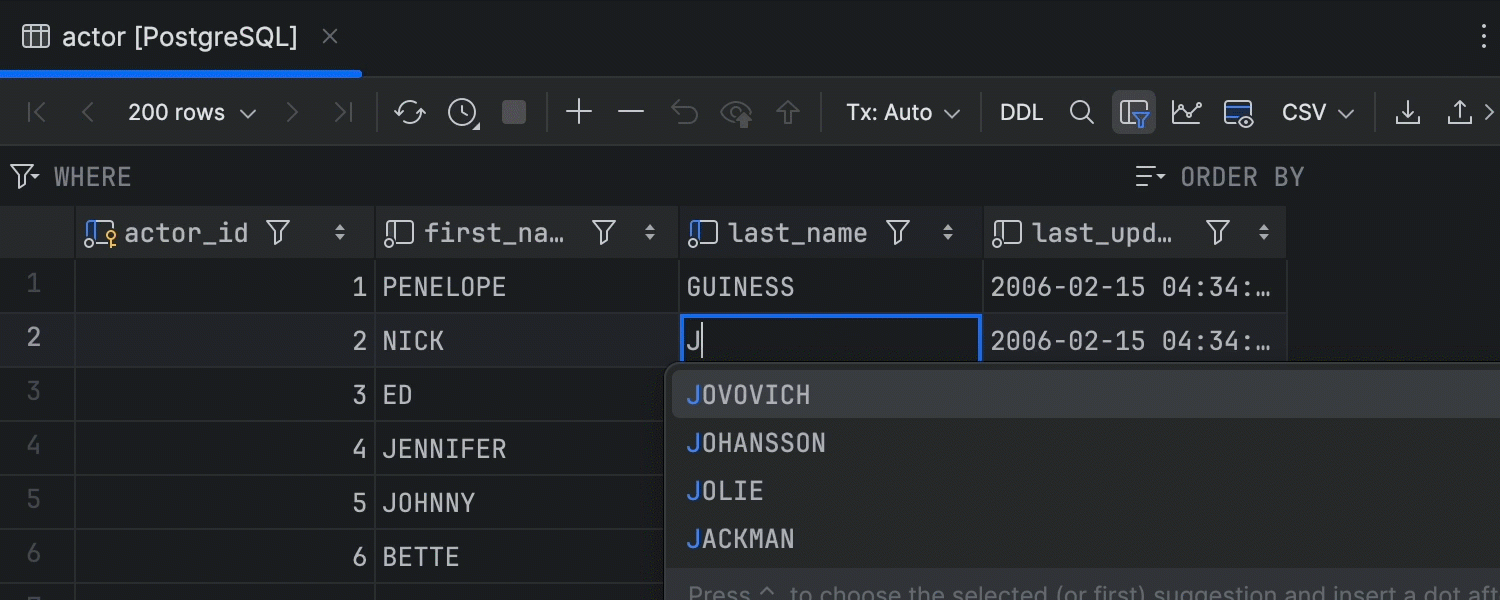
We've made value completion – a long-standing feature – automatic, and our performance tests show promising results. Keep in mind that this feature operates entirely locally, so completion variants are based on the other values already loaded in the current column.
Web development
Directly run and debug TypeScript files
Ultimate
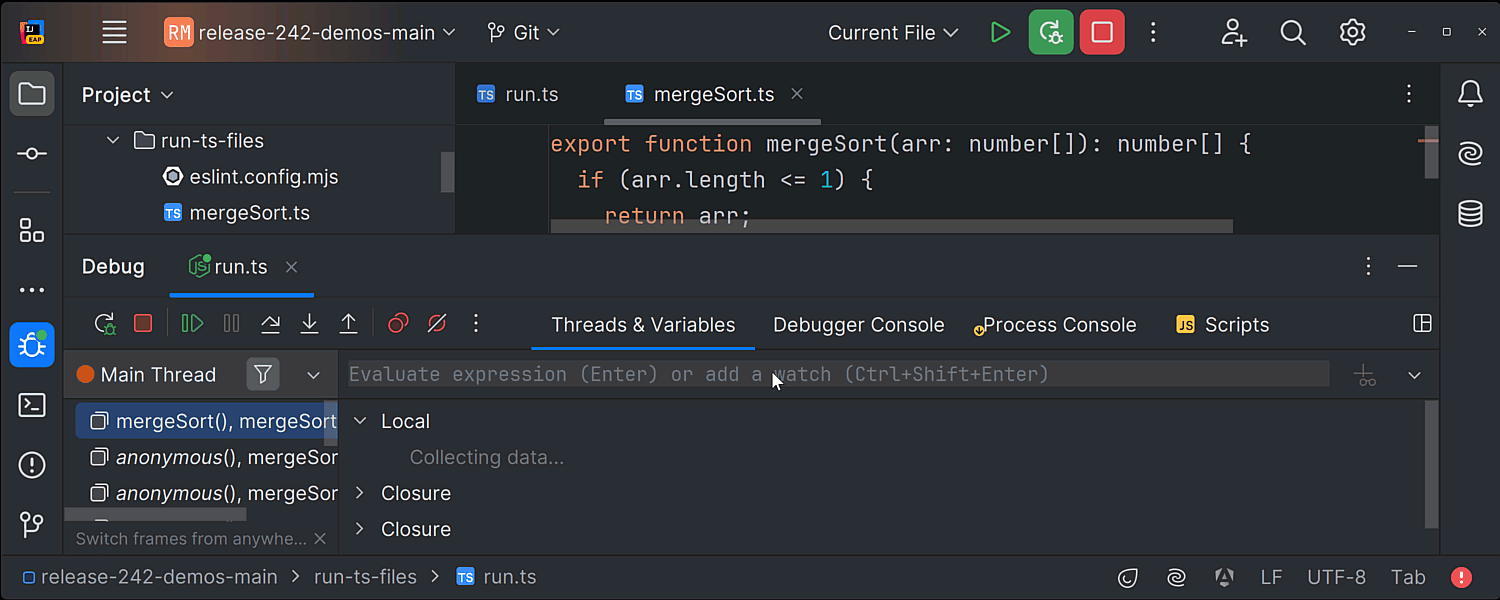
You can now run and debug TypeScript files without any additional setup. You can execute them from different entry points, including the file context menu, the Run widget, and the Current File configuration.
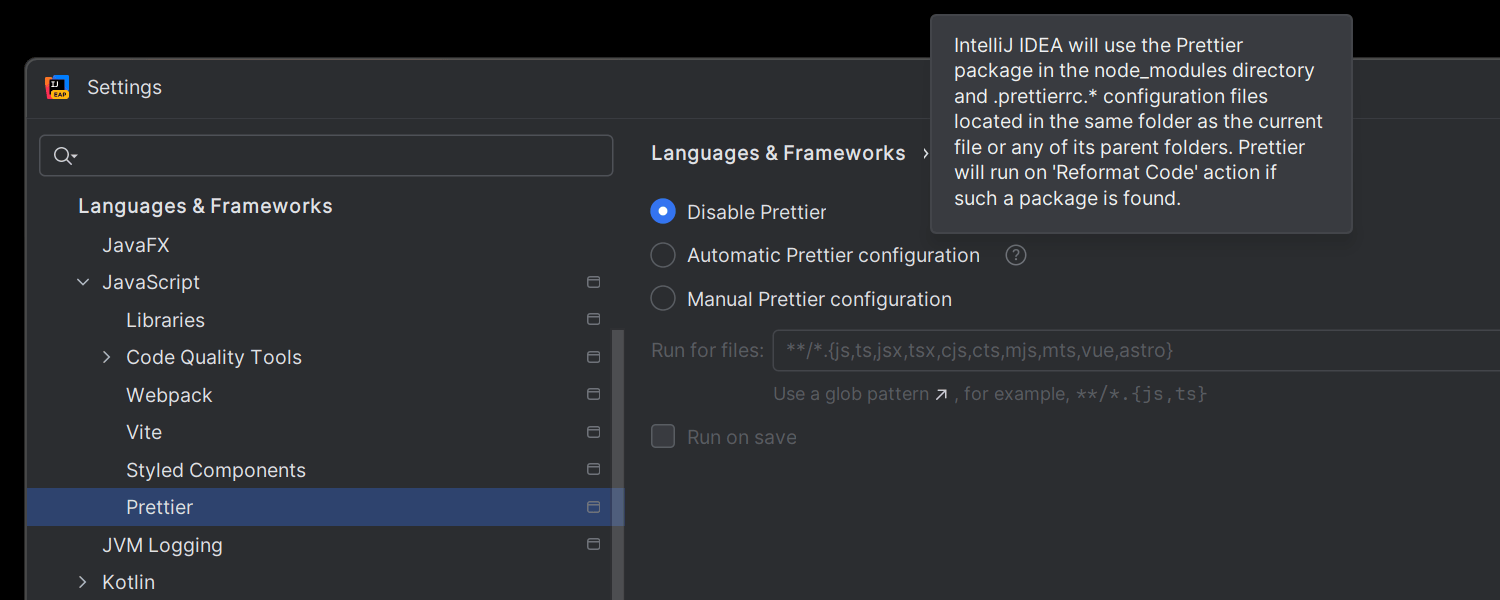
Prettier integration is enabled by default
Ultimate
In IntelliJ IDEA Ultimate 2024.2, Prettier integration is enabled in new projects
with a direct prettier dependency in their root package.json
and a Prettier configuration file at the same level. This feature simplifies the
setup process, ensuring that Prettier integration is enabled out of the box.
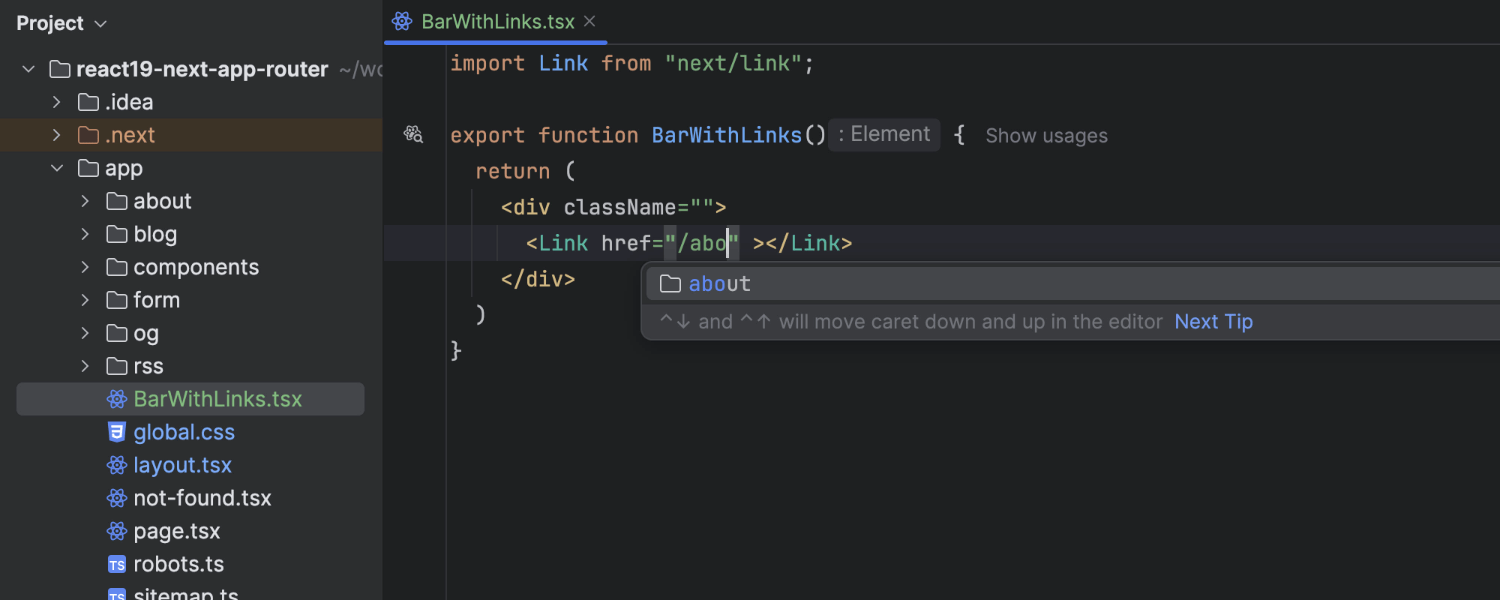
Improved support across major web frameworks
Ultimate
IntelliJ IDEA Ultimate 2024.2 is able to resolve paths for frameworks that use file-system-based routing. It can resolve link paths based on your project's file system, providing autocompletion and navigation for Next.js, Nuxt, SvelteKit, and Astro. There is also support for new Svelte 5 snippets and render tags. Additionally, we’ve implemented language server protocol (LSP) support for Astro and Vue Language Service v2, improving code completion and the overall developer experience.
JetBrains Runtime
Switch to JBR21
We’re transitioning from JetBrains Runtime 17 (JBR17) to JetBrains Runtime 21 (JBR21). Starting with IntelliJ IDEA 2024.2, all IDE updates will come with JBR21, offering enhanced security and performance as well as Wayland rendering support for Linux.
Other
Bundled localization plugins
To improve the IDE experience for native speakers of Chinese, Korean, and Japanese, we’ve bundled the support for these languages. The language settings are available in Settings/Preferences | Appearance & Behavior | System Settings | Language & Region.