Endpoints tool window
If the application that you are developing uses an Express, Next.js, or GraphQL, you can get an overview of route handlers in the Endpoints tool window. The tool window can assist you when developing microservices and backend-frontend communication. It is also helpful for exploring third-party APIs.
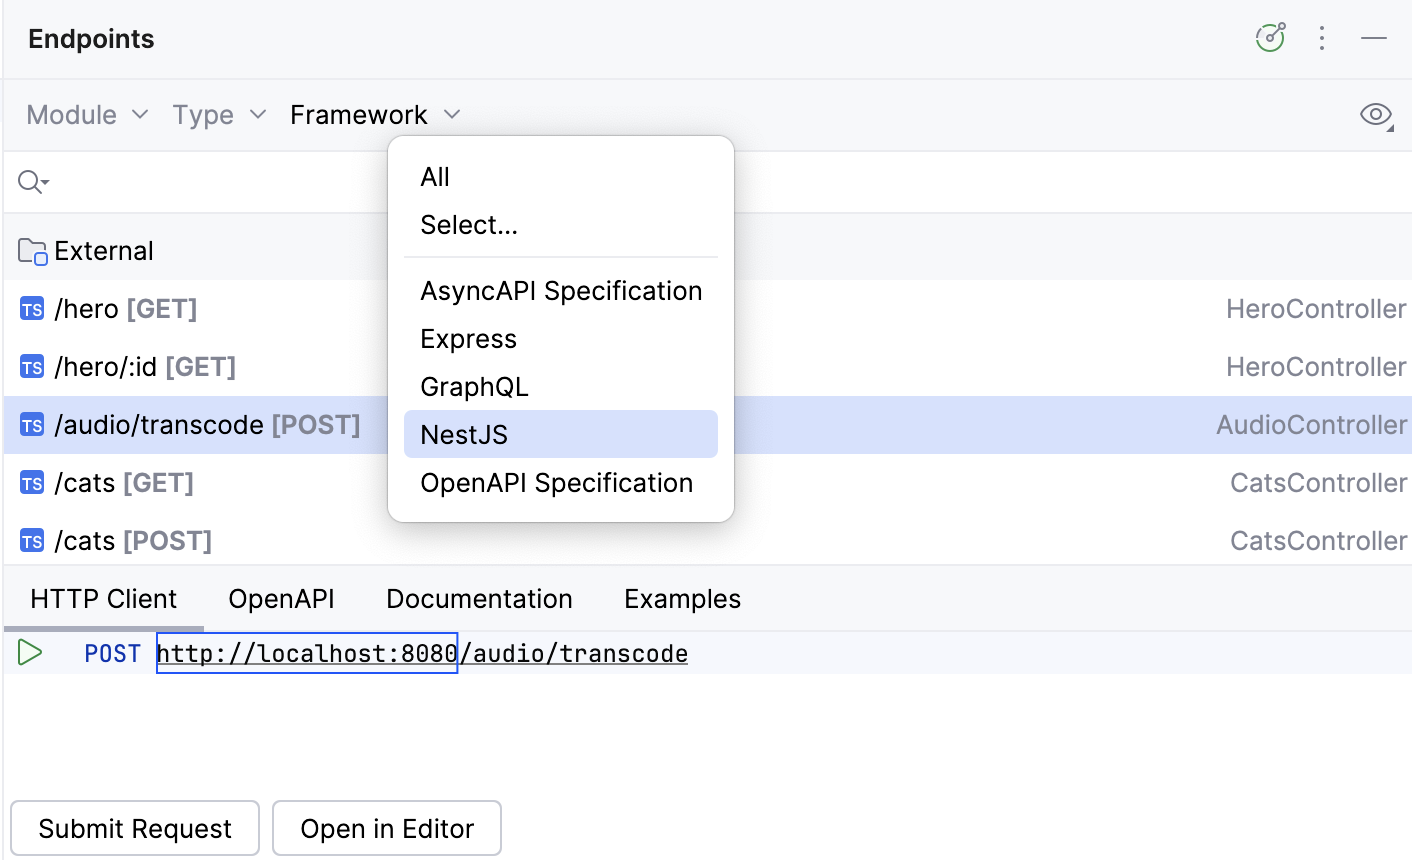
To navigate to the endpoint declaration from the Endpoints tool window, do one of the following:
Select Jump to source from the endpoint's context menu.
Select the endpoint and press F4.
Double-click the endpoint.
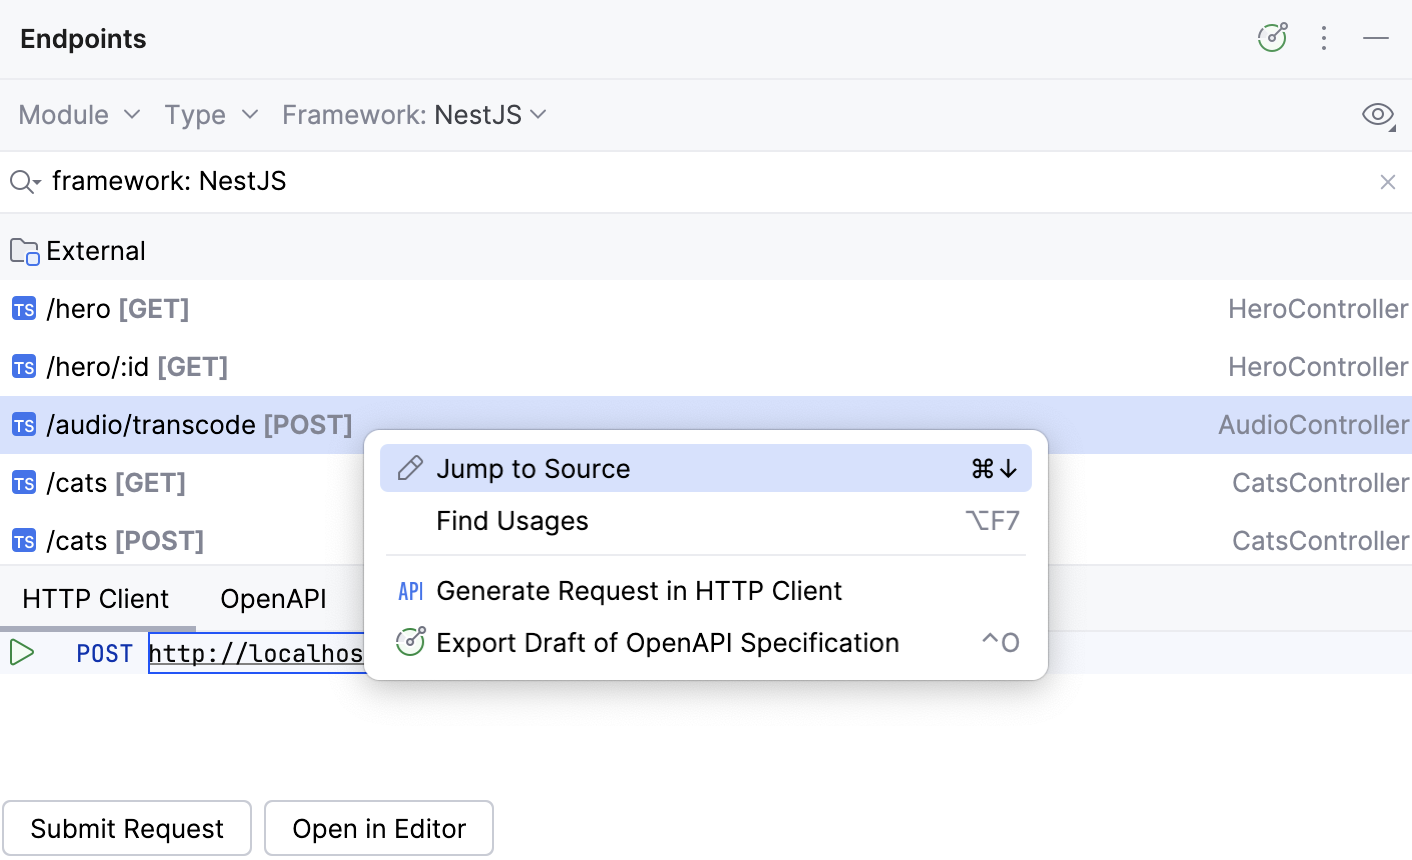
In the Endpoints tool window, you can filter the list of endpoints by module, type, and framework. To list endpoints from external sources , select External under Module.
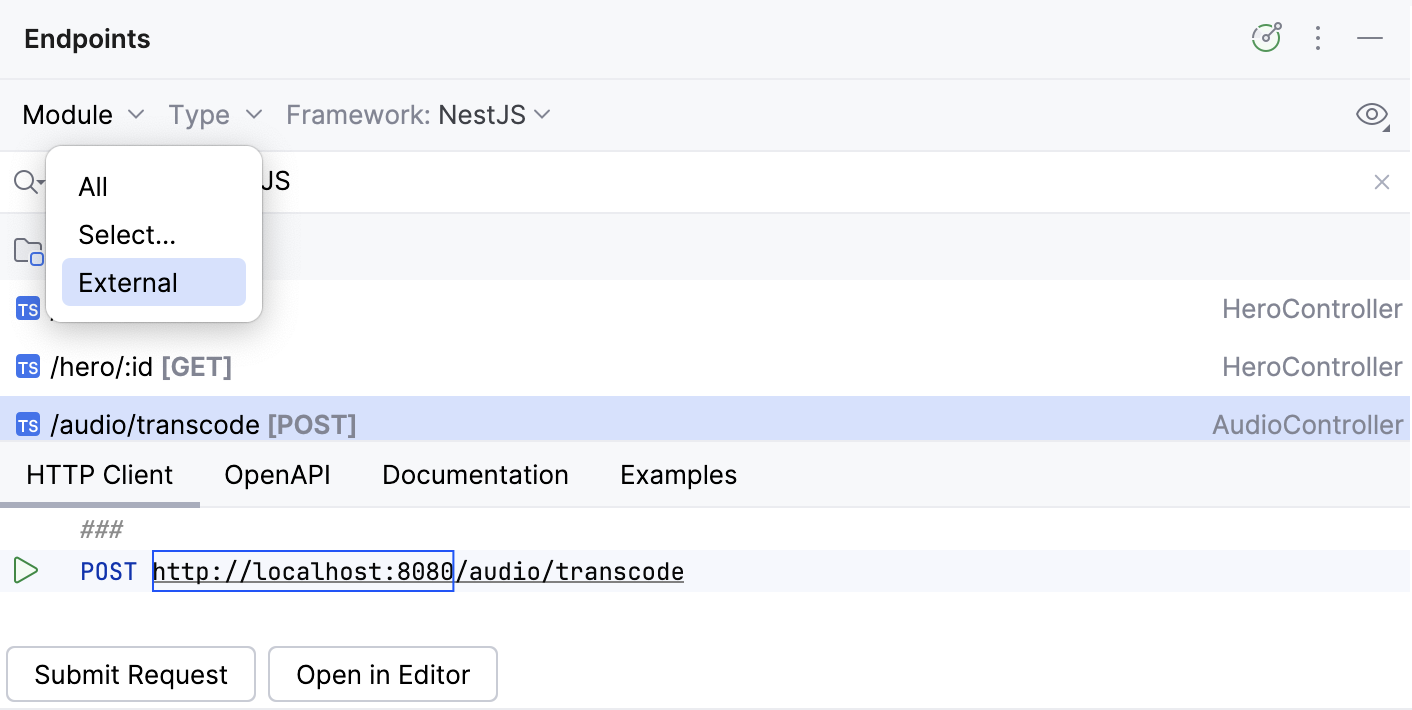
Endpoints marked as deprecated appear with a strikethrough (crossed out).
Before you start
By default, the Endpoints tool window is not available in WebStorm.
To add the Endpoints tool window, install the Endpoints plugin on the Settings | Plugins page, tab Marketplace.
To work with REST APIs, install the OpenAPI Specifications plugin (Settings | Plugins page, tab Marketplace).
For more information, refer to Install a plugin from Marketplace.
Toolbar
Item | Description |
|---|---|
Module | Filter endpoints by module or select an external module |
Type | Filter endpoints by type |
Framework | Filter endpoints by framework |
Configure OpenAPI Sources: Add an external OpenAPI specification (for example, from SwaggerHub) to include endpoints from this specification in the Endpoints tool window and highlight them with a yellow background. In the OpenAPI Specifications window that opens, click 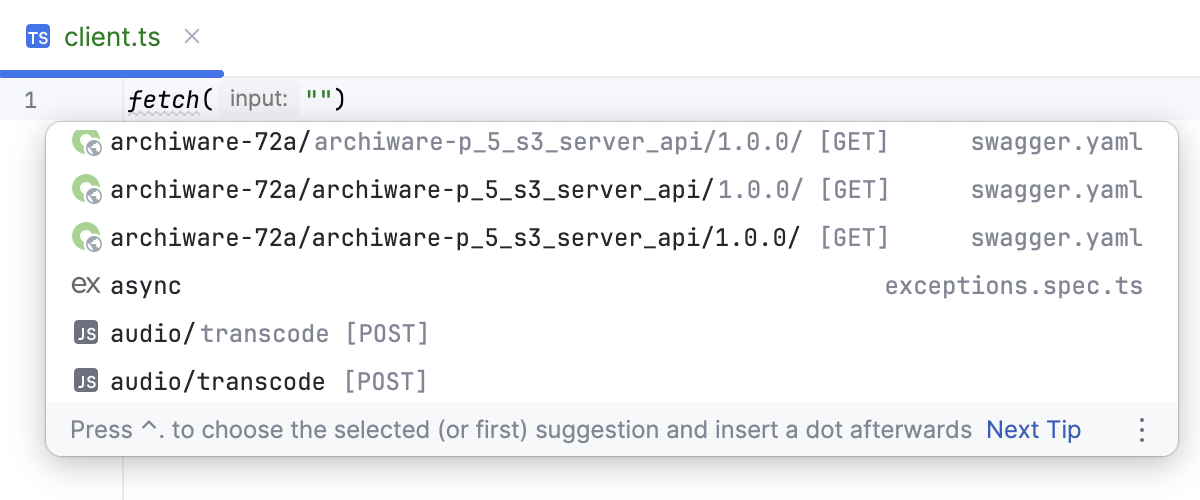 Learn more from Working with REST APIs in WebStorm. | |
Show and hide the details panel | |
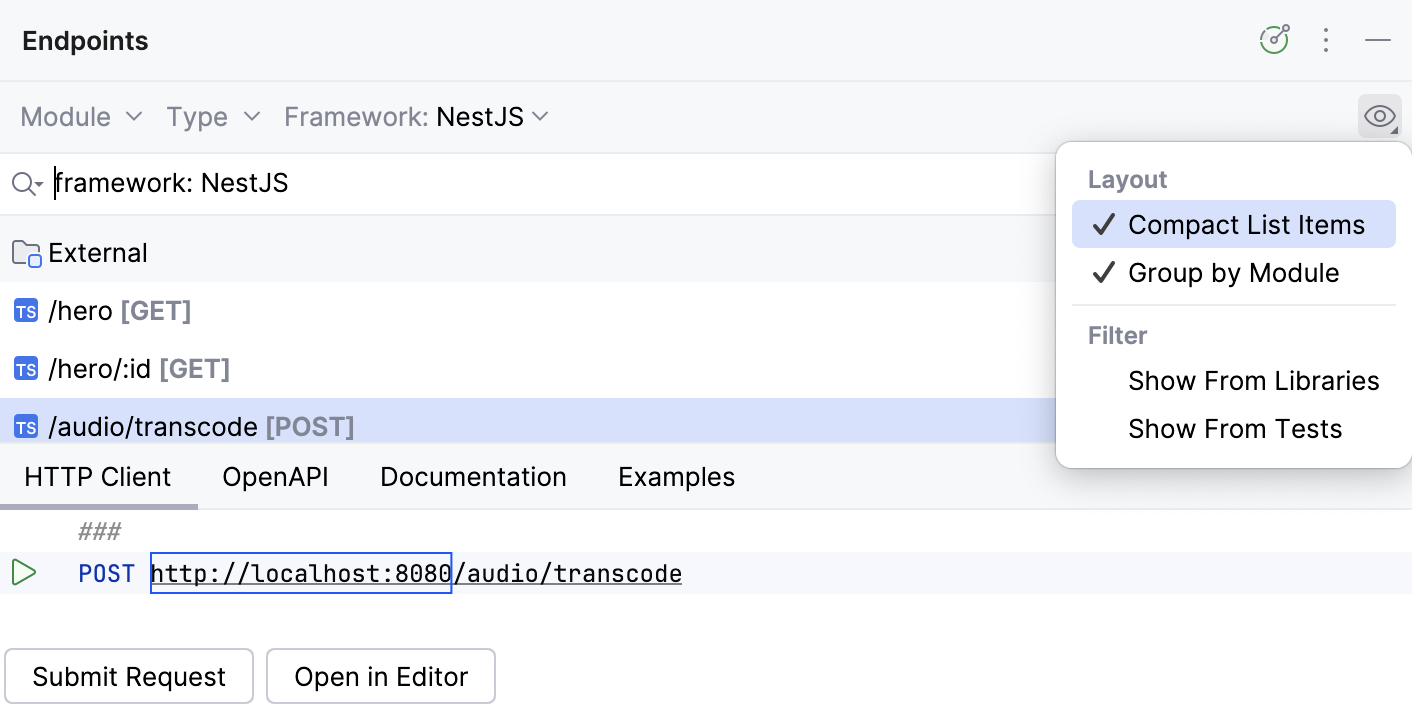
Configure the tool window layout and filters:
|
Endpoint details
When you select an endpoint, you can see the details in the dedicated pane. Use or
to show and hide the details pane.
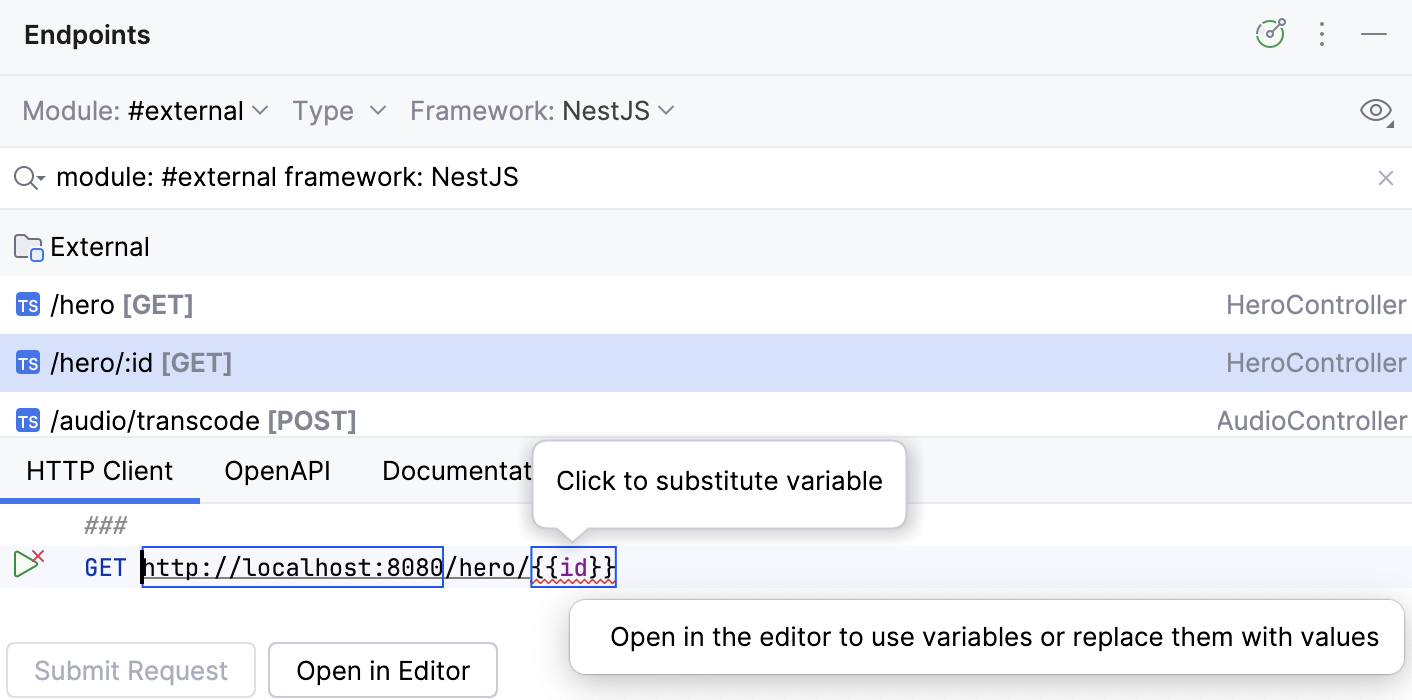
Shows the generated HTTP or gRPC request for the selected endpoint.
If the corresponding server is running, you can click Submit Request to see the response immediately or Open in Editor to edit it in a separate HTTP requests file in the editor. For more information, refer to HTTP Client.
Shows the generated OpenAPI specification for the selected endpoints.
You can also generate an OpenAPI specification for an entire module: right-click a module in the Endpoints tool window and select Export Draft of OpenAPI Specification.
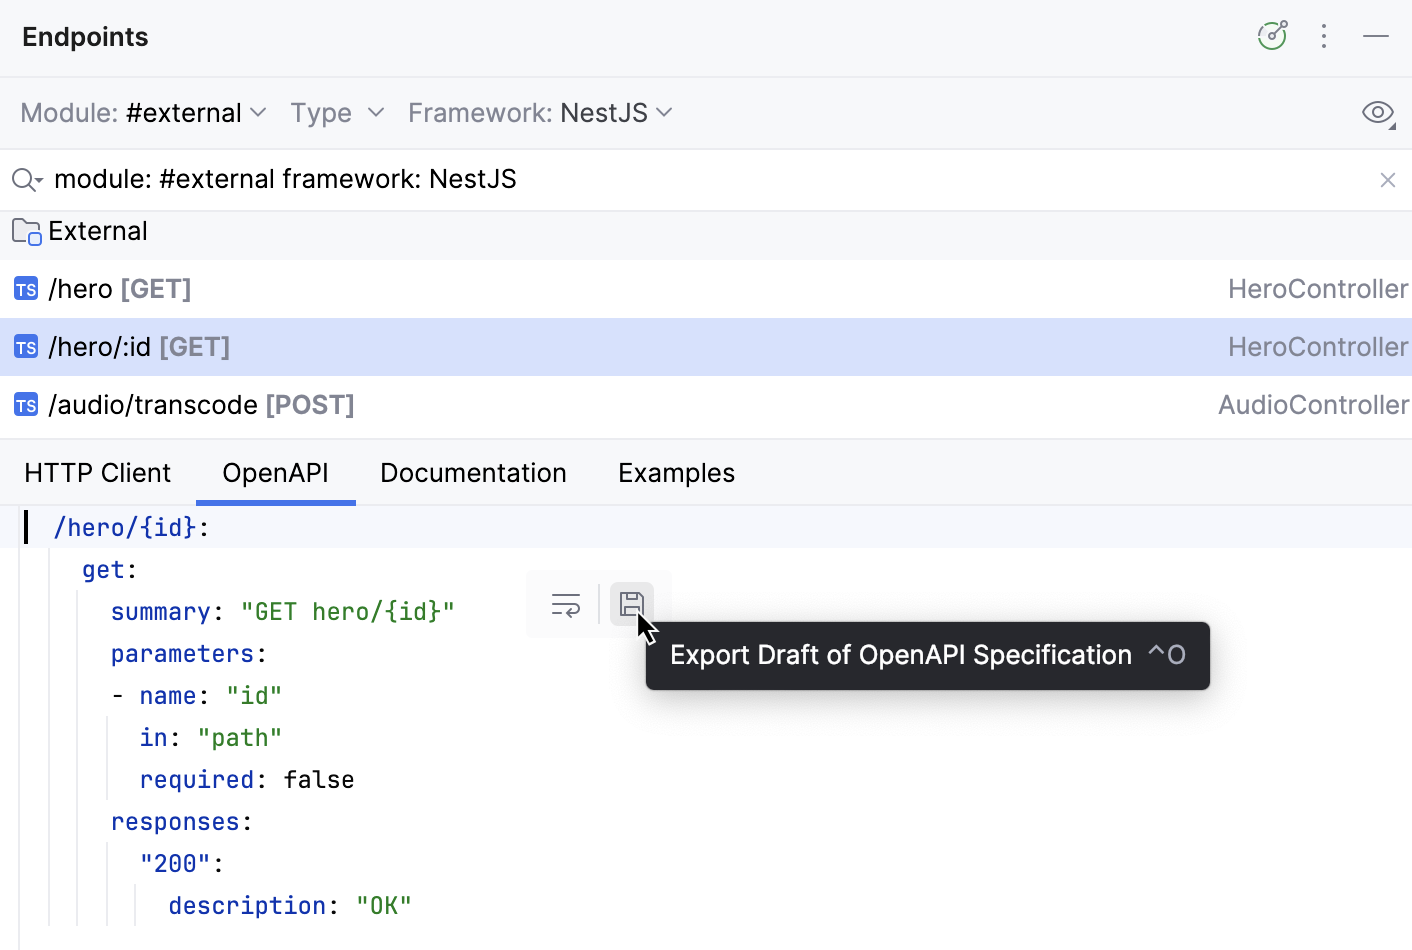
To preview the specification in a separate file, click .
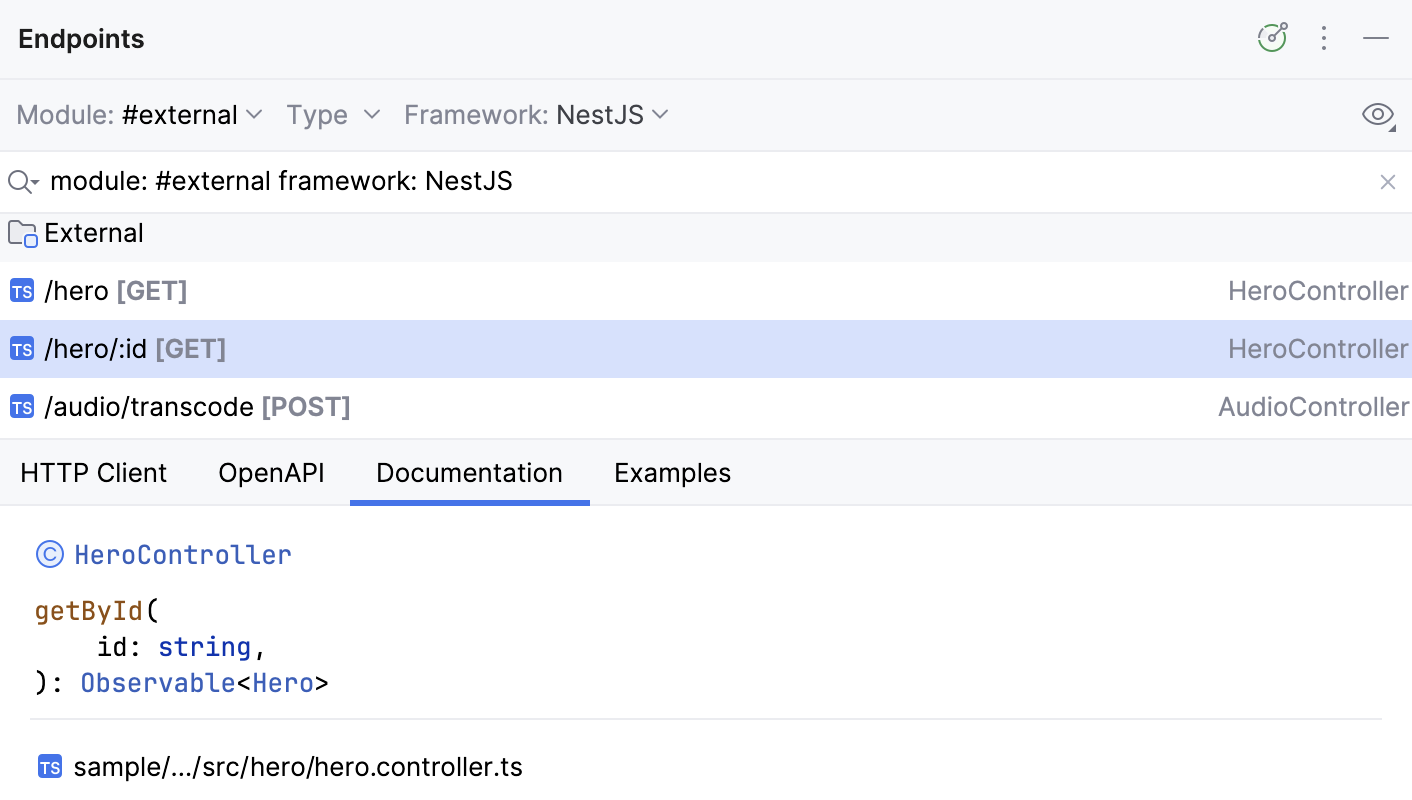
Shows the documentation for the selected endpoint. Double-click an endpoint to navigate to its source code.
Provides examples of client code to access the selected endpoint. Use the Frameworks list to select a framework or a language in which you want to show code.
For Retrofit and Ktor, you can also click and select Show Boilerplate Code to complete the request sample with all the necessary code elements, such as import statements and HTTP Client instance.
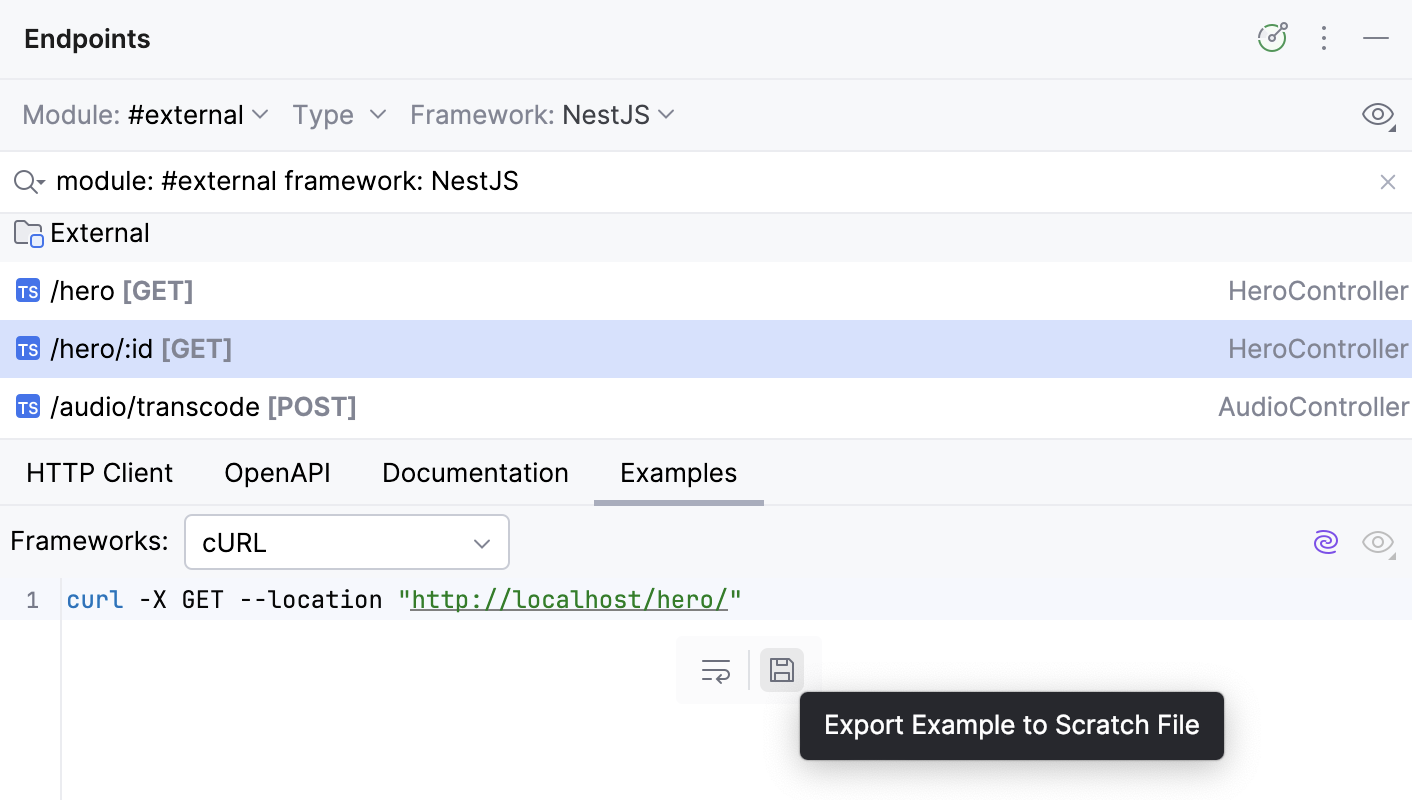
To save the code sample into a file, hover over the code and click . This will save the code into a new scratch file.