Bun
WebStorm integrates with Bun, thus enabling you to run and debug JavaScript and TypeScript files with it as well as to use it as a package manager.
Before you start
Make sure the Bun bundled plugin is enabled in the Installed tab of the Settings | Plugins page as described in Install plugins.
Install Bun
Install Bun as described on the Bun official website.
Configure Bun
Press Ctrl+Alt+S to open settings and then select .
From the Preferred runtime list, select Bun.
In the Bun area, specify the path to the Bun executable file.
The path to the Bun executable file defaults to your
PATHenvironment variable, so if you leave the Bun field empty, the debugger attempts to detect the Bun executable file automatically.
Set Bun as the project package manager
In the Settings dialog (Ctrl+Alt+S) , go to . The JavaScript Runtime page opens.
In the Package manager field, specify the Bun installation.
Select bun to use the system default installation.

To use a custom installation, click Select, and choose the installation folder from the list, learn more from Choose a project package manage
Run and debug with Bun
WebStorm supports the Debug Adapter Protocol (DAP), introducing the debugging experience.
With Bun, you can run and debug both JavaScript and TypeScript files.
Start running or debugging with Bun from the editor
If you have specified Bun as your default project package manager as described above, you can run and debug JavaScript and TypeScript files right from the editor. In this case, WebStorm creates a temporary run/debug configuration that you can save and use later.
To run a file, select Run '<file name>' from the context menu.

To debug a file, set the breakpoints where necessary and select Debug '<file name>' from the context menu.

Run and debug with Bun via a run/debug configuration
Create a Bun run/debug configuration
Go to . Alternatively, select Edit Configurations from the Run widget on the toolbar.

In the Edit Configurations dialog that opens, click the Add button (
 ) on the toolbar and select Bun from the list.
The Run/Debug Configuration: Bun dialog opens.
In the File field, specify the path to the main file of the application that starts it. Specify the required JavaScript or TypeScript file or use a macro, for example,
$FilePath$.Optionally:
In the Bun parameters field, specify Bun CLI options, for example,
--watchor--hot, learn more from the Bun official website.Select the Stop on Entry checkbox to have the application execution stop at the first line.

Run your application
Create a Bun run/debug configuration as described above.
From the Run/Debug Configurations widget list on the toolbar, select the newly created Bun configuration and click
 next to it.
Start debugging
Set the breakpoints in the code where necessary.
Create a Bun run/debug configuration as described above.
From the Run widget list on the toolbar, select the newly created Bun configuration and click
 next to it.
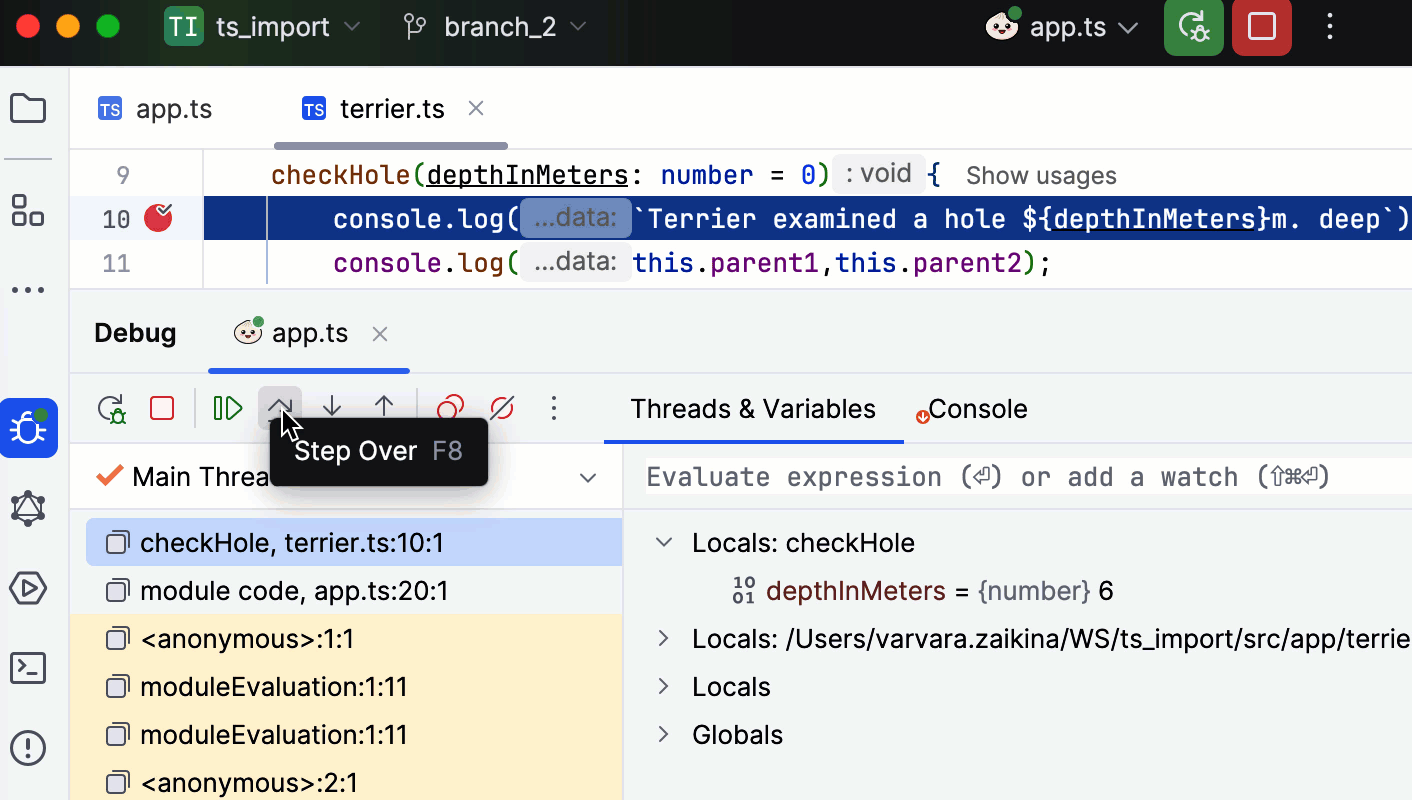
The Debug tool window opens.
Perform the steps that will trigger the execution of the code with breakpoints and switch to WebStorm, where the controls of the Debug tool window are now enabled. Proceed with the debugging session — step through the breakpoints, switch between frames, change values on-the-fly, examine a suspended program, evaluate expressions, and set watches.