Statistic Charts
To help you track the condition of your projects and individual build configurations over time, TeamCity gathers statistical data across all their history and displays it as visual charts. The statistical charts can be divided into the following categories:
Project-level statistics available on the Project Home | Statistics tab.
Build Configuration-level statistics available on the Build Configuration Home page | Statistics tab.
Regardless of the selected statistics level in the Statistics tab, you can:
Use the branch filter to view the results from the specified branches only.
Download each chart data in the CSV format using the
icon.
Configure the Y-axis settings for each chart using the
icon in the upper left corner.
Select a time range for each type of statistics from the Range drop-down menu.
Filter the information by data series, for example, by the Agent name or result type.
View average values by selecting the Average checkbox.
Filter out failed builds and show only successful builds with the unchecked Show Failed option.
View the build summary information when you mouse-over a build and navigate to the build results page using the build number link.
Project Statistics
For each project TeamCity provides visual charts with statistics gathered from all build configurations included in the project over the entire history of the project. These charts show statistics for code coverage, code inspections and code duplicates for build configurations within the project when the corresponding data is available for the builds of this project's configurations.
You can adjust the project-level charts in the following ways:
Build Configuration Statistics
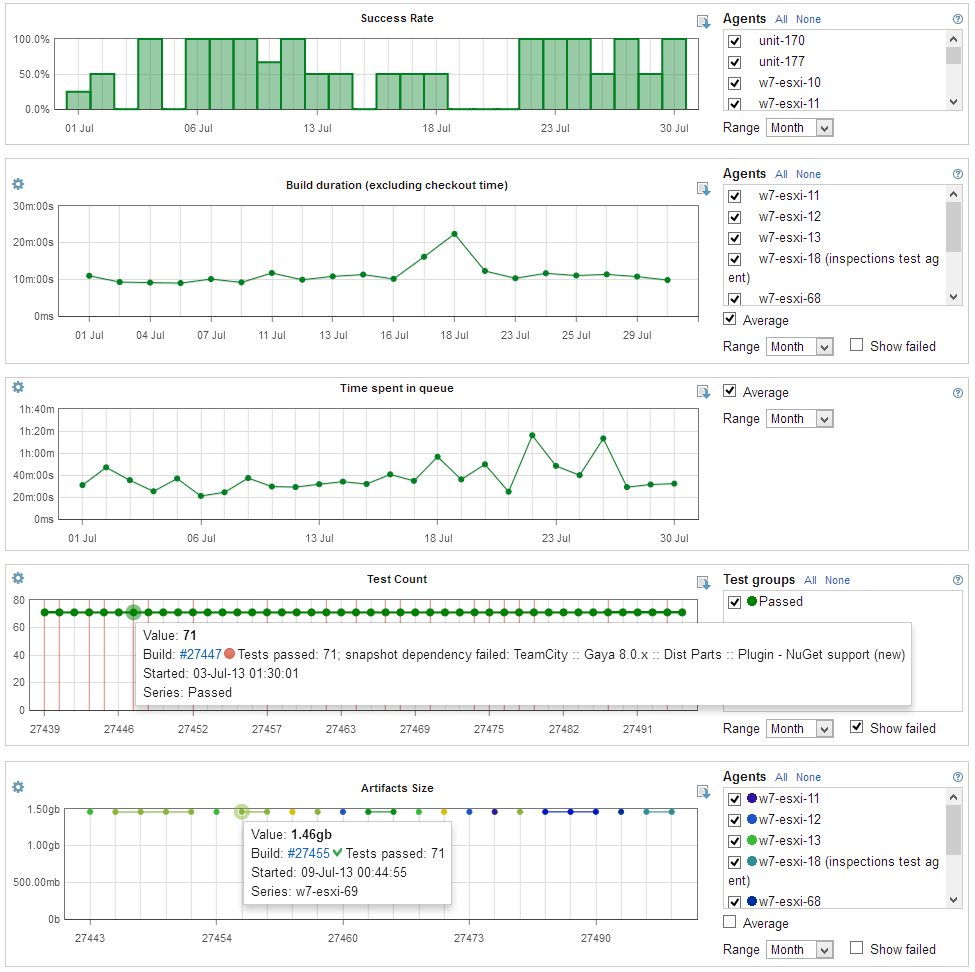
Statistics information is also available at the build configuration level. These charts demonstrate the successful build rate, the build duration, time builds spent in the queue, time spent on fixing tests, artifact size, and test count. The charts also show code coverage, duplicates and inspection results if these are included in the respective build configuration.

It is also possible to add custom charts. Unlike project-level charts, predefined charts on the build configuration level cannot be disabled.
If the " Show all personal builds " option is enabled in your user profile, you can toggle the display of personal builds on the graph by clicking the " Show personal " option.
The charts generated automatically by TeamCity include the following types:
Success Rate
This chart tracks the build success rate over the selected period of time.
Build Duration (excluding the checkout time)
This chart allows the viewer to monitor the duration of the build. To get a better idea of the build duration changes, select a single build agent or build agents with similar processors.
Time Spent in Queue
This chart tracks the time it took to actually start a build after it was scheduled. This information is helpful for managing the build agent and prioritizing build configurations.
Test Count
Green, grey and red dots show the number of tests (JUnit, NUnit, TestNG, and so on) that passed, were ignored, or failed in the build respectively. All invocations of the same test within a single build are counted as one test. The information about individual tests is available on the build results page.
Artifacts Size
This chart tracks the total size of all artifacts produced by the build.
Time to Fix Tests
Time to fix a test is reported for a finished build with a newly failed test when a subsequent build where this test passed finishes (this means that the metric can updated in a finished build on new builds finishing). The time is calculated as the difference between the start times of these builds.
This chart tracks the maximum amount of time it took to fix the tests of a particular build. If not all build tests were fixed, a red vertical stripe is displayed.
Code Coverage
Blue, green, dark cyan, and purple dots show respectively the percentages of the classes blocks, lines and methods covered by the tests.
Code Duplicates
This chart tracks the number of duplicates discovered in the code.
Code Inspection
This chart displays red and yellow dots to track the number of discovered errors and warnings respectively.
Tests Statistics
You can also find some useful statistics for a particular test: Test duration graph on the Test History page, which allows comparing the amount of time it takes individual tests to run on the builds of this build configuration. For more details refer to the related page.
Custom Charts
It is possible to customize project-level charts or/and configure your own statistical charts, e g. to display the total build duration, including the checkout time, the duration of all build stages, artifact resolving and artifact publishing or a chart displaying the duration of each build stage, and so on. See a dedicated page for details.