Remote debugging
The Remote Debug configuration allows you to debug remotely under gdbserver or lldb-server. Use this configuration if you already have the executable with debug information and don't need RustRover to build the project for you. This configuration is independent of a particular build system or project format.
The Remote Debug configuration allows you to remotely debug applications built with any build system. The only requirement is for the debug symbols to be present on the local machine.
Target platforms
There are no restrictions on target environment in case it supports gdbserver.
Your program can run remotely on any OS including Linux-based embedded like Raspbian OS (refer to Raspberry Pi OS Guide), on a cloud platform, or inside a Docker container. You can connect to any GDB stub that complies with the remote gdbserver protocol: for example, Qemu to debug OS kernels or OpenOCD to debug flashed firmware.
RustRover's bundled GDB, which is used as a client debugger by default, is built with multiarch support, which makes it suitable for remote cross-platform debug in various Linux/Windows/macOS and embedded cases. Find the full list of the supported targets below.
Remote targets supported by the bundled GDB
You can target macOS, Linux, Android, Apple TV/Apple Watch, and other platforms that support lldb-server. See Local system in the LLDB documentation.
Remote debug at a glance
On the host in RustRover, create a remote debug configuration.
On the target machine, prepare the binary and launch it under gdbserver/lldb-server.
On the host in RustRover, launch a debugging session.
Create a Remote Debug configuration
Go to Run | Edit Configurations, click
, and select Remote Debug from the list of templates.

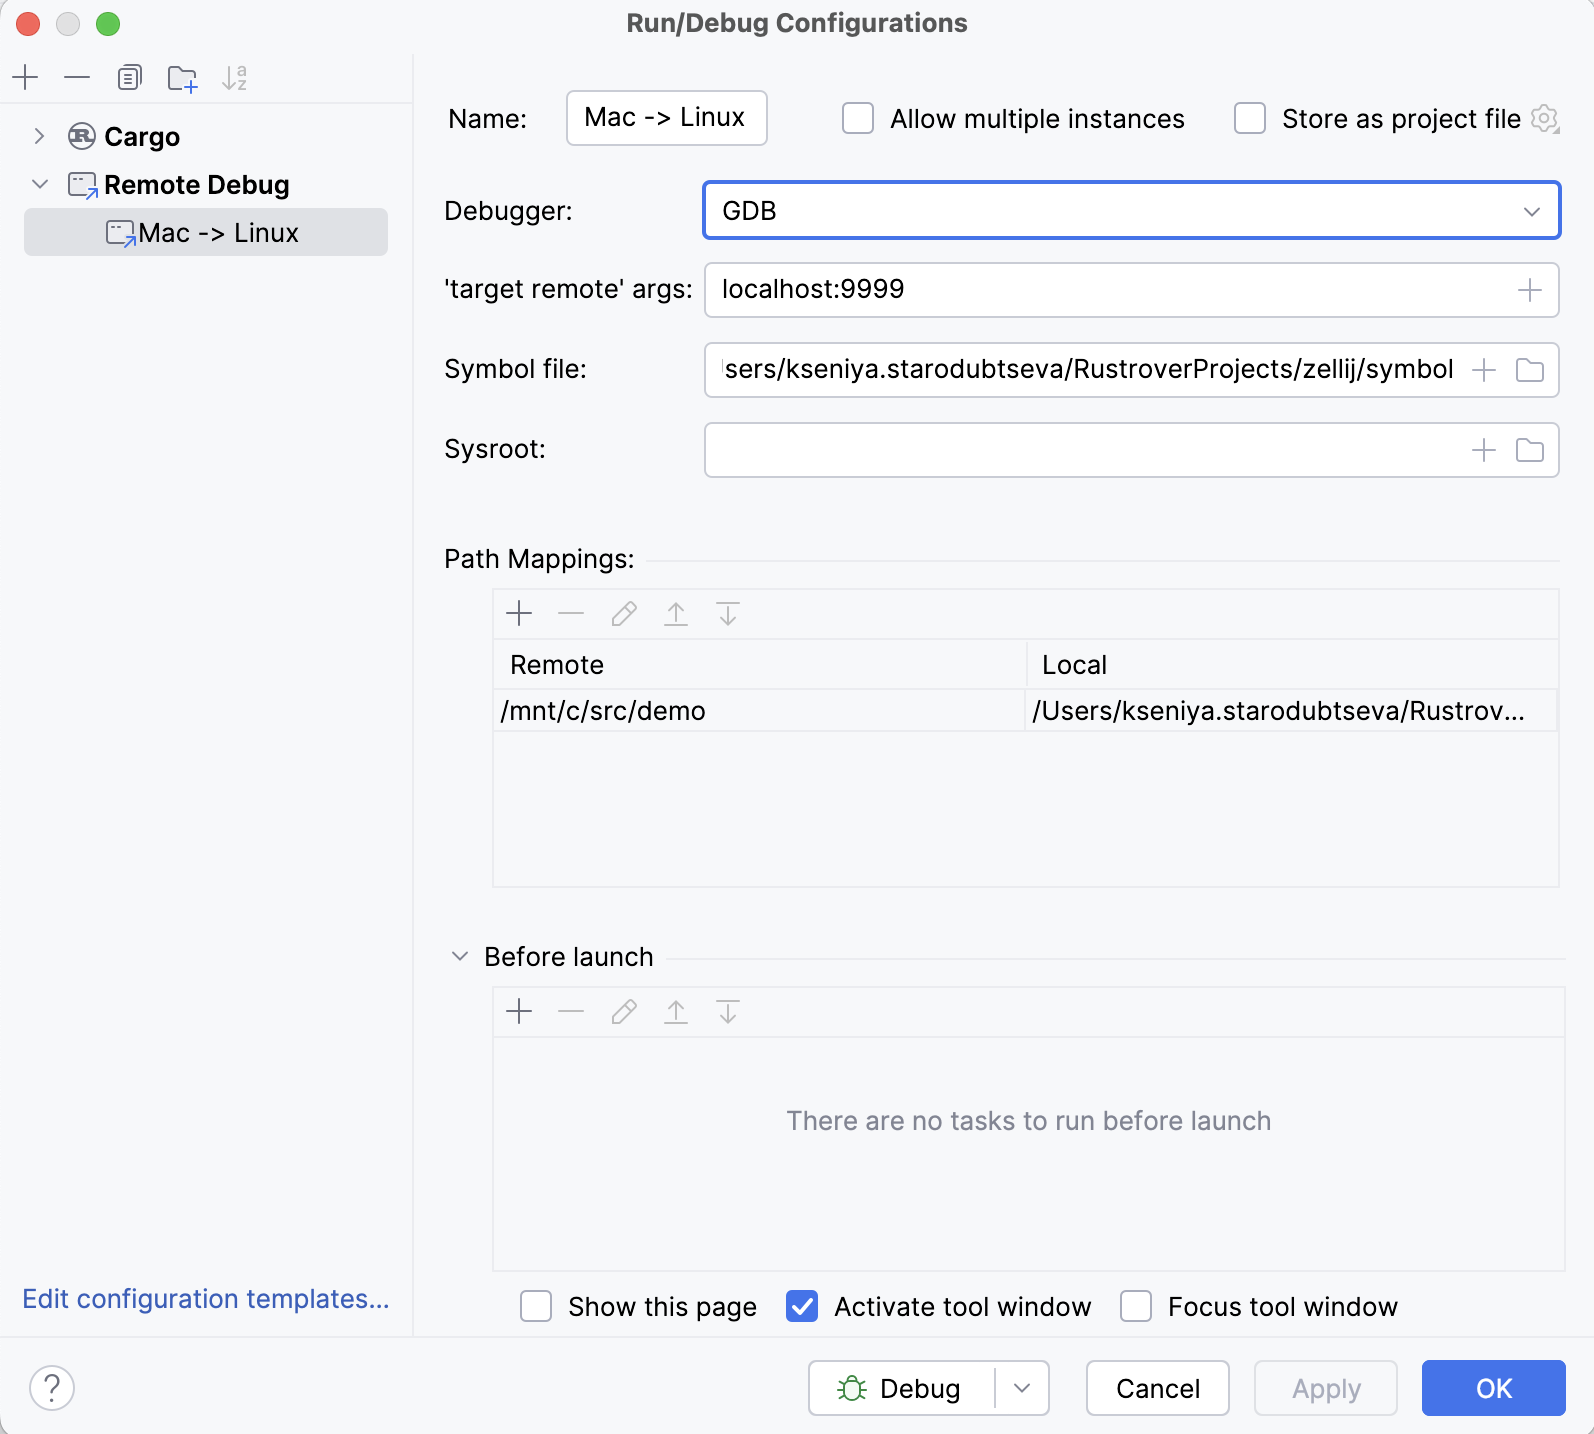
Select the client debugger (bundled GDB / bundled LLDB or a custom GDB binary) and provide the corresponding settings:
'target remote' args – the remote system's address in the following format:
<host>:<port>For example:
localhost:9999You can also use an alternative format.
Symbol file. This is the local machine path to the file with debug symbols, which can be a non-stripped copy of the executable running on the target or an ELF file containing only the debug info.
Recent versions of GDB clients can transfer symbols from gdbserver automatically, so leaving this field empty may also work well if the executable running on the target is a non-stripped binary.
Sysroot is used by GDB client to access copies of target libraries with debug symbols on your local system, allowing you to set breakpoints and find source lines in the library code.
'process connect' url. Use the following notation:
connect://<host>:<port>For example:
connect://localhost:9999Symbol file. This is the local machine path to the file with debug symbols, which can be a non-stripped copy of the executable running on the target or an ELF file containing only the debug info.
RustRover employs lldb-server in the g[dbserver] mode, which requires you to transfer all the files manually.
Sysroot is used by LLDB client to access copies of target libraries with debug symbols on your local system, allowing you to set breakpoints and find source lines in the library code.
Path mappings. Use this pane to provide the paths on the target machine (in the Remote column) to be mapped to local paths on the host (in the Local column).
Launch your program remotely under gdbserver/lldb-server
To launch your application on the target, you can use the remote terminal or invoke RustRover's built-in SSH terminal and perform port forwarding.
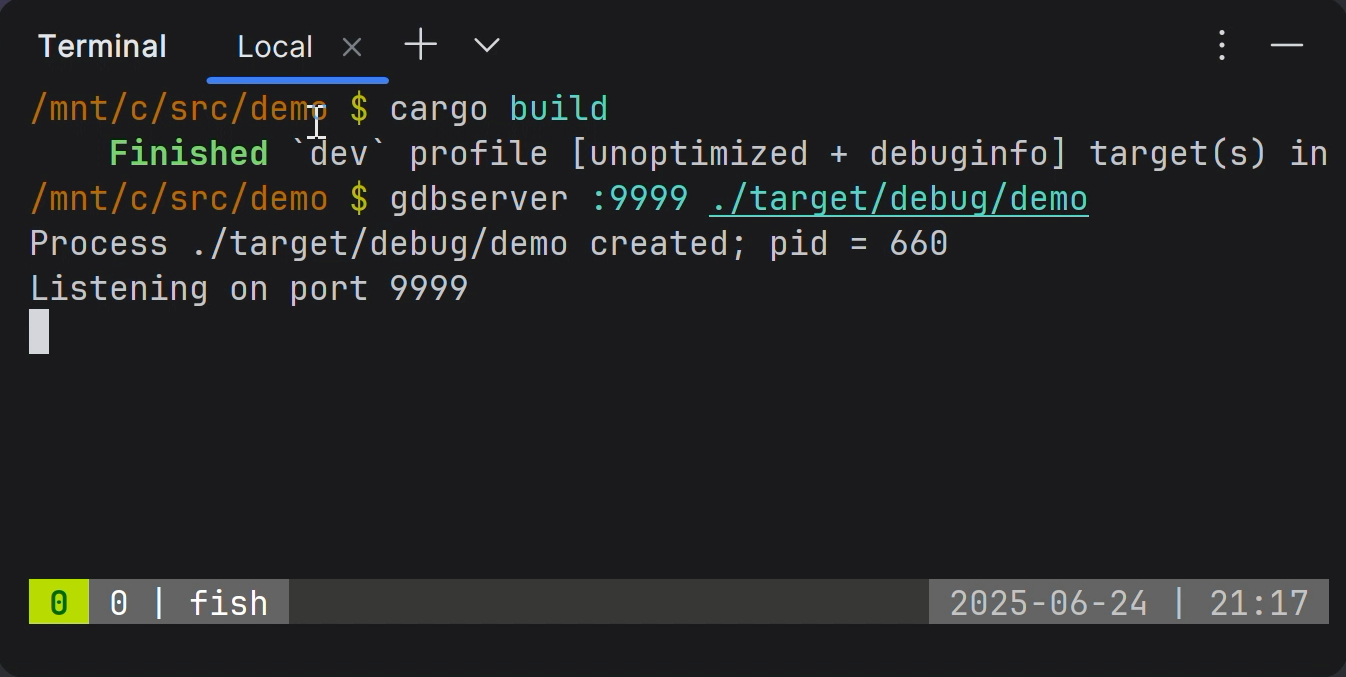
Run gdbserver using the following command:
For example:

Alternatively, you can connect over the serial port:
If you prefer to establish a serial line connection, indicate the device name instead.
On the remote machine, start lldb-server in gdbserver mode:
For example:
On macOS, use debugserver as lldb-server:
For example:
Once launched, gdbserver/lldb-server will suspend the program at the entry point and wait for the client debugger to connect.
Start a remote debug session
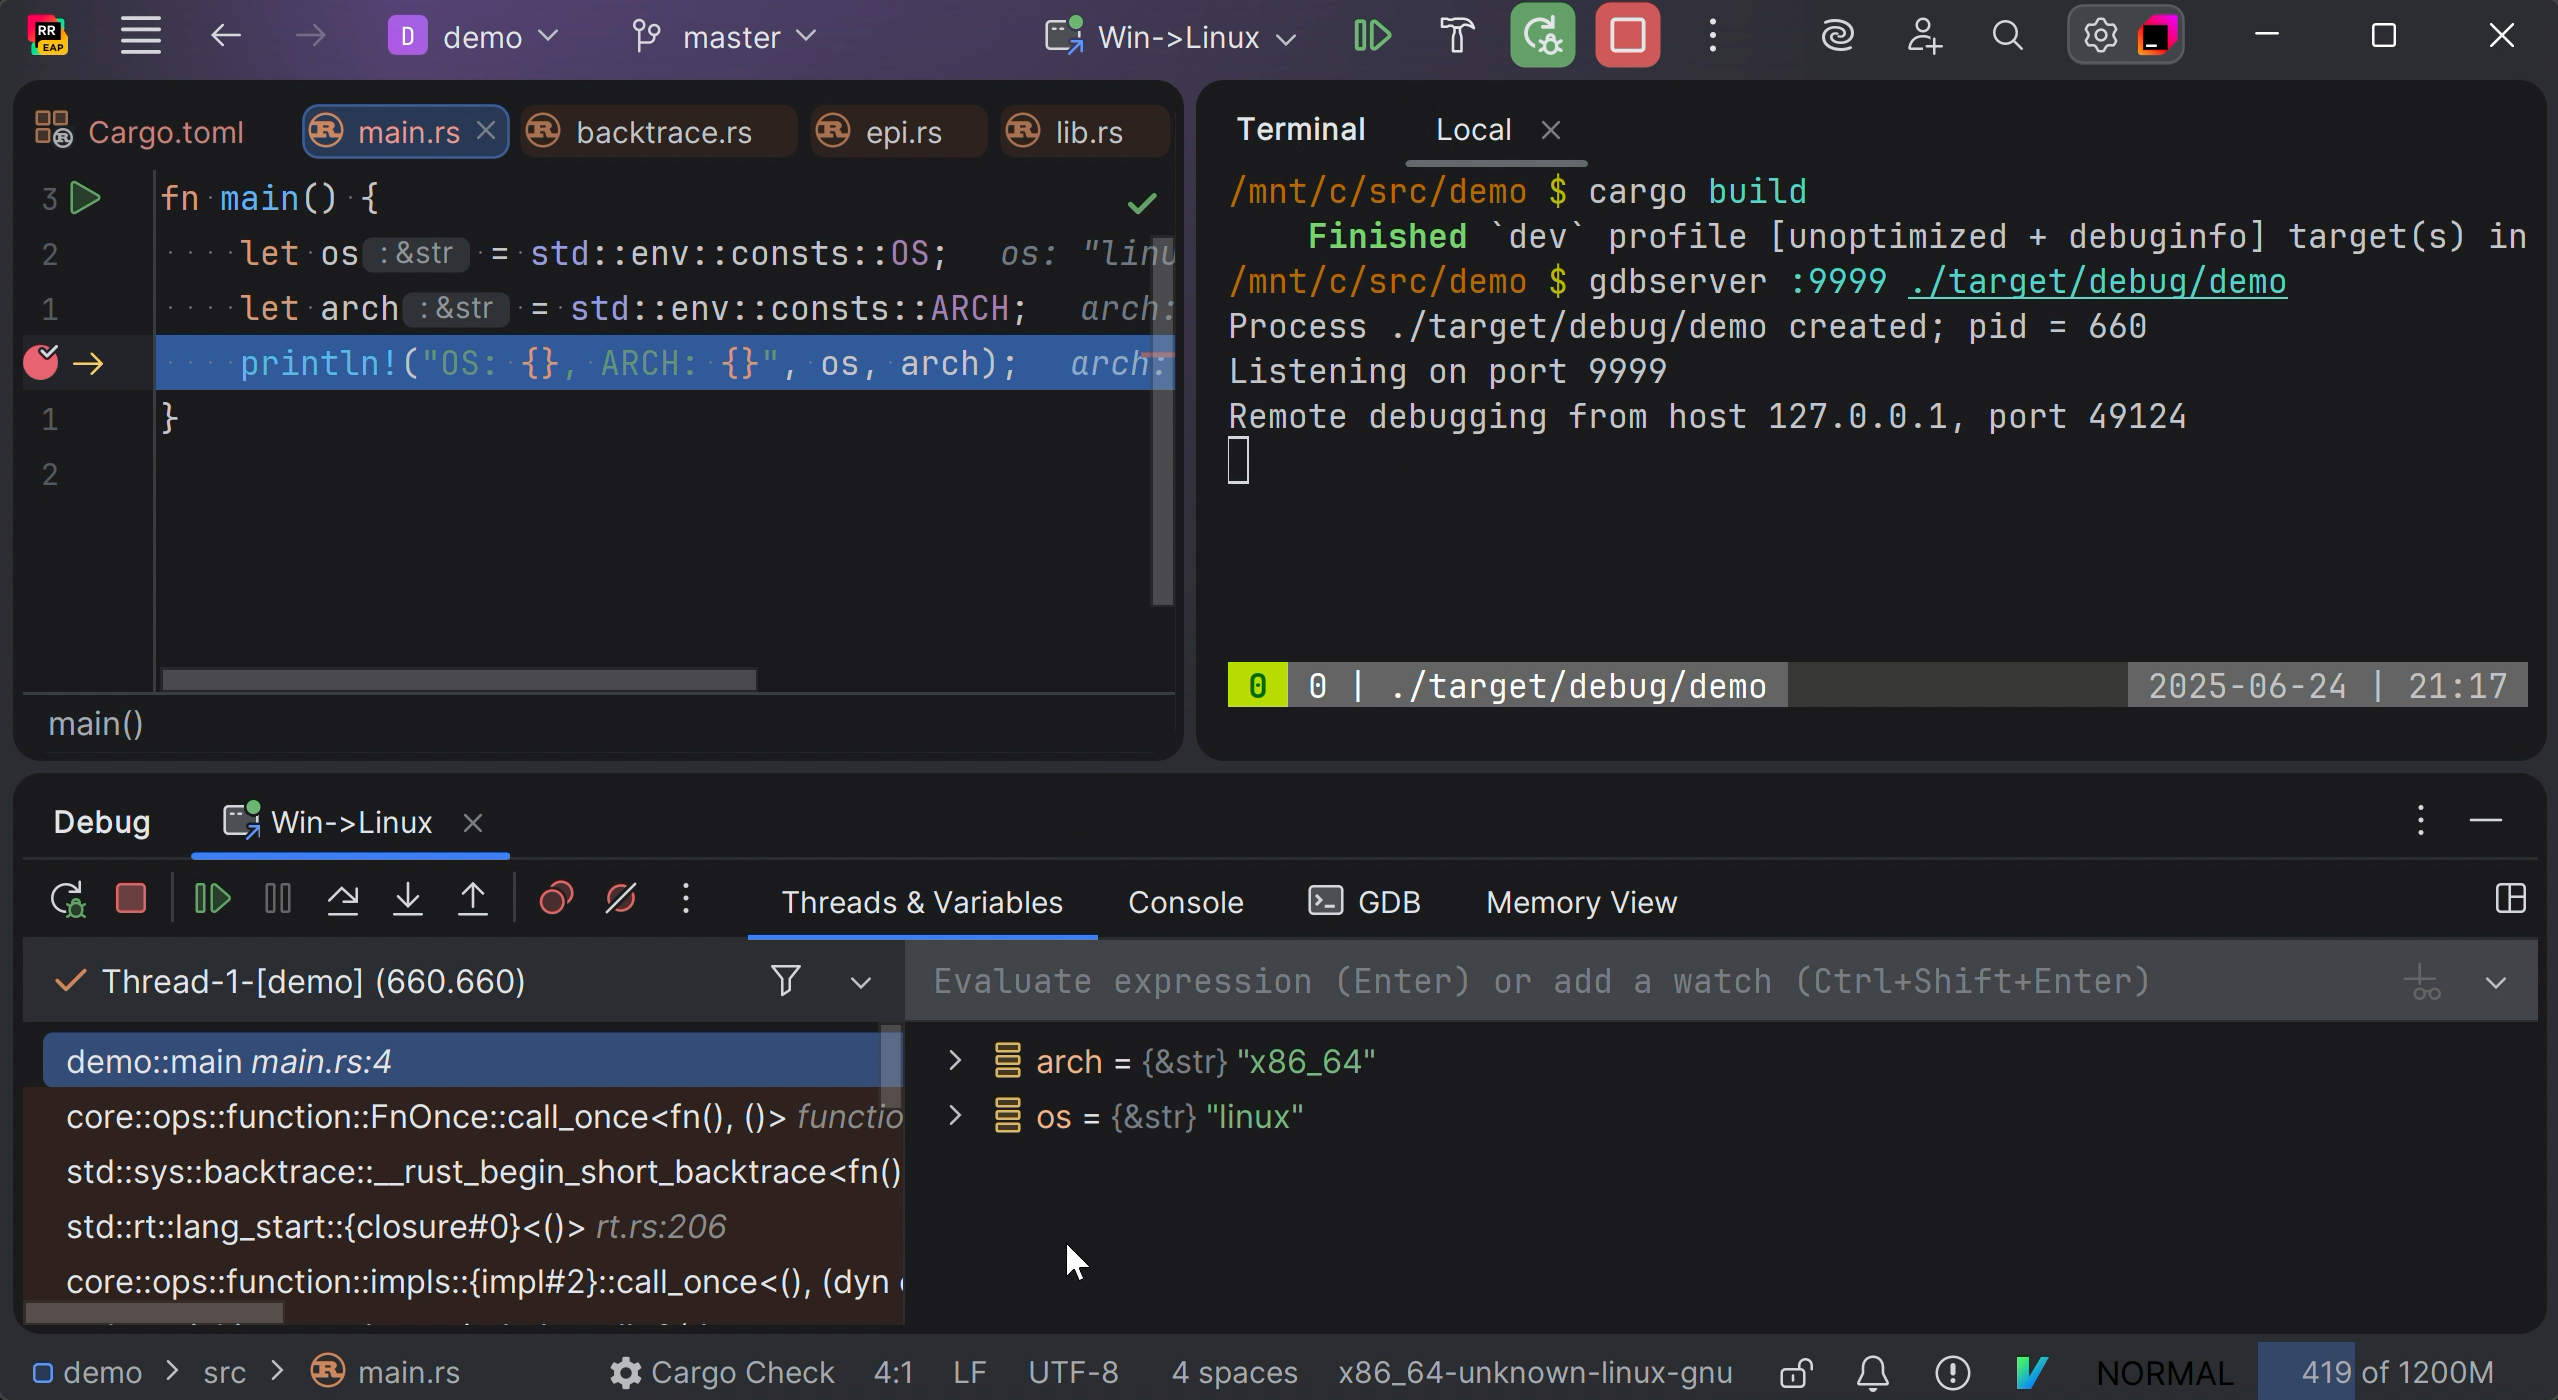
In RustRover, once you've placed breakpoints in your code, select the Remote Debug configuration and start the debug session.
RustRover’s debugger will connect to the running remote process.

Now you can inspect your code as if it was running locally (step through, examine variables, etc.).