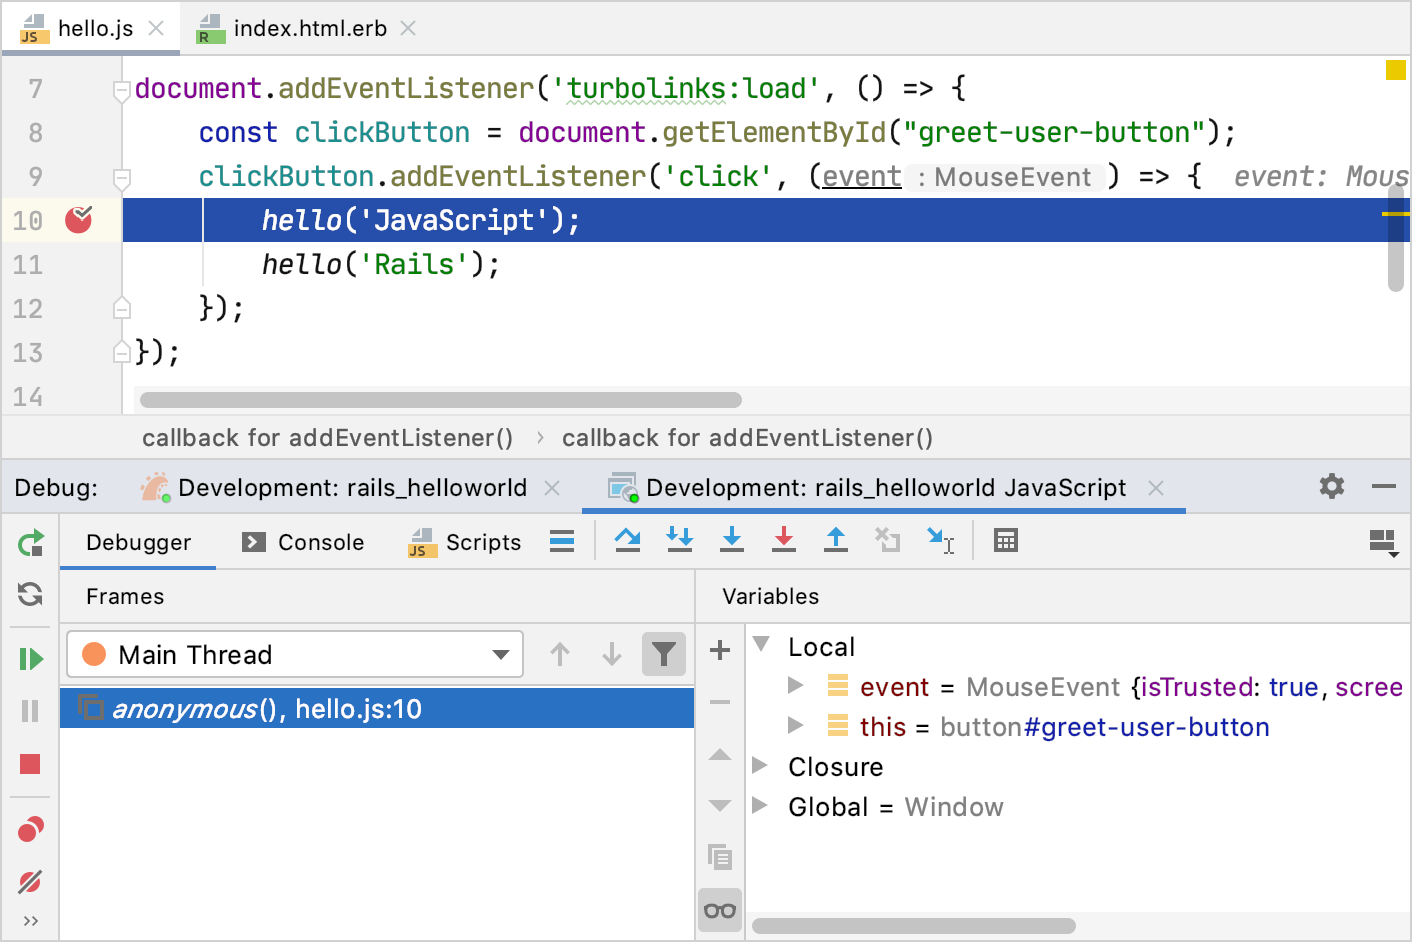
Debug Rails and JavaScript together
RubyMine can hit Ruby and JavaScript breakpoints in the same debug run: you enable the JavaScript debugger in the Rails run/debug configuration, and starting it debugs the server and the browser at once.
Create a sample application with esbuild
To see the feature in a concrete case, build a minimal application first: a page with a button, and a JavaScript handler that reacts to a click. It takes a few minutes, and it gives you a JavaScript file you can actually stop in.
Create a project and make sure to select esbuild from the build tool list.
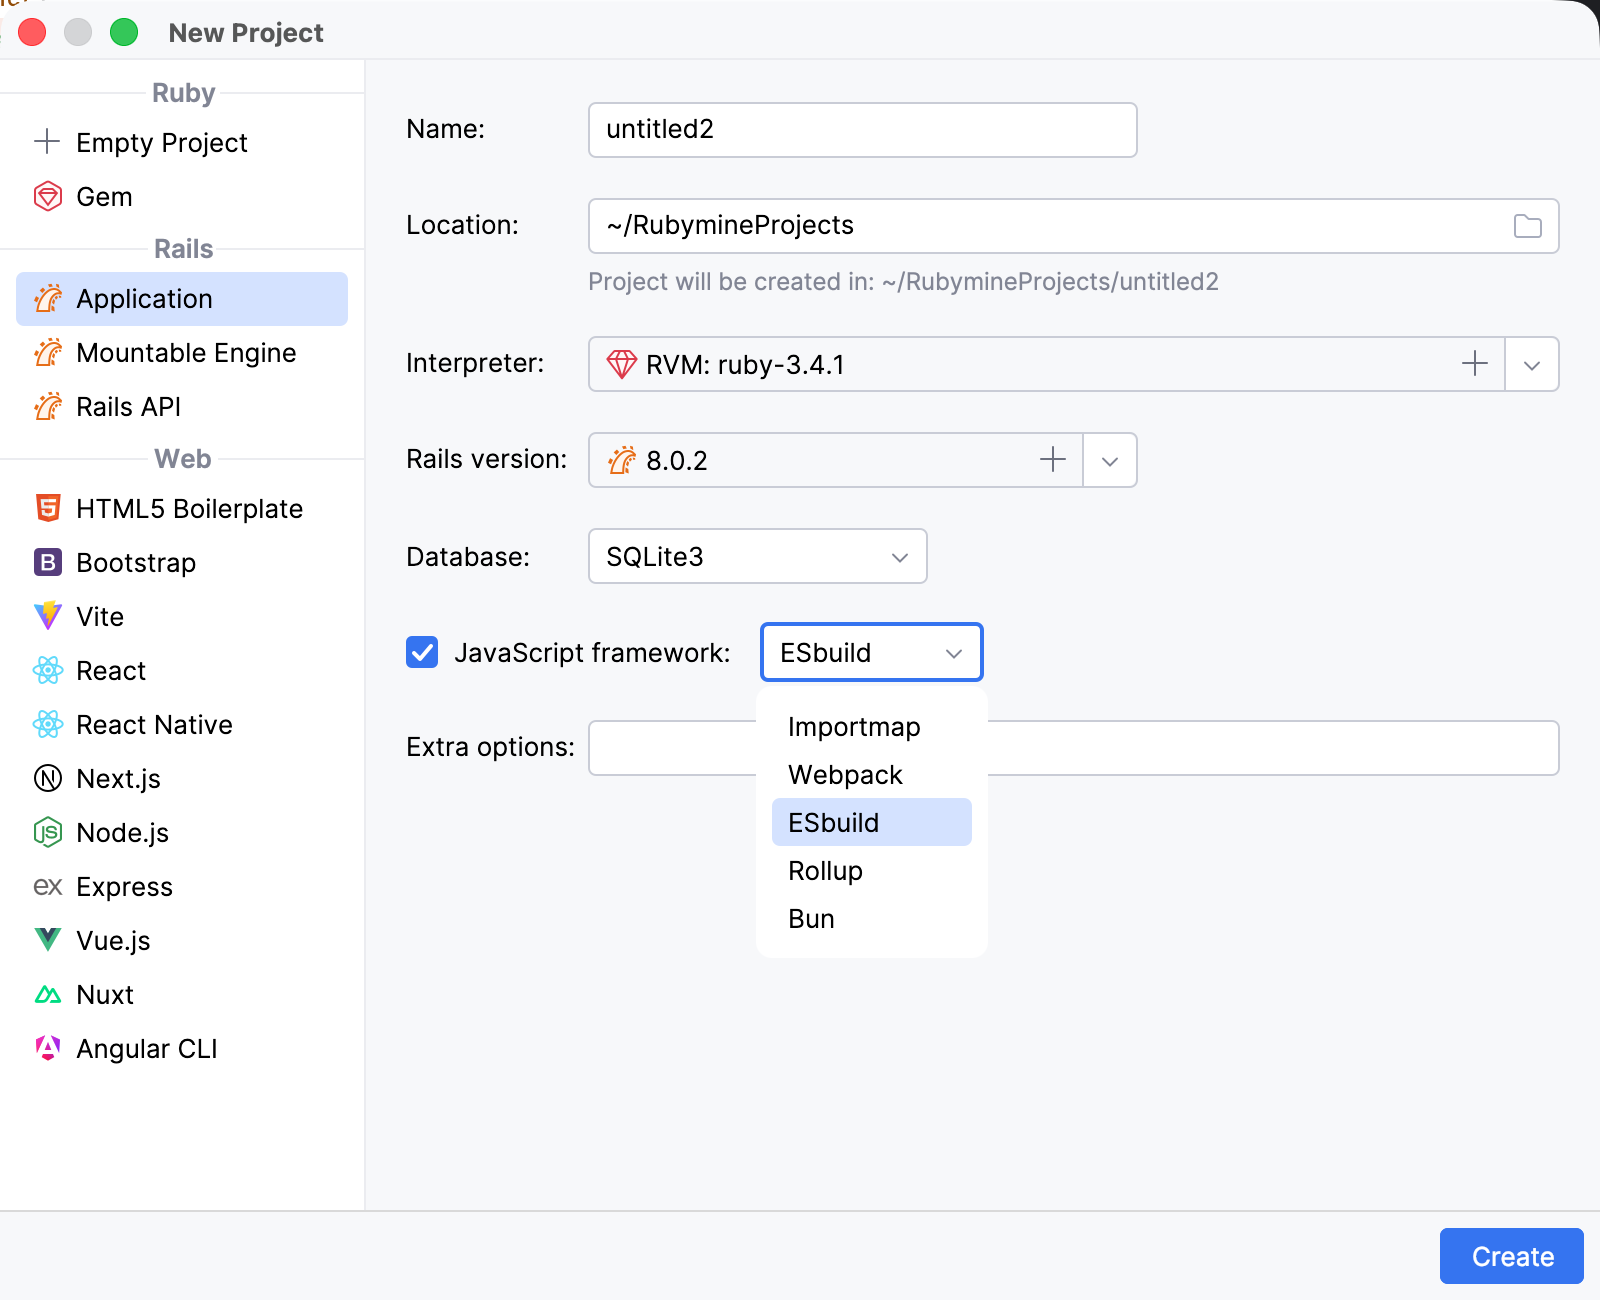
Once the project is created, perform the procedures below.
Add a controller
Press Ctrl twice and start typing controller. Select rails generate controller and press Enter.
In the Add New Controller dialog, set the controller name to Welcome and add an action named index. Click OK.
Open config/routes.rb and add the following line inside the
Rails.application.routes.draw do ... endblock:root "welcome#index"
Update a view
Add a button to the generated view.
In the Project view (Alt+1), open app/views/welcome/index.html.erb.
Replace the contents of the file with the following code:
<h1>Hello, Rails!</h1> <button id="greet-user-button" type="button">Hello!</button>The button has an identifier that the JavaScript handler will use.
Add a JavaScript handler
Create a JavaScript file that handles the button click.
In the Project view, select the app/javascript directory.
Press Alt+Insert and select JavaScript File.
Enter hello as the file name and press Enter.
Add the following code to hello.js:
const button = document.getElementById("greet-user-button") if (button) { button.addEventListener("click", () => { alert("Hello, JavaScript!") }) }This script finds the button and attaches a click handler to it.
Open app/javascript/application.js and add the following import, keeping the imports generated by Rails:
import "./hello"Open app/views/layouts/application.html.erb and verify that it loads the generated application bundle:
<%= javascript_include_tag "application", "data-turbo-track": "reload", type: "module" %>
Build the JavaScript bundle
In the Project view, open package.json.
Verify that the
scriptssection contains the following build command:{ "scripts": { "build": "esbuild app/javascript/*.* --bundle --sourcemap --format=esm --outdir=app/assets/builds --public-path=/assets" } }The
--sourcemapoption is what makes the breakpoints in hello.js work: it generates the source maps that connect the bundle running in the browser back to your original files.Click the Run icon in the gutter next to the
buildscript and select Run 'build'.RubyMine runs
yarn buildand displays the result in the Run tool window.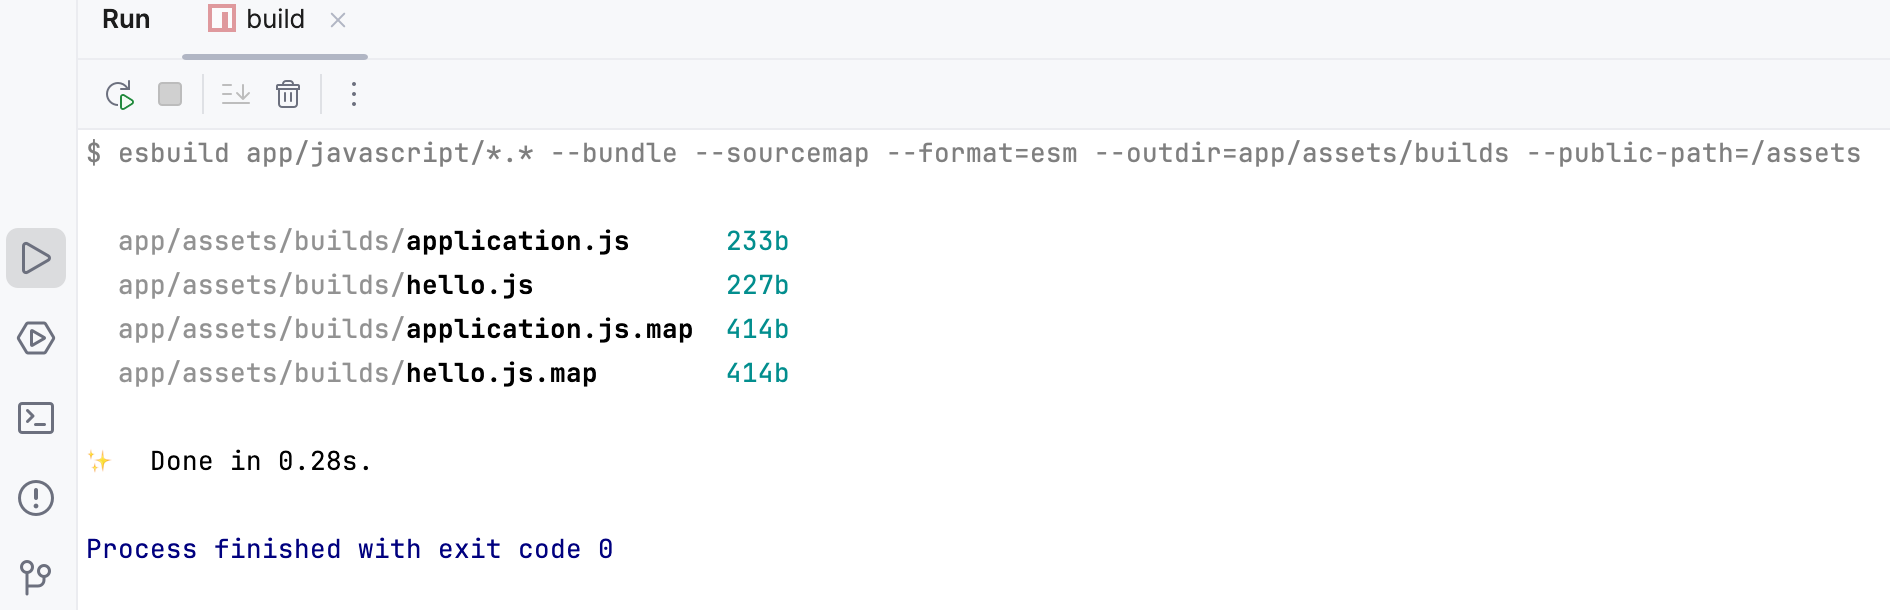
Enable the JavaScript debugger
To debug JavaScript, enable automatic startup of the JavaScript debugger in the run/debug configuration of your application.
Go to and select the automatically created development configuration in the Rails group.
Specify the following options:
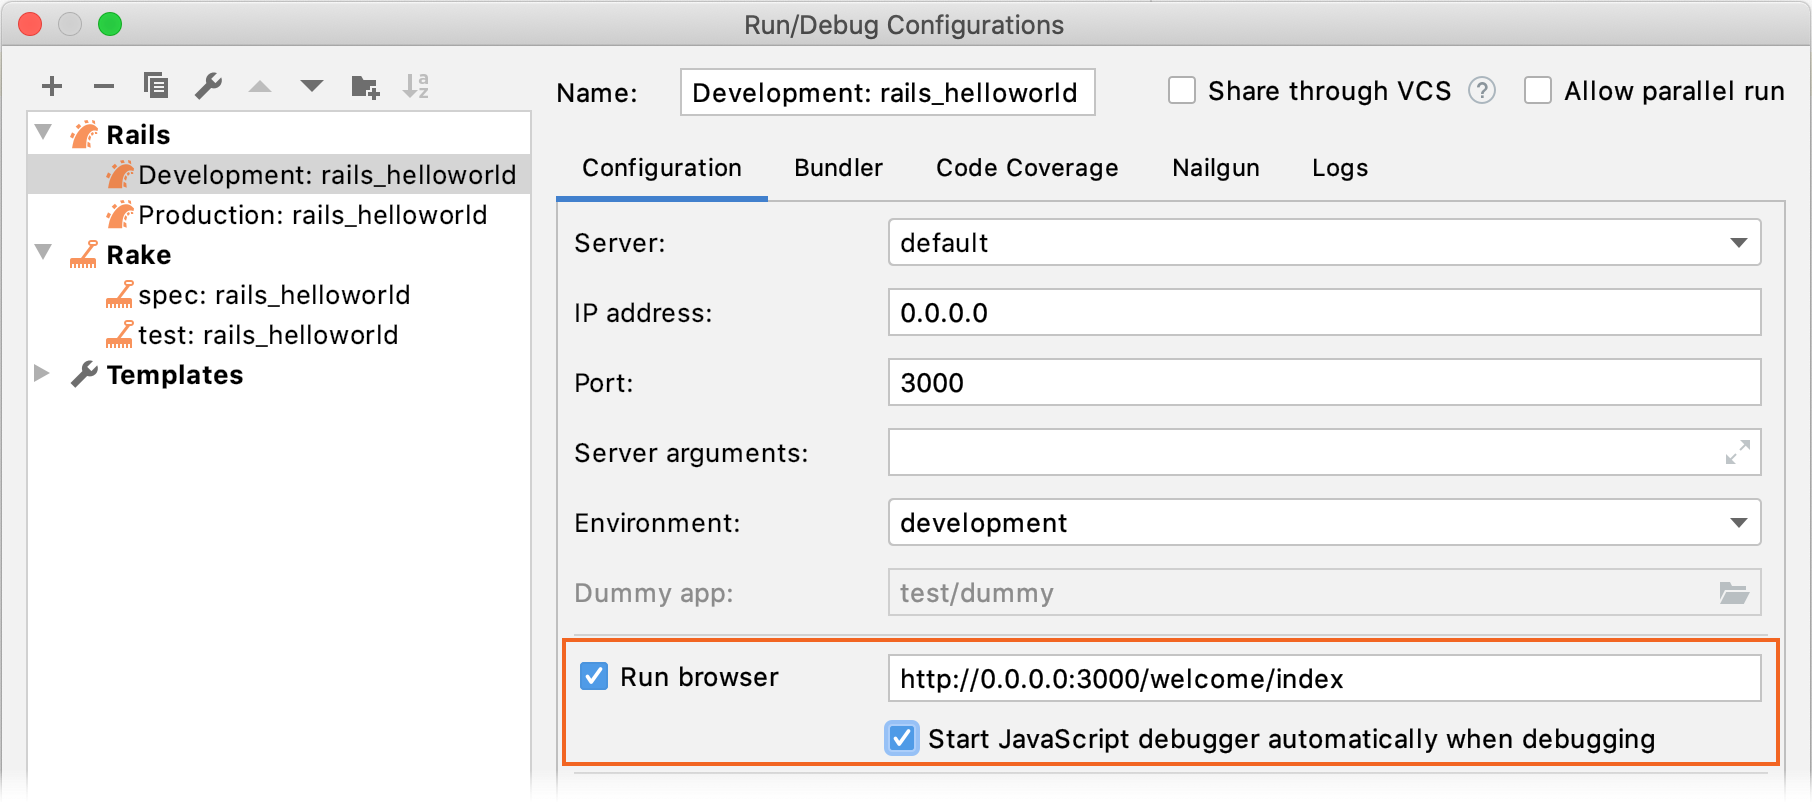
Enable the Run browser option and specify http://127.0.0.1:3000. This URL opens the app/views/welcome/index.html.erb view that uses the JavaScript asset.
Enable Start JavaScript debugger automatically when debugging.
Start debugging
To debug the JavaScript code, follow the steps below:
Open app/javascript/hello.js and set a breakpoint on the line that calls
alert.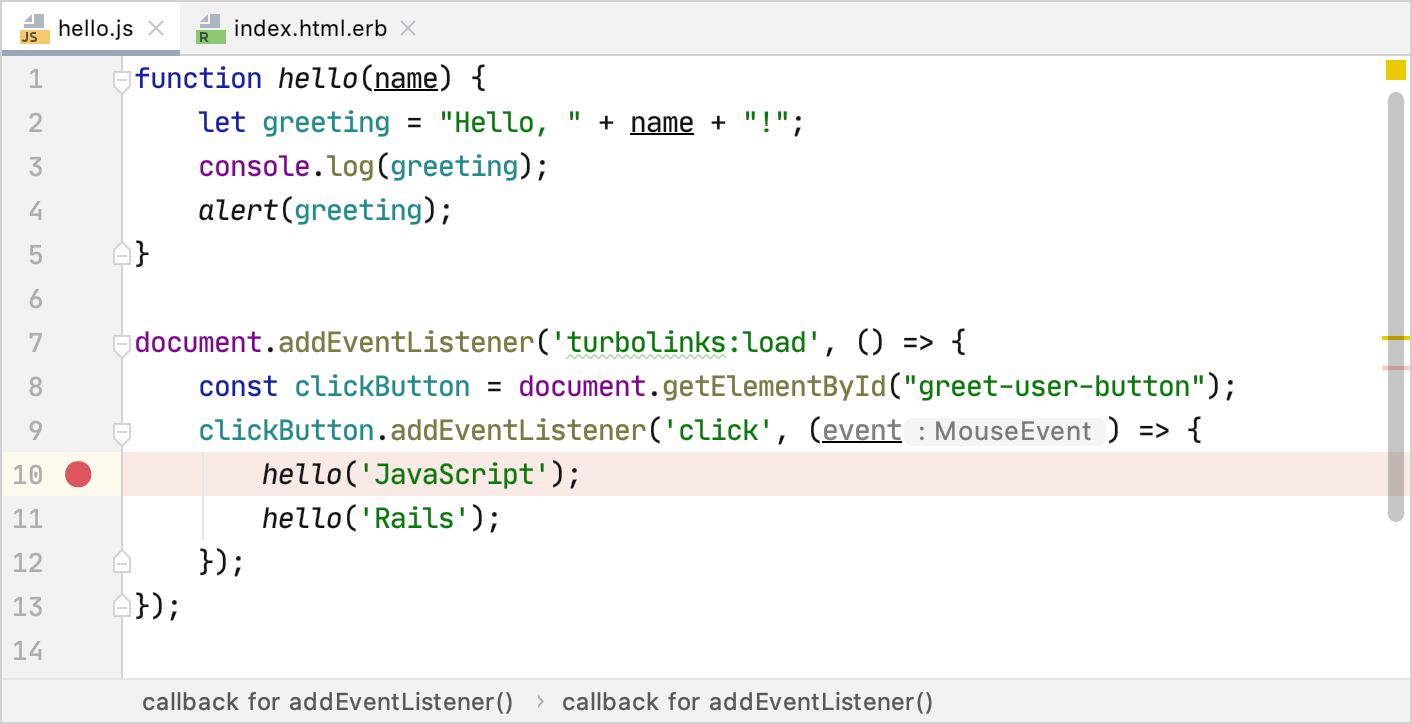
To start debugging, press Ctrl twice and start typing the name of the Development configuration. Select the configuration, press and hold Shift (the dialog title changes to Debug), and press Enter.
On the opened http://127.0.0.1:3000 page, click Hello!. The debugger pauses at the breakpoint and enables you to examine the application state. To learn more, refer to Debug JavaScript in Chrome.