Frame Viewer Tool
Frame Viewer simplifies shader debugging by allowing you to inspect and analyze rendering snapshots directly in the IDE without requiring external tools like RenderDoc.

When a RenderDoc snapshot is loaded in the Frame Viewer, you can debug draw calls and explore pixel and vertex data by navigating focused views of rendering events through an integrated and intuitive UI.
Limitations
Frame Viewer currently has the following limitations:
Only works on Windows.
Supports shader debugging only for the Vertex and Fragment stages.
The tool is available exclusively for Unity projects.
Enable the Frame Viewer plugin
This functionality relies on the Frame Viewer plugin, which is bundled and enabled in JetBrains Rider by default. If the relevant features are not available, make sure that you did not disable the plugin. For more information, refer to Open plugin settings.
Press Ctrl+Alt+S to open settings and then select .
Open the Installed tab, find the Frame Viewer plugin, and select the checkbox next to the plugin name.
Frame Viewer overview
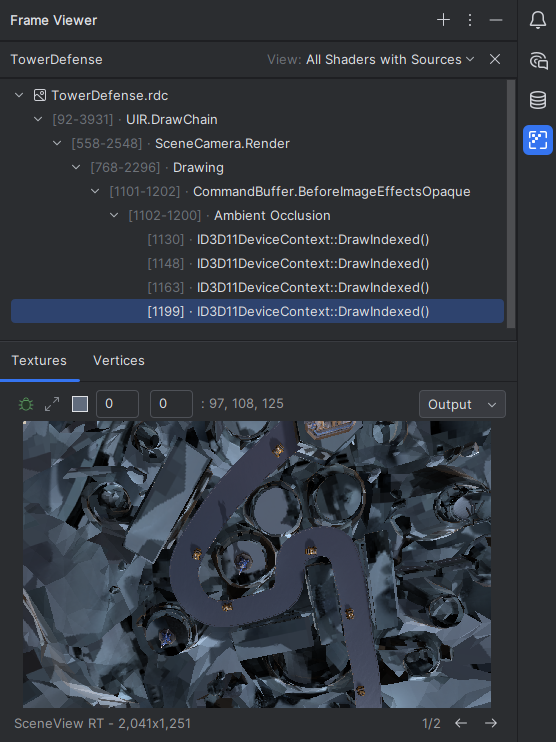
The Frame Viewer presents a focused and categorically organized UI for exploring rendering events and their associated assets and stages. Key components include:
Event Tree: Displays rendering events with IDs, phases (e.g., Lighting, Post-processing), and debug state indicators. Filters are available to focus on custom shaders (based on their names) or switch between filtered views.
Texture Preview: Provides a visual representation of the render target (such as the SceneView RT) with pixel coordinates and color values. You can hover over textures to select specific pixels in full resolution.
Vertices Preview: Displays vertex data associated with the selected rendering event, enabling debugging of transformations through the rendering pipeline.
Open a snapshot in the Frame Viewer
Open your Unity project in Rider.
Save a snapshot from RenderDoc if you haven’t already.
Click the Frame Viewer icon in the right-hand sidebar of the Rider window.
Click Open Snapshot and pick the snapshot file (*.rdc) to start inspecting the rendering data.
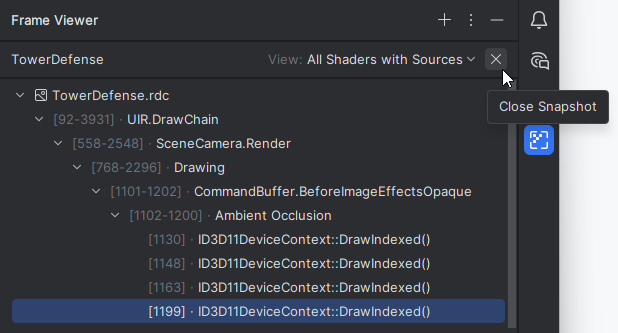
To open another snapshot, click Open Snapshot on the toolbar, or close the current snapshot and then click the Open Snapshot button.

Debugging scenarios
The Frame Viewer supports two primary debugging workflows: pixel debugging and vertex debugging.
Pixel debugging
Pixel debugging allows you to debug the rendering result for a specific pixel, inspecting its processing state throughout the rendering pipeline.
Debug a pixel
Select a render event from the Event Tree.
Preview the corresponding texture in the Textures tab.
Click on a pixel in the preview to select it for debugging.
Click Debug Pixel
in the Textures panel to start debugging.
Vertex debugging
Vertex debugging allows you to inspect the transformation of a selected vertex through the rendering pipeline.
Debug a vertex
Select a render event from the Event Tree.
Open the Vertices tab and identify the target vertex.
Click Debug Vertex
in the Vertices panel to debug the selected vertex.
Debug window synchronization
When debugging shaders through Frame Viewer, the Debug window displays shader variables for the active debugging session. It is synchronized with the Event Tree, highlighting the specific event where debugging started.