Debugging in Kubernetes
JetBrains Rider supports the following Kubernetes debugging flows: on-the-fly pod troubleshooting with ephemeral containers and remote debugging with Telepresence, so you can diagnose various issues without leaving your IDE.
Enable the Kubernetes plugin
This functionality relies on the Kubernetes plugin, which is bundled and enabled in JetBrains Rider by default. If the relevant features are not available, make sure that you did not disable the plugin.
Press Ctrl+Alt+S to open settings and then select .
Open the Installed tab, find the Kubernetes plugin, and select the checkbox next to the plugin name.
Ephemeral containers
JetBrains Rider supports attaching ephemeral containers to running pods without restarting them. This way, you can inspect a live Kubernetes environment, run diagnostic commands, and investigate issues directly inside a running pod.
An ephemeral container is temporarily added to an existing pod for debugging and runs alongside your application containers. For this purpose, JetBrains Rider runs the kubectl debug command under the hood. You can either attach your custom debug container or use a lightweight BusyBox image, which provides common tools like ping, netstat, wget, and top out of the box.
For more details on debugging running pods, refer to the Kubernetes documentation.
Attach BusyBox to a running pod
Open the Services tool window: go to or press Alt+8.
Expand the node that lists running pods, right-click the pod you want to debug, and select from the context menu.
Alternatively, select the required pod, click
 on the toolbar, and select Attach Busybox from the dropdown.
Attach a custom container to a running pod
Open the Services tool window: go to or press Alt+8.
Expand the node that lists running pods, right-click the pod you want to debug, and select from the context menu.
Alternatively, select the required pod, click
on the toolbar, and select Attach Custom from the dropdown.In the Attach Custom Debug Container dialog, use the following fields to customize the
kubectl debugcommand for starting and attaching an ephemeral container:Pod: select the pod you want to debug from the dropdown.
Target: specify the target container inside the selected pod.
Image: start typing the name of an image to use for debugging and then select it from the list of suggestions.
Executable: specify an absolute path to the shell to run inside the ephemeral container after it starts (for example,
/bin/shfor BusyBox or/bin/bashfor Ubuntu).Options: provide additional configuration parameters for the debug container. For examples, refer to the Kubernetes documentation.

Click Attach to Pod.
When JetBrains Rider starts a new ephemeral container and successfully attaches it to the pod, the Console tab opens, where you can run commands and inspect the pod.

If you attach BusyBox, JetBrains Rider automatically uses sh. For custom images, the IDE uses the shell specified in the Executable field.
The container is removed when you delete the pod it is attached to.
Recent commands
When you attach an ephemeral container using the Ephemeral Debug Containers menu, JetBrains Rider automatically saves the corresponding kubectl debug command. You can access and rerun it later from the Recent section.

Start an ephemeral container using a recent command
Open the Services tool window: go to or press Alt+8.
Expand the node that lists running pods and right-click the pod you want to debug. Select Ephemeral Debug Containers and the required recent command from the context menu.
Alternatively, select the required pod, click
on the toolbar, and select the recent command from the dropdown.
Manage recent commands
Access recent commands:
In the Settings/Preferences dialog (Ctrl+Alt+S) , select .
Open the Sevices tool window (Alt+8). Right-click any running pod and select from the context menu.
Navigate to the Ephemeral Debug Containers section.
To add a new command that you can preconfigure and quickly start new ephemeral containers, click
 . In the Add Debug Parameters dialog, you can specify an image, executable, and options for the
 kubectl debugcommand.To remove a command from recents, select it in the table and click
 .
.To edit an existing command, select it in the table and click
 . In the Add Debug Parameters dialog, change the image, executable, and options for the
 kubectl debugcommand.
Telepresence
Telepresence is a tool that lets you access services in a Kubernetes cluster, debug them, make, and test changes as if the services were running on your computer locally.
The Kubernetes plugin provides integration with Telepresence allowing you to:
Connect to Telepresence to access a service in the cluster by its DNS name.
Intercept a service to route traffic from the cluster to your local environment.
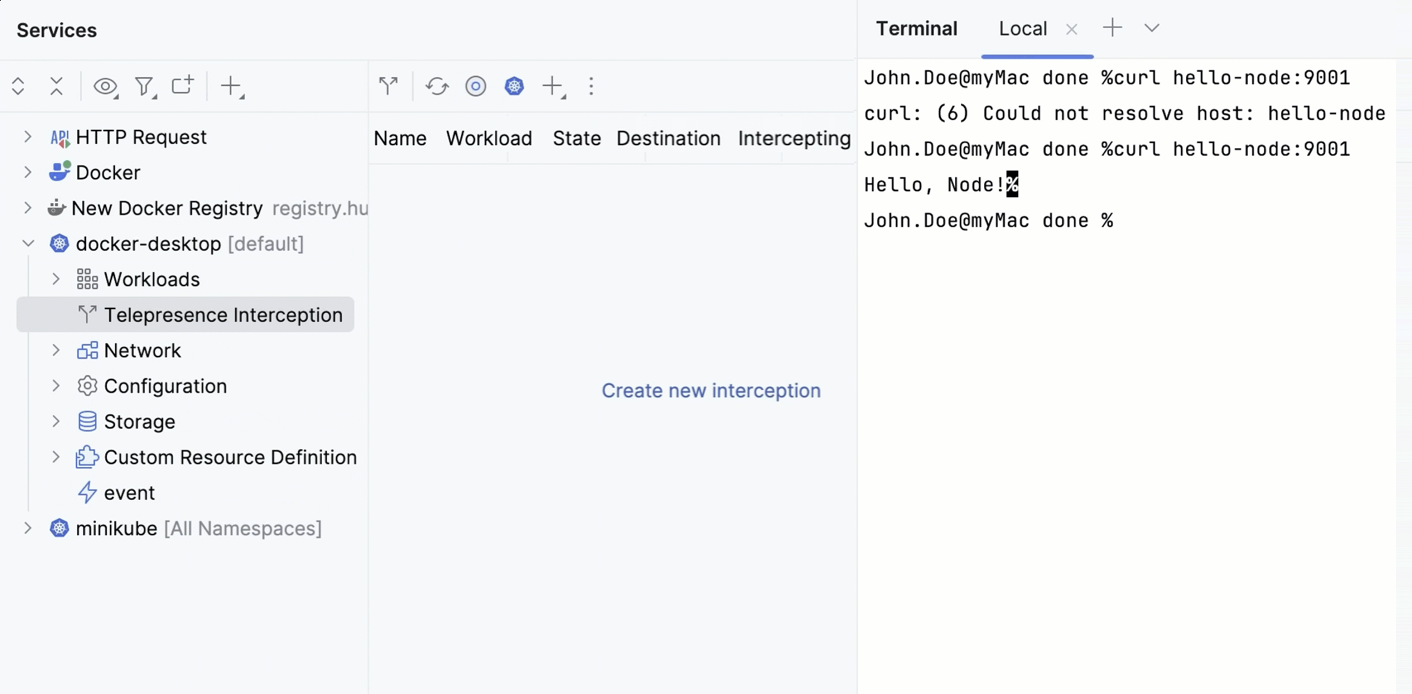
Connect to Telepresence
Open the Services tool window: select or press Alt+8.
Right-click your Kubernetes cluster and select Connect Telepresence. Alternatively, click
 in the toolbar. When prompted, enter your administrator account password required to start the Telepresence daemon. On Windows, allow telepresence.exe to be executed.
After installing Telepresence and Traffic Manager, click Connect Telepresence again.
You can now access services in the Kubernetes cluster by their DNS names as if the cluster were running on your workstation. For example, if you have an application that accepts requests to hello-node:9001, you can access it by its name.
Intercept traffic from the cluster
Intercepts allow you to take traffic going to a service in the Kubernetes cluster and route it to the local service.
On the toolbar, click
(Create New Interception) and then click Create new interception.In the window that opens, in the Service list, select a workload to intercept. This can be a Deployment, a ReplicaSet, or a StatefulSet.
In the Ports field, specify the port on which the local instance of your service is running.

If the service is intercepted successfully, you can access it locally and use the IDE features to try, debug, and profile your application running in the cluster.
Quit Telepresence
Telepresence interacts with one cluster at a time, so you may need to stop it before connecting to another cluster. Quitting Telepresence will stop all active intercepts.
Open the Services tool window: select or press Alt+8.
Right-click your Kubernetes cluster and select Quit Telepresence. Alternatively, click
 in the toolbar.