OpenTelemetry
The OpenTelemetry plugin brings runtime observability into your development workflow. It collects, processes, and displays logs, metrics, and traces to help you understand the runtime behavior and relationships between services in your application.
Install the OpenTelemetry plugin
This functionality relies on the OpenTelemetry plugin, which you need to install and enable. For more information, refer to Install a plugin from Marketplace.
Press Ctrl+Alt+S to open settings and then select .
Open the Marketplace tab, find the OpenTelemetry plugin, and click Install (restart the IDE if prompted).
Once installed, the plugin adds the OpenTelemetry service in the Services window. By default, the service starts collecting the data as soon as you run your project (currently the .NET Project and .NET Launch Settings configurations are supported).

In most cases, you want to have the OpenTelemetry service running before you start the target application, that's why by default the service is started automatically when you start Rider. To change that, clear the Launch OpenTelemetry host on startup checkbox on the page of JetBrains Rider settings Ctrl+Alt+S.
To start and stop the service, select the OpenTelemetry node in the Services window and use the corresponding buttons on the toolbar.

When the service is running, the toolbar also shows the host address with the corresponding environment variable. You can use them to manually add gRPC OTLP endpoints to add any apps started locally outside the IDE to the analysis.
By default, the port is assigned randomly, but you can change that using the Use fixed OTLP server port checkbox on the page of JetBrains Rider settings Ctrl+Alt+S.
For .NET applications launched from the IDE, the OTEL_EXPORTER_OTLP_ENDPOINT environment variable is set automatically. This means that if an application is configured with OpenTelemetry, has the OTLP exporter added, but the endpoint is not explicitly set in the code, the application will automatically start sending data to Rider OTLP server. You can disable auto-assigning of the environment variable by clearing the Overwrite OpenTelemetry environment variables checkbox on the page of JetBrains Rider settings Ctrl+Alt+S.
Study OpenTelemetry data
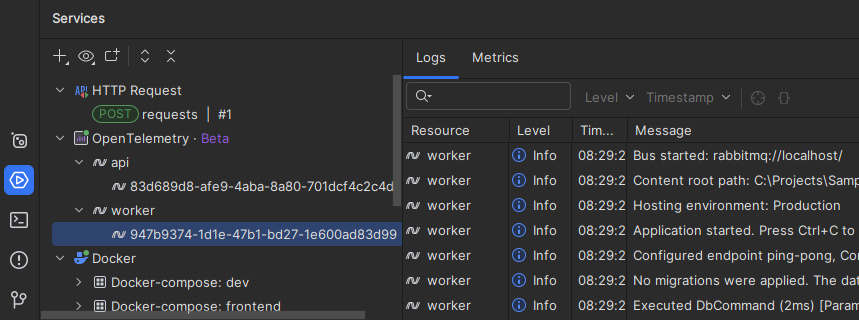
The unit of the OpenTelemetry data is an application instance (or service instance in terms of the spec). By default, instances are identified by a GUID and grouped by the application that spawned them. The Logs tab shows detailed information such as timestamps, log levels, and log messages. You can filter logs by text, level, or other attributes to easily focus on relevant information.

Logs and metrics are stored in memory and are cleared when the OTLP server restarts.
You can remove unnecessary instances from the tree view using the context menu.
Click Navigate To Code on the toolbar to jump from a log entry to the corresponding source code location. Note that this requires the {OriginalFormat} attribute in the log entry, and does not support navigation to third-party or decompiled code.
Click Open in Editor on the toolbar to serialize a log entry into a JSON and open it in the editor. The serialized entries will be saved and available in the Scratches and Consoles node in the Explorer tool window.
Service map
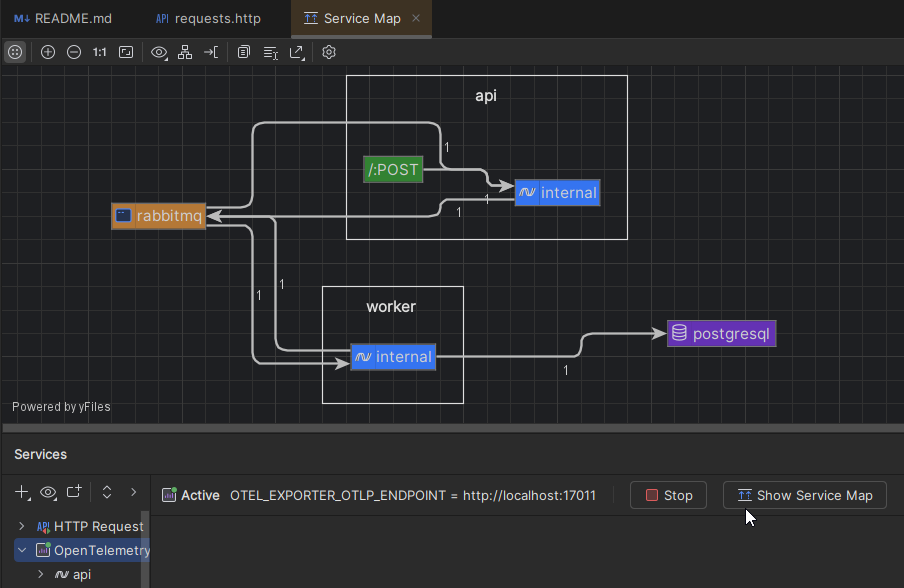
When you analyze multiple apps and services, you can create an architecture diagram, or service map, based on traces. The map shows services, endpoints, databases, and message queues to help you understand interaction patterns and dependencies within the system.
Ensure that your apps and services generate distributed traces (e.g., through HTTP requests) for the service map to populate.
To view the service map, select the OpenTelemetry node in the Services window and click the corresponding toolbar button:

Auto-instrumentation
When you run ASP.NET Core apps from the IDE, JetBrains Rider can inject necessary OpenTelemetry dependencies during runtime so that the app automatically starts sending OpenTelemetry data.
Auto-instrumentation is disabled by default. To enable it, select the Allow automatic instrumentation checkbox on the page of JetBrains Rider settings Ctrl+Alt+S.
Auto-instrumentation is intended for quick testing. For production-like setups, we recommend manually adding and configuring OpenTelemetry dependencies. If your project already includes OpenTelemetry packages, auto-instrumentation is skipped.
Manual instrumentation example
Here is an example of an ASP.NET Core app that will be auto-instrumented:
Here is the same app with the configured OpenTelemetry dependencies:
Integration with local OpenTelemetry providers
Rider OpenTelemetry Satellite service supports the OTLP gRPC collector/exporter API, which lets you integrate with your existing local OpenTelemetry providers that work outside the IDE. This allows you to send telemetry data (traces, logs, metrics) directly to Rider or through a local OpenTelemetry Collector.
Send telemetry data directly
On the page of JetBrains Rider settings Ctrl+Alt+S, disable Overwrite OpenTelemetry environment variables and configure Use fixed OTLP server port to bind Rider OpenTelemetry service to a fixed port.
In your application, configure the OTLP exporter to point to the Satellite service. The endpoint is
http://localhost:<port>, where<port>is as configured in the plugin settings.
Use an OpenTelemetry Collector if you need to forward data to multiple destinations (e.g., Rider and external monitoring services).
Send telemetry data integration via OpenTelemetry Collector
On the page of JetBrains Rider settings Ctrl+Alt+S, disable Overwrite OpenTelemetry environment variables and configure Use fixed OTLP server port to bind Rider OpenTelemetry service to a fixed port.
Configure the OpenTelemetry Collector to accept telemetry data from your application's OTLP exporter.
Export data to Rider OpenTelemetry Satellite service by adding it as an exporter, e.g.,
endpoint: "localhost:17011".Add Rider OpenTelemetry Satellite service as a collector. For example:
otlp/satellite: endpoint: "localhost:17011" tls: insecure: trueReference the appropriate pipelines (traces/metrics/logs) in the OpenTelemetry Collector configuration and include Rider OpenTelemetry Satellite service in those pipelines. For example:
service: pipelines: traces: receivers: ... exporters: [otlp/satellite] metrics: receivers: ... exporters: [otlp/satellite] logs: receivers: ... exporters: [otlp/satellite]