Logpoints
A logpoint is a non-suspending breakpoint that writes debug messages to the console when it is hit.
Logpoints help you with:
Keeping debug logging clean and centralized instead of scattering
println()calls.Getting insight into timing-sensitive sections of the program without pausing execution.
Debugging libraries or other code that you can't edit.
Navigating from log entries back to the code that produced them and getting additional runtime information, such as the thread's stack trace when the logpoint was hit.
Create logpoints
Click the gutter between any two executable lines. A yellow circle icon appears.

Enter the expression to log. With this expression, you can capture any state that is accessible at this point in the program.
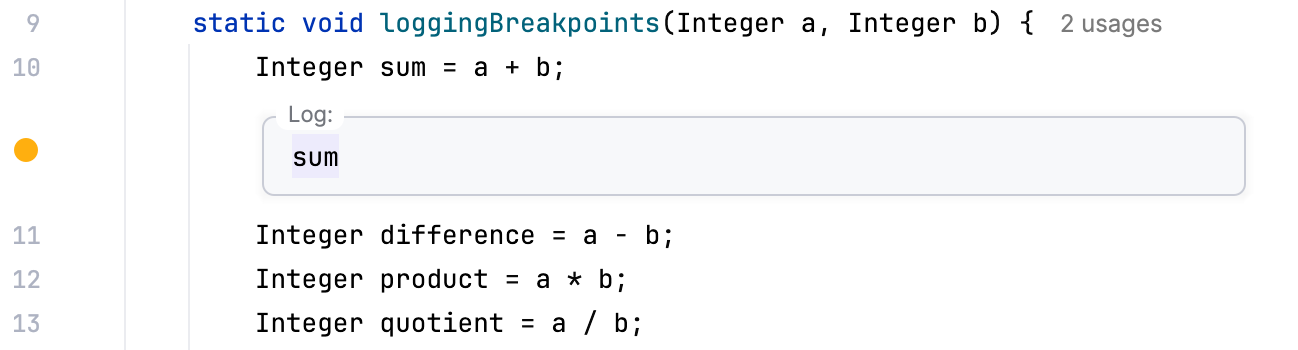
Convert an existing breakpoint to a logpoint
Right-click an existing breakpoint in the gutter, then click More, or press Ctrl+Shift+F8.
Configure the logging options.
Clear the Suspend checkbox if you want the breakpoint to log output without pausing the program. Leave Suspend selected if you want to log output and stop at the same breakpoint.
Logging options
When a breakpoint is hit, the following can be logged to the console:
"Breakpoint hit" message: a log message like
Breakpoint reached at ocean.Whale.main(Whale.java:5).Stack trace: the stack trace for the current frame. This is useful if you want to check what paths have led to this point without interrupting the program execution.
Evaluate and log: the result of an arbitrary expression, for example,
"Initializing"orusers.size().The expression disregards any access modifiers and is evaluated in the context of the line where the breakpoint is set.
The result of the expression is taken from the return statement. When there is no return statement, the result is taken from the last line of code, which doesn't have to be an expression: a literal works too. This can be used to produce a custom message or to keep track of some values as the program executes.
When evaluating expressions, make sure you are aware of their possible side effects as they may potentially affect the behavior and the result of the program.
Navigation and stack traces
Logpoints in IntelliJ IDEA let you navigate to the corresponding code and find out the actual code path that was taken when the logpoint was hit.
Click a log entry that was produced by a IntelliJ IDEA logpoint, then select Open. Alternatively, click it while holding Ctrl.
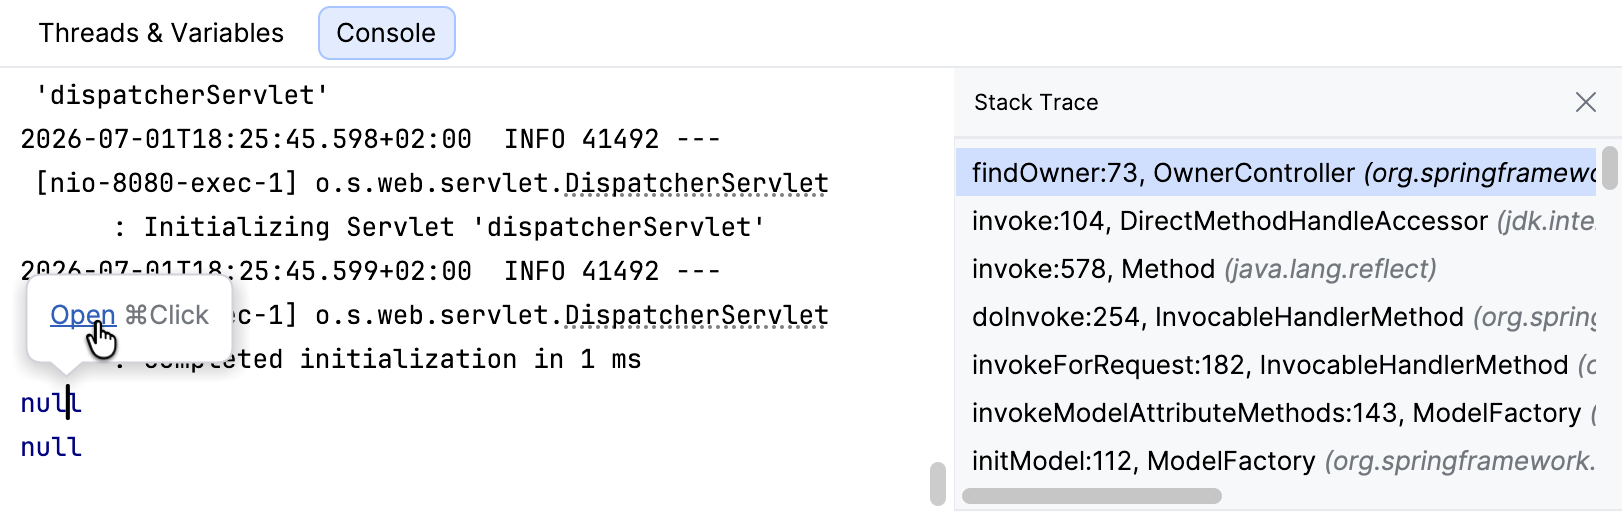
The corresponding code opens in the editor, and the Stack Trace tab opens with the thread's stack trace from when the logpoint was hit.
AI agent skill
IntelliJ IDEA bundles the ij-debugger coding agent skill that helps an agent collect runtime evidence with logpoints and, if necessary, escalate to suspending breakpoints, stepping, or expression evaluation.
It is helpful when an agent needs facts that aren't reliable from source code alone, such as runtime values, branch decisions, call order, thread context, or whether the program ever executes a specific line.
The skill documents the following interactions with IntelliJ IDEA:
start or reuse IntelliJ debugger sessions
discover and execute run/debug configurations
set logpoints
monitor debugger events
inspect and control suspended sessions
track agent-owned and manually set breakpoints
Enable or disable the skill
The skill is enabled by default, so you don't need to enable it explicitly. To disable it, go to and clear ij-debugger checkbox.
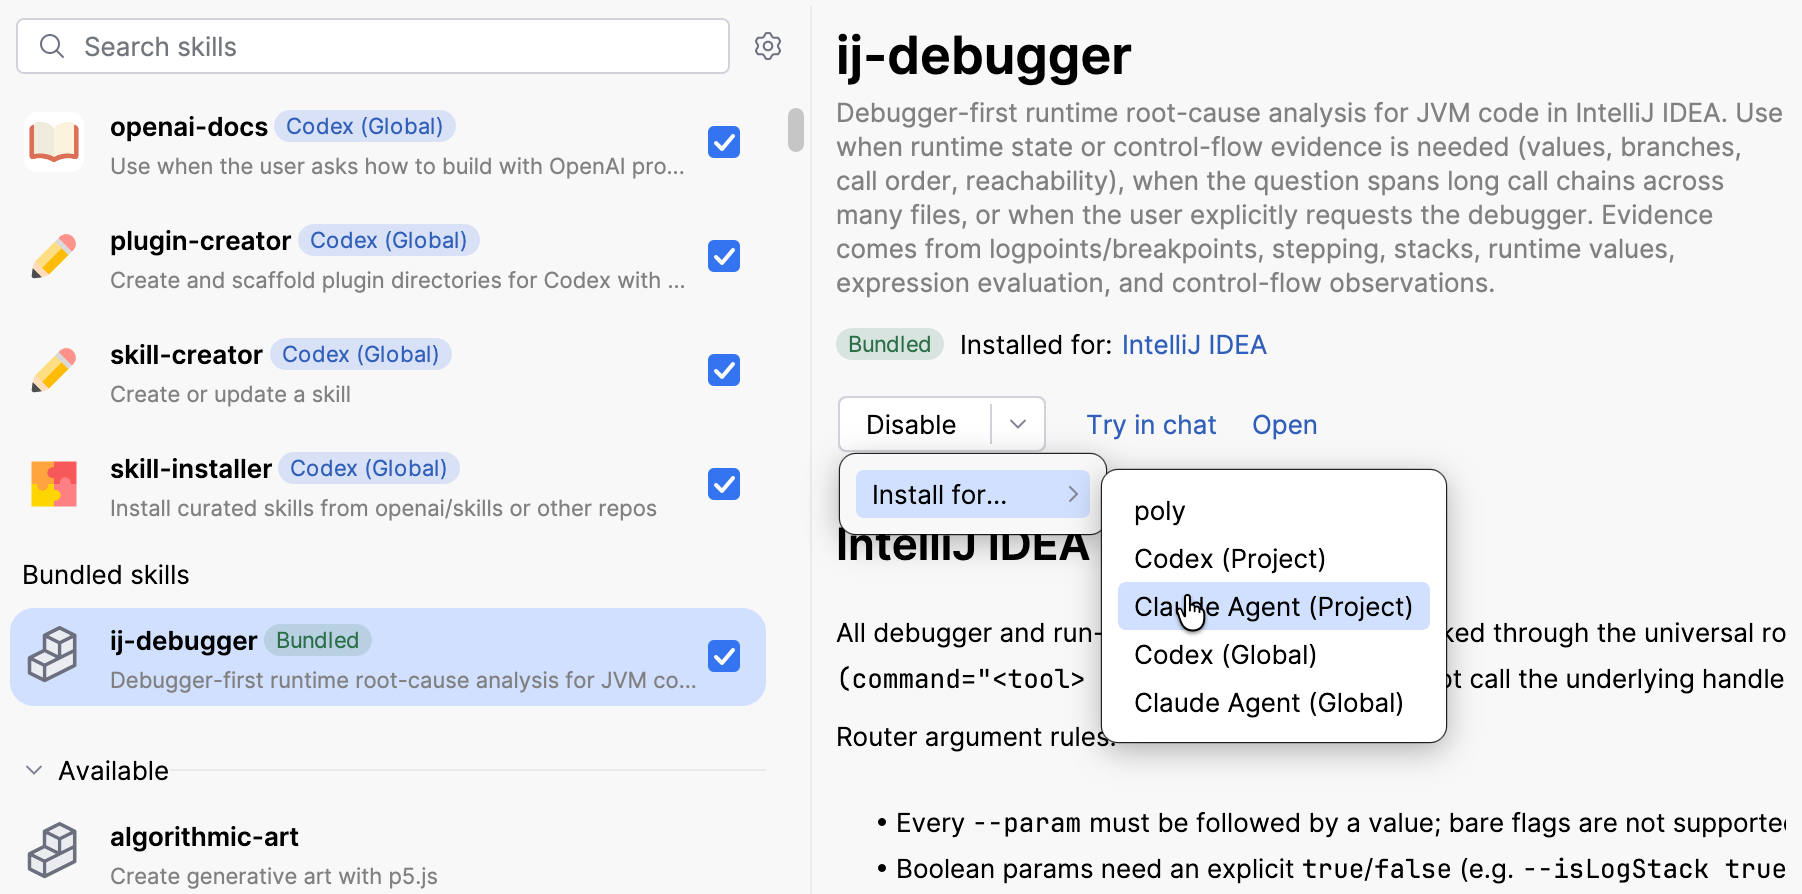
The skill works out-of-the-box for agents launched through AI Chat. For external agents, you can install it in the settings:
Install the skill to an agent
Go to and select ij -debugger.
Click the arrow button near Disable, then select Install for and select the AI agent.
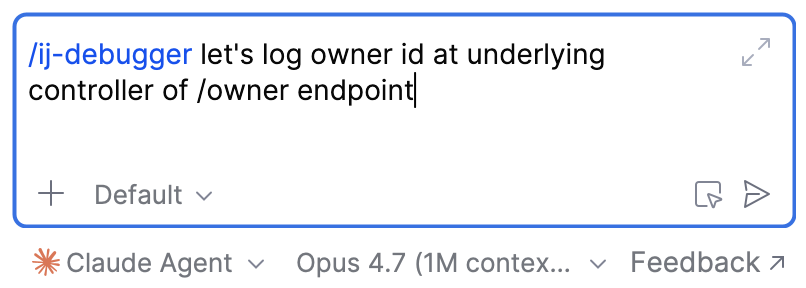
Use the skill
You can invoke the skill explicitly with the agent's syntax for calling skills. Alternatively, the agent can decide whether to use it for a particular problem.
Narrow the logging
Because logpoints are regular breakpoints with logging options, you can combine them with other breakpoint properties.
- Condition
Add a condition to log output only when a Boolean expression evaluates to
true. The condition must be valid at the line where the breakpoint is set.- Pass count
Specifies that the breakpoint should work only after it has been hit a certain number of times. This is useful for debugging scenarios that involve suspending the application in long-running loops or for selectively logging frequent events.
Once the count completes, it resets and starts again. This means that if Pass count is set to
10, the breakpoint will work every tenth time it is hit.If both Pass Count and Condition are set, IntelliJ IDEA first satisfies the condition and then checks for Pass Count.
- Filters
Use filters to restrict the breakpoint to specific classes, object instances, or caller methods. This is useful when the same code is reached from many places and you only need log output for one path.
- Dependent breakpoints
A non-suspending breakpoint can act as a trigger for another breakpoint in Disable until hitting the following breakpoint. Use this when a later breakpoint should become active only after a specific code path is reached.
For the complete list of breakpoint properties, refer to Configure breakpoints' properties.
Logpoint icons
Non-suspending breakpoints use a different gutter icon from regular suspending breakpoints.
Line | Method | Field | Exception | |
|---|---|---|---|---|
Non-suspending |
|
|
| |
Verified non-suspending |
|
|
|


Manage logpoints
Logpoints appear in the same Breakpoints dialog as other breakpoints. From there, you can disable, mute, remove, describe, and group them together with the rest of your breakpoint setup.
For more information, refer to Breakpoints.