Customize views
During a debugging session, IntelliJ IDEA shows you information about your variables, types, threads, frames, and more. However, you may want to focus on specific runtime details and have the data filtered or rendered in a specific format. In this scenario, IntelliJ IDEA lets you customize the how the debugger's output appears Debug tool window and the editor.
Customize the threads view
You can customize how threads are displayed on the Frames and Threads tabs. It might be helpful when you are often navigating in the application's threads, and are interested in their specific details, such as which group a thread belongs to.
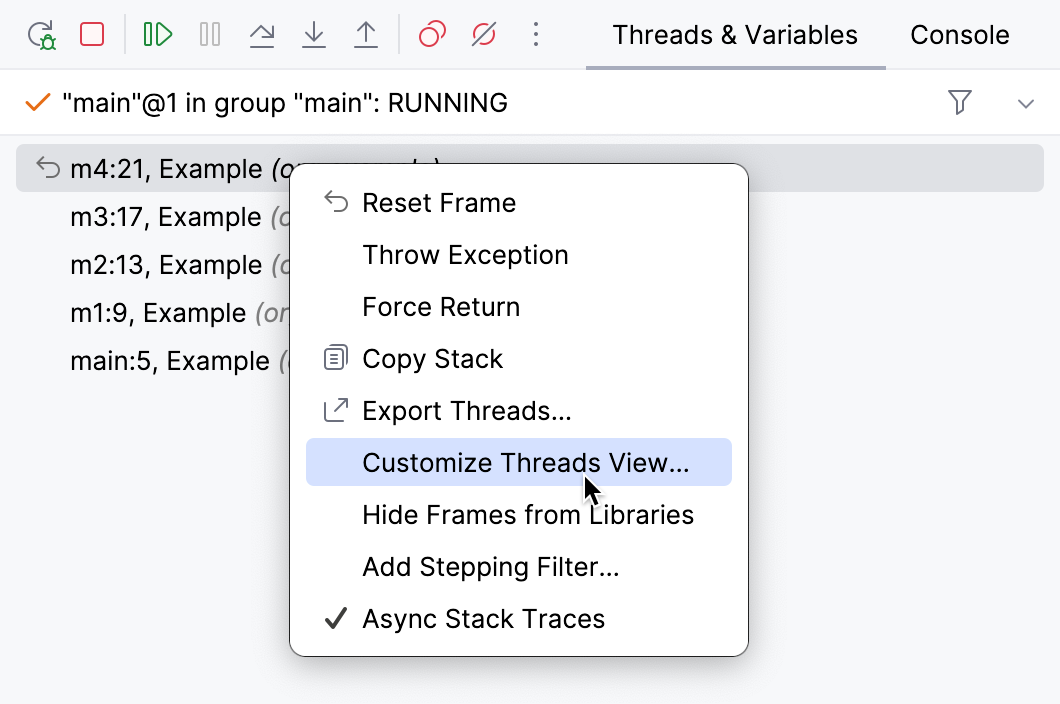
Right-click anywhere in the Frames or Threads tab and select Customize Threads View.

Item | Description |
|---|---|
Show thread groups | If this option is selected, threads appear in a hierarchy of thread groups. Having a tree-like hierarchy is useful when your program manages a number of similar threads in groups. Also, the option separates system threads from the user-defined ones, making it easier to navigate in the list. In order for a thread to appear in a particular group, use |
Show stack frames for synthetic methods | Specify whether you want to see stack frames for synthetic methods (the methods introduced by the compiler, which are not present in the source code). An example of such method is a method created by an inner class so that the enclosing class could access its private members. |
Move current thread to the top | Keeps the current thread on top of the list (when Show thread groups is disabled). |
Show line number | Shows the number of the line that is currently executed. This feature requires that the application is compiled with line number information. |
Show class name | Shows the name of the class containing the method. When the code inside an anonymous inner class is executed, the name of the enclosing class is displayed instead, followed by a dollar sign and a number, for example: Keeping this option enabled is useful when you are dealing with inherited methods and there is a need to quickly differentiate between method implementations in subclasses. |
Show package name | Shows the name of the package for classes. The code in the default package is not marked. This option is only active when Show class name is enabled. Use it when there is ambiguity that class name alone does not eliminate (like |
Show source file name | Shows the name of the source file for classes. |
Show method arguments types | Shows the types of the arguments that a method takes. This is useful when dealing with overloaded versions of the same method. |
Customize data view
IntelliJ IDEA allows you to configure which information about the variables you want to get. For example, you may choose to show/hide instance IDs or use the toString representation for viewing particular sets of classes.
Unless explicitly specified, these preferences apply to all the places where the variable values are displayed (the Variables tab, inline values view, tooltips, and so on).
Sort variables alphabetically
If required, you can enforce alphabetic ordering for items in the Variables tab.
Press Ctrl+Alt+S to open settings and then select .
Select the Sort Variables Alphabetically option.
Configure automatic expression evaluation
The debugger analyzes the statement at the breakpoint and its nearest surrounding statements to find various expressions in the source code, such as myvar.myfield.
If they don't contain explicit method invocations, the debugger evaluates them and shows the corresponding values in the Variables view.
To disable automatic evaluation of expressions:
Press Ctrl+Alt+S to open settings and then select .
Clear the Enable auto expressions in Variables view option.
Show/hide object types
You can select whether to display the type of the object for the corresponding reference-type variables.
Right-click anywhere in the Variables tab and turn Show types on or off.
The displayed type is the type of the actual object and not the type of the variable that holds the reference. If you want to toggle the visibility of the declared type, use the Declared type option in the Customize Data Views dialog.
Configure display of specific types
You can fine-tune how particular types are displayed. The properties described here are suitable for the most common cases. For custom configuration, refer to type renderers.
Right-click anywhere in the Variables tab and select Customize Data Views.
Item | Description |
|---|---|
Autoscroll to new local variables | Automatically scrolls to new variables that appear in the scope when stepping. |
Predict condition values and exceptions based on data flow analysis. | Enables editor hints for boolean expressions or exceptions that are known beforehand based on information from data flow analysis. For more information, refer to Inline variables view. |
Show |
|
Show type for strings | Shows type for |
Show hex value for primitives | Adds hexadecimal format for |
Hide null elements in arrays and collections | Excludes |
Auto populate Throwable object's stack trace | When the program is suspended after throwing an exception or error, its stack trace doesn't have any elements in it yet. For the stack trace to be populated, you have to call |
Enable alternative view for Collection classes | Select this option to display contents of classes that implement |
Enable toString() object view | Allows you to configure which classes use the result of
|
Custom type renderers
IntelliJ IDEA allows you to provide a custom display format for various types. This can be achieved by using renderers. A renderer is a special expression associated with a particular type, which controls how the instances of this type are displayed during a debugging session.

Renderers support all types including primitives and arrays. Also, renderers disregard all access modifiers, so you can access any field irrespective of whether it is encapsulated.
In renderers, you can implement any transformations including sorting and reduction to produce the desired output. You can even utilize sun.misc.Unsafe to display the actual memory addresses during debugging (although this is not recommended).
Renderers are particularly useful when you are working with custom collections, whose contents aren't easily readable, and you need to identify their contents at a glance.
Add a renderer
Right-click anywhere in the Variables tab and select Customize Data Views.
On the Java type renderers tab, click
Alt+Insert and configure the renderer expression.
For example, if you want to view an object according to its
namefield, usethis.nameas the expression. For more advanced configuration, see the Renderer properties chapter.Apply the changes and review the updated presentation in the Variables tab.
Renderer properties
Item | Description |
|---|---|
Renderer name | The name of the renderer. This name is used for managing renderers and doesn't affect how actual data is displayed. |
Apply renderer to objects of type (fully-qualified name) | The object type to which this renderer applies. Enter the fully qualified name of the class or click Browse If the class uses generics, use raw types for them. Due to type erasure, generic types have no effect in renderers. |
When rendering a node | This option determines how an object itself is displayed:
|
When expanding a node | This option determines how the contents of an object are displayed when it is expanded.
|
Append default children | Controls whether the fields of the object (that would be normally displayed when no renderer is specified) should appear along with the expression results. This option is only available with Use list of expressions. |
Remove a renderer
Right-click anywhere in the Variables tab and select Customize Data Views.
On the Java type renderers tab, select the renderer that you are going to remove and click
Delete. Then, apply the changes.
Mute renderers
You can temporarily disable renderers without removing them altogether:
To mute a single renderer, right-click anywhere in the Variables tab and select Customize Data Views. On the Java type renderers tab, clear the box against the renderer you are going to mute and apply the changes.
To mute all renderers, right-click anywhere in the Variables tab and select Mute Renderers.
When required, you can unmute the renderers using the same procedure.
Add a renderer using annotation
You can assign type renderers to your classes using IntelliJ IDEA's built-in annotations. Annotations are useful when you need to share renderers with your team members. Once configured, the renderer will apply to the class (and its subclasses) every time you debug the code that is using them.
On the line preceding the class declaration, add the
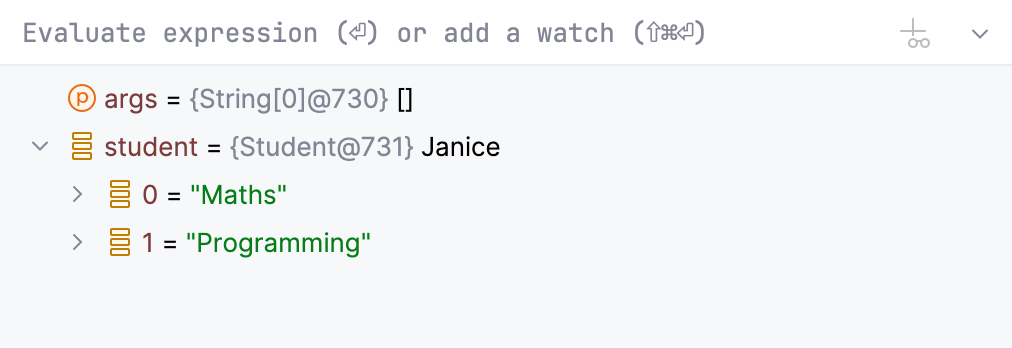
@Rendererannotation, for example:import org.jetbrains.annotations.Debug.Renderer; @Renderer(text = "name", childrenArray = "courses.toArray()", hasChildren = "courses.!isEmpty()") public class Student { private String name; private List<String> courses; Student(String name, List<String> courses){ this.name=name; this.courses=courses; } }
text() | Specifies the expression for displaying the rendered object. |
childrenArray() | Specifies the expression for displaying the children of the rendered object. The return value of the expression has to be an array. |
hasChildren() | Specifies the expression for checking whether the node should be expandable. |
Productivity tips
- Use renderers in big projects
While creating your own renderers takes some time, it will pay back if you are working with a big project where you spend a lot of time working with custom classes.
- Implement sorting in renderers
The expression used for displaying node children returns an array. Since arrays are ordered, this allows you to implement sorting for otherwise unordered structures like
HashMap. This is useful, for example, when you have a map of users and want to view them sorted by email address.