Code coverage
Code coverage in GoLand lets you analyze which lines of code were executed during a particular run. It helps determine the share of code covered by tests and identify areas that lack sufficient test coverage.
Run with coverage
The entry points for running coverage analysis are the same as you would normally use to run an application:
For main method definitions, click
 Run in the editor gutter, then select Run with Coverage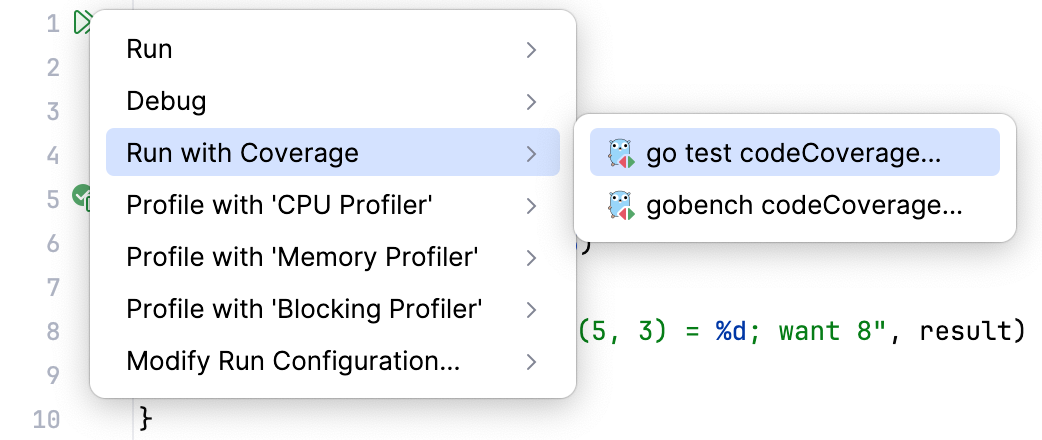
For run configurations, click
 More Actions in the Run widget, then select Run with Coverage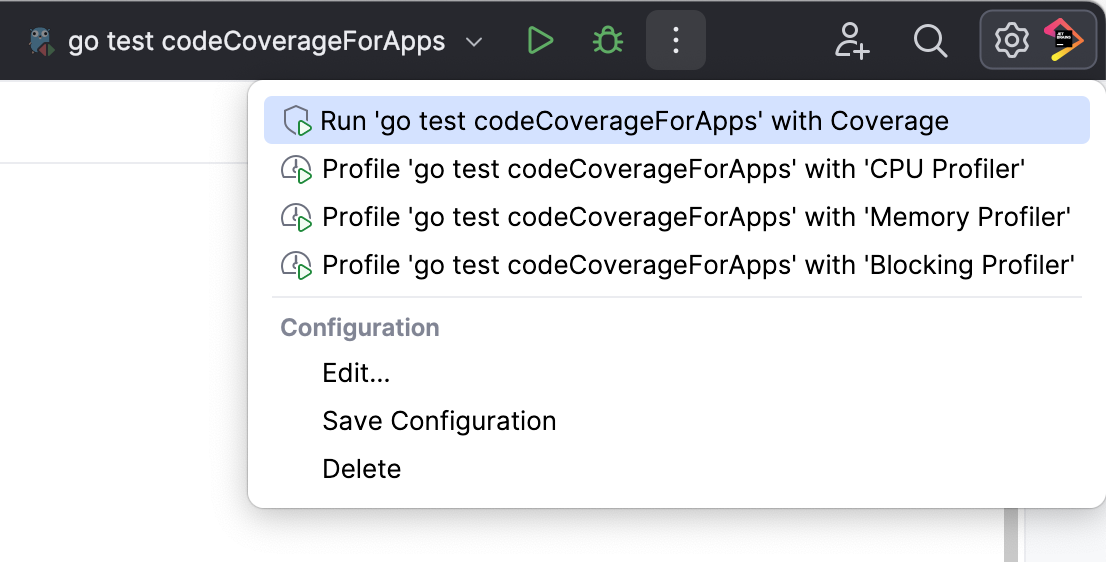
Coverage analysis executes the corresponding run configuration with the coverage agent attached. This agent instruments the bytecode to keep track of the execution line-by-line. After the execution completes, the results of the analysis appear in the IDE.
Coverage suites
A coverage suite is a collection of code coverage data from a specific run. Each coverage suite stores data from either a single run configuration (if it was run with coverage) or from an imported coverage data file.
GoLand stores coverage suites in the coverage folder of the IDE system directory:
%LOCALAPPDATA%\JetBrains\GoLand2026.2\coverage
~/Library/Caches/JetBrains/GoLand2026.2/coverage
~/.cache/JetBrains/GoLand2026.2/coverage
GoLand can display results from one or more coverage suites at the same time, and you can select which suites to show. If multiple suites are selected, the IDE displays their merged results: this means that a line is considered covered if it was executed in at least one of the suites.
Manage suites
In the main menu, go to (Ctrl+Alt+F6).
In the Choose Coverage Suite to Display menu:
Use the checkboxes to select active suites. Active suites define the coverage data that is currently displayed in the IDE.
Use
 Add to import a external suite file, for example, generated in the CI server or sent to you by someone else.
 Use
 Remove to remove a suite from the list but keep the file in the storage.
Use
 Delete to remove a suite from the list and delete the file from the storage.
Read coverage data
GoLand shows coverage results in:
Coverage tool window
Project tool window
Editor
Code coverage results are displayed in the Coverage tool window, in the Project tool window, and in the editor after you launch at least one run configuration with coverage.
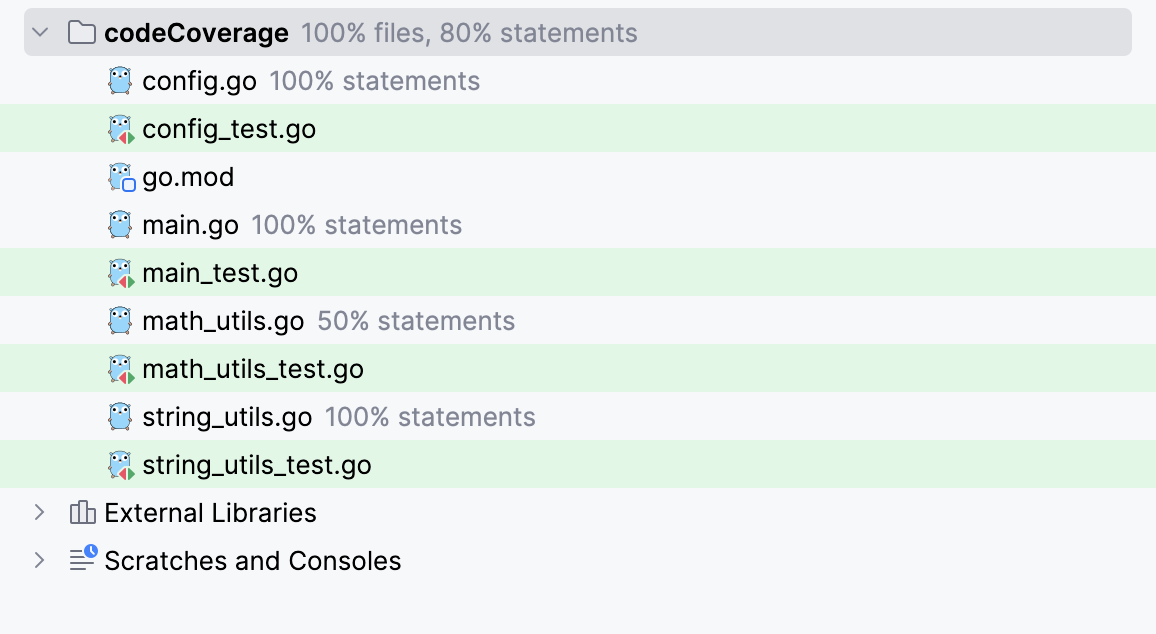
Project tool window
The Project tool window displays:
the percentage of the covered classes and lines for directories
the percentage of the covered methods and lines for classes
Coverage tool window
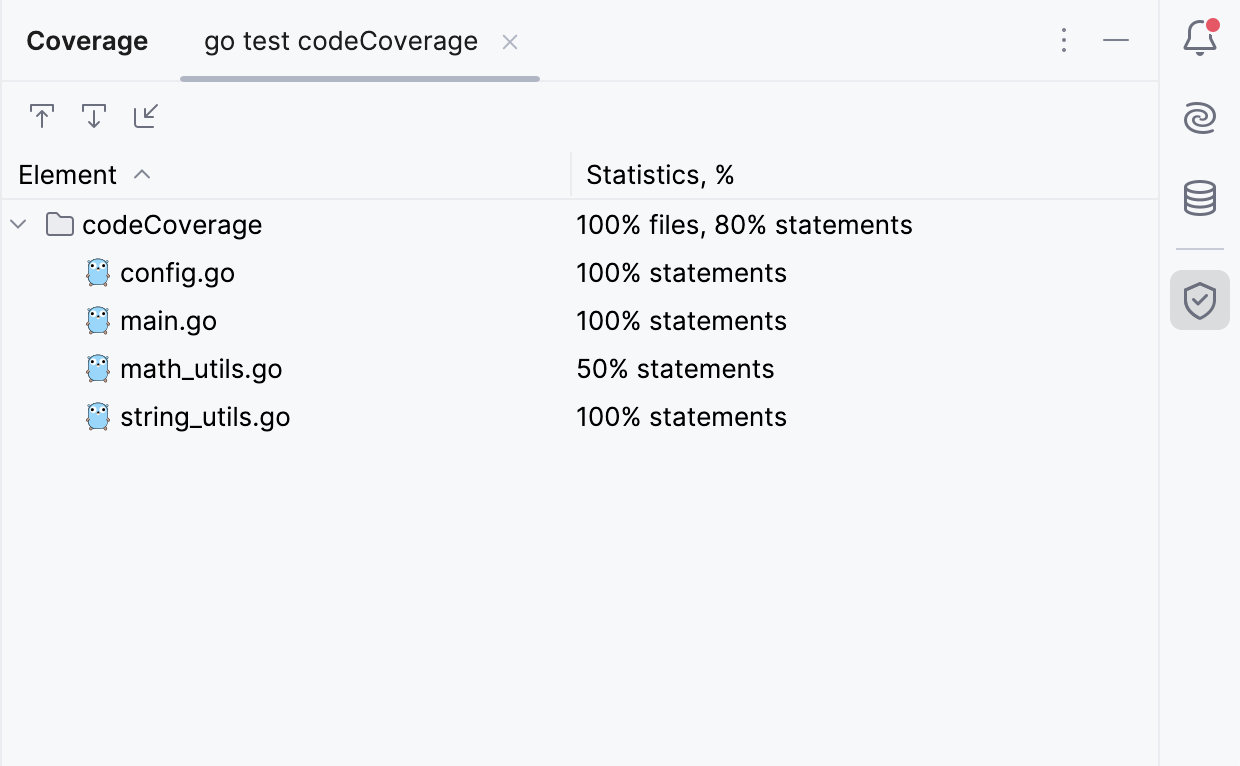
The Coverage tool window has the following options:
Item | Description |
|---|---|
| If this option is on, GoLand automatically opens the selected item in the editor. Otherwise, you need to double-click items to open them. |
| If this option is on, GoLand automatically locates in the tool window the files that you open in the editor. |
| Import a coverage suite from disk. |


Editor
The editor displays the coverage status of individual code lines. The status is indicated by color-coded markers in the gutter:
Green (
 ): the code line was executed.
Yellow (
 ): the code line was executed partially. This happens when the code line contains conditional logic (such as an
 if/elsestatement, a loop, or aswitchstatement), but only some of its branches were run.Red (
 ): the code line was not executed.
To open a popup with coverage statistics for a specific line, click its coverage marker in the gutter.
Hide coverage data
Do one of the following:
Close the tab with coverage statistics in the Coverage tool window ().
Click coverage highlighting in the gutter and select Hide coverage.
Configure code coverage
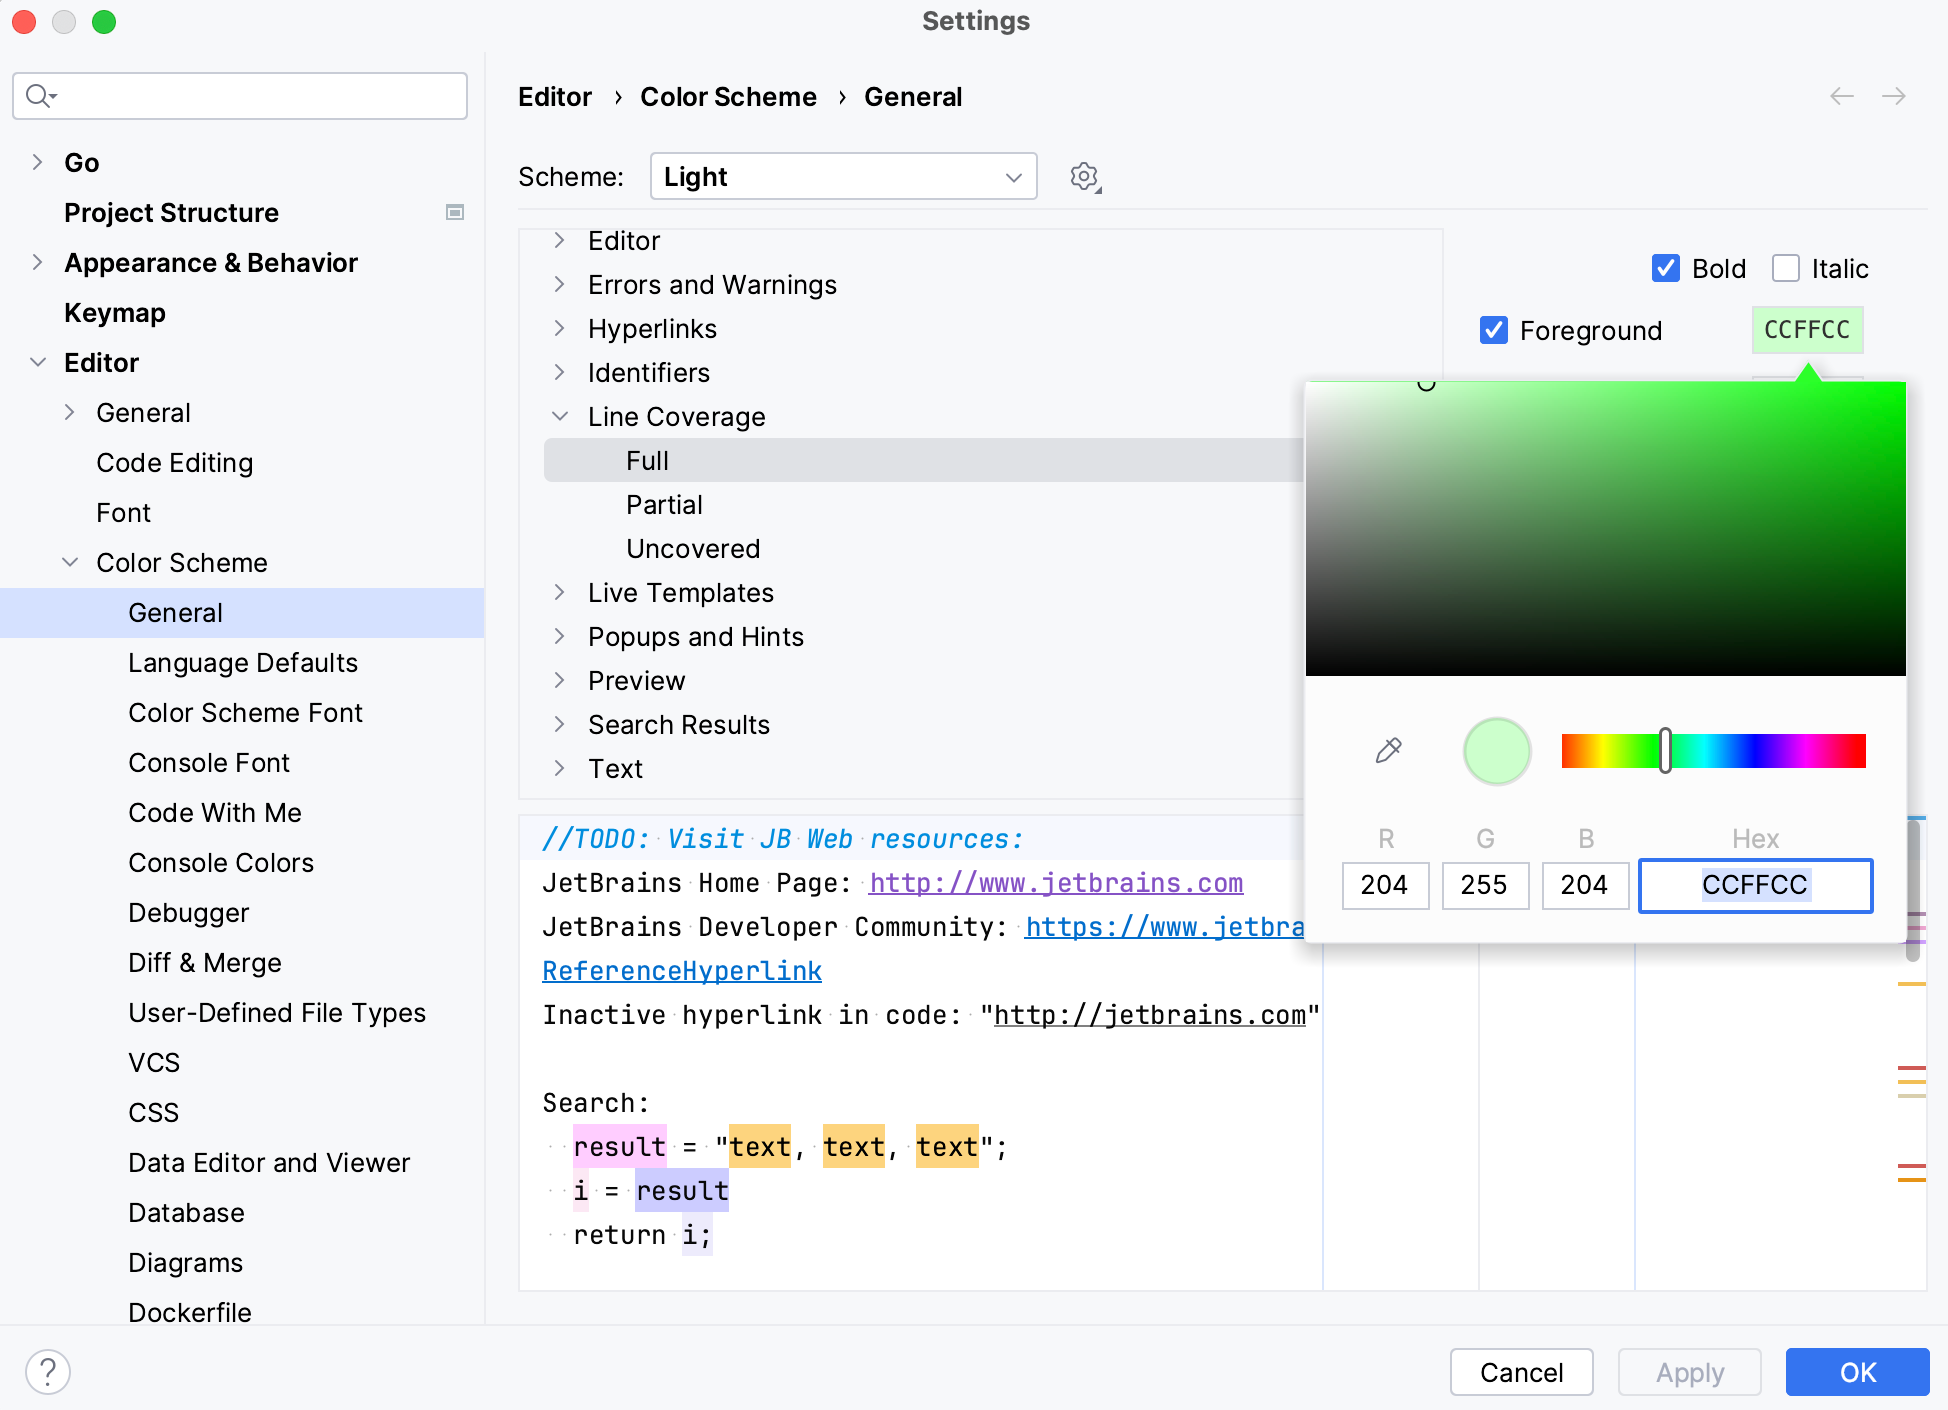
Change colors of the coverage highlighting
Press Ctrl+Alt+S to open settings and then select .
Alternatively, click
 in the popup that opens on clicking the coverage indication line in the gutter.
In the list of components, expand the Line Coverage node and select a type of coverage: for example, Full, Partial or Uncovered.
Click the Foreground field to open the Select Color dialog.
Select a color, apply the changes, and close the dialog.