Database Output tool window
The Database Output tool window displays execution output, query results, and query execution plans. You can use it to switch between results from query consoles and SQL files, view the queries that produced them, and open result sets in separate editor tabs.
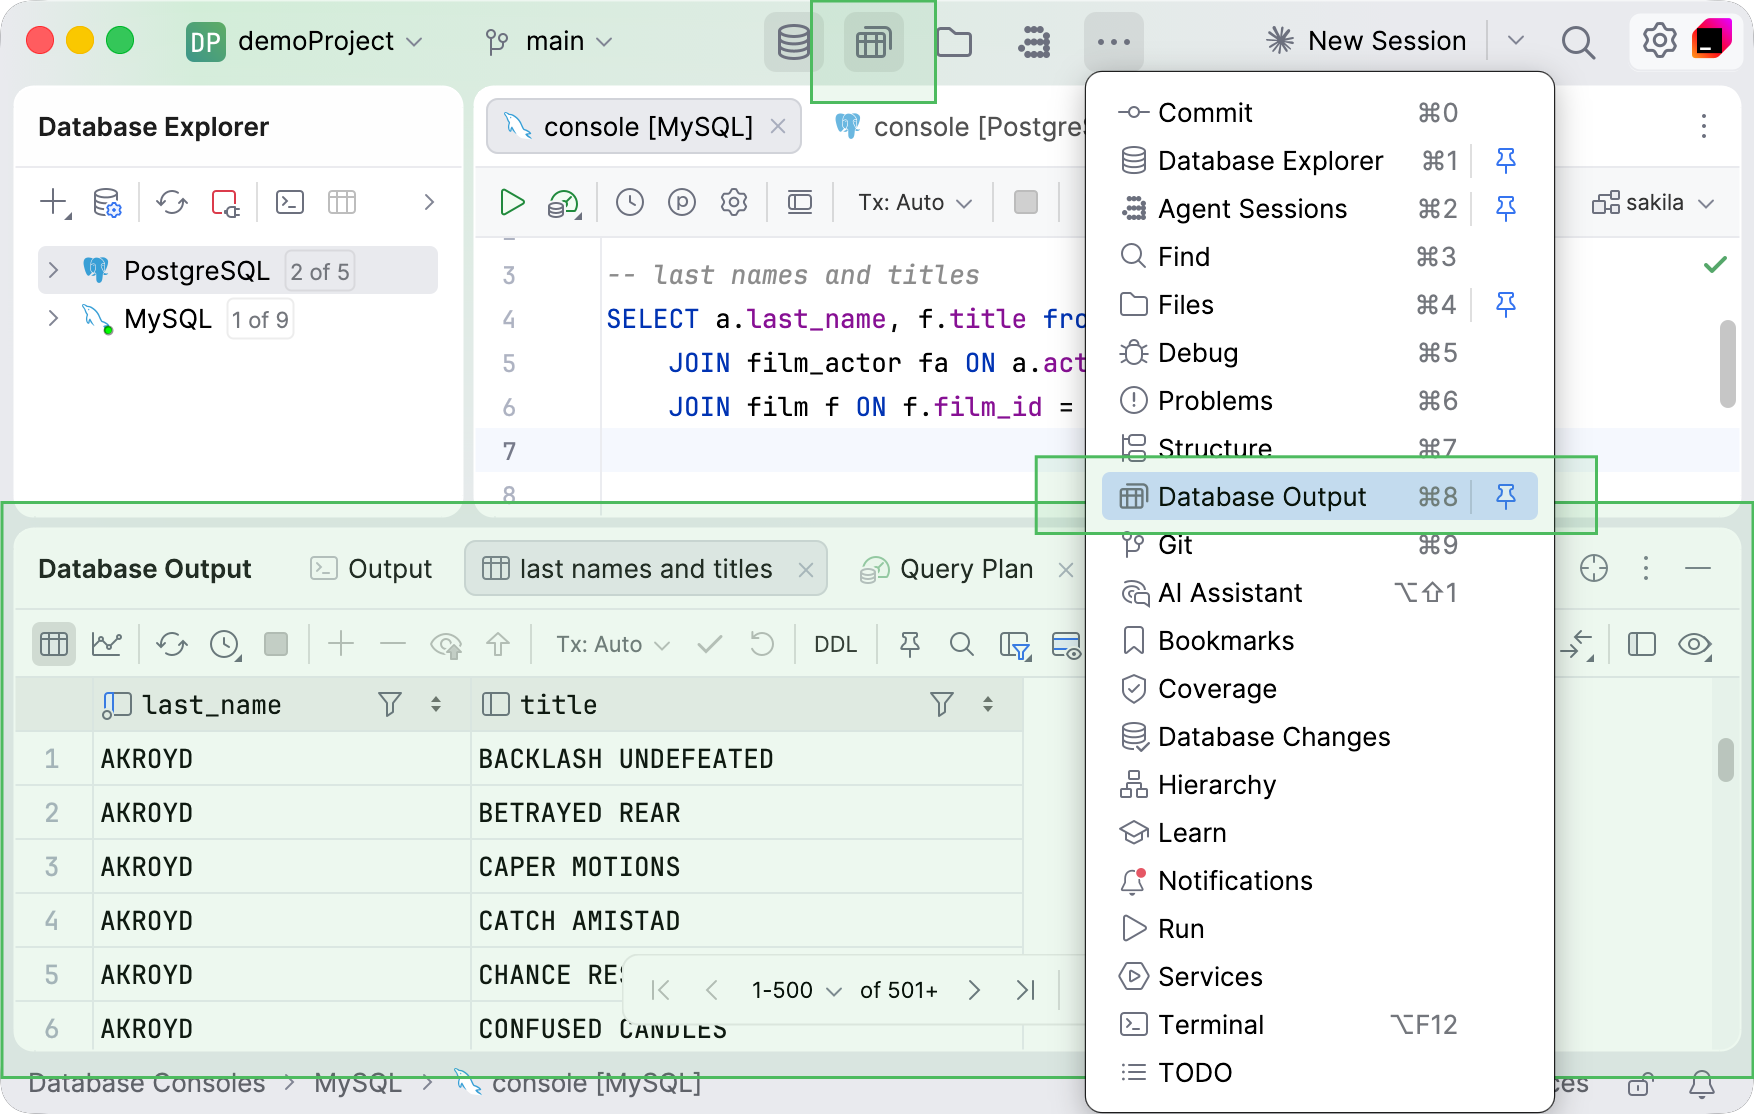
The tool window opens automatically when you run a query, a database run configuration, an SQL file, or generate a query execution plan. By default, it opens at the bottom of the IDE.
To show or hide the tool window, click More tool windows on the toolbar in the window header and select Database Output. For more information about moving and arranging tool windows, refer to Tool windows.
DataGrip can also display query results in the Services tool window. To switch to this tool window, press Ctrl+Alt+S to open settings and select Database | Query Execution | Output and Results. In Show results in, select Services tool window.
Session management is available in the Services tool window.
Contents overview
The tool window contains the following elements:
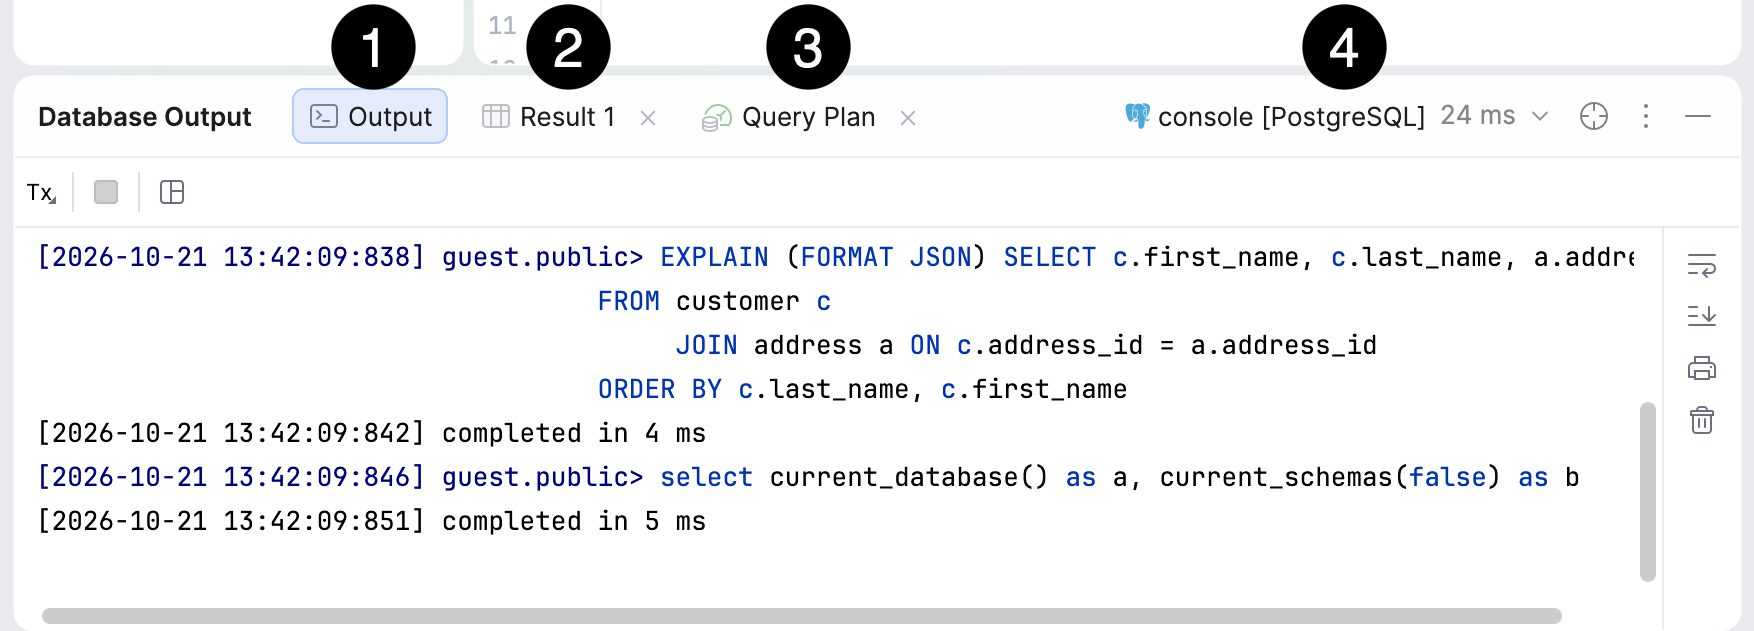
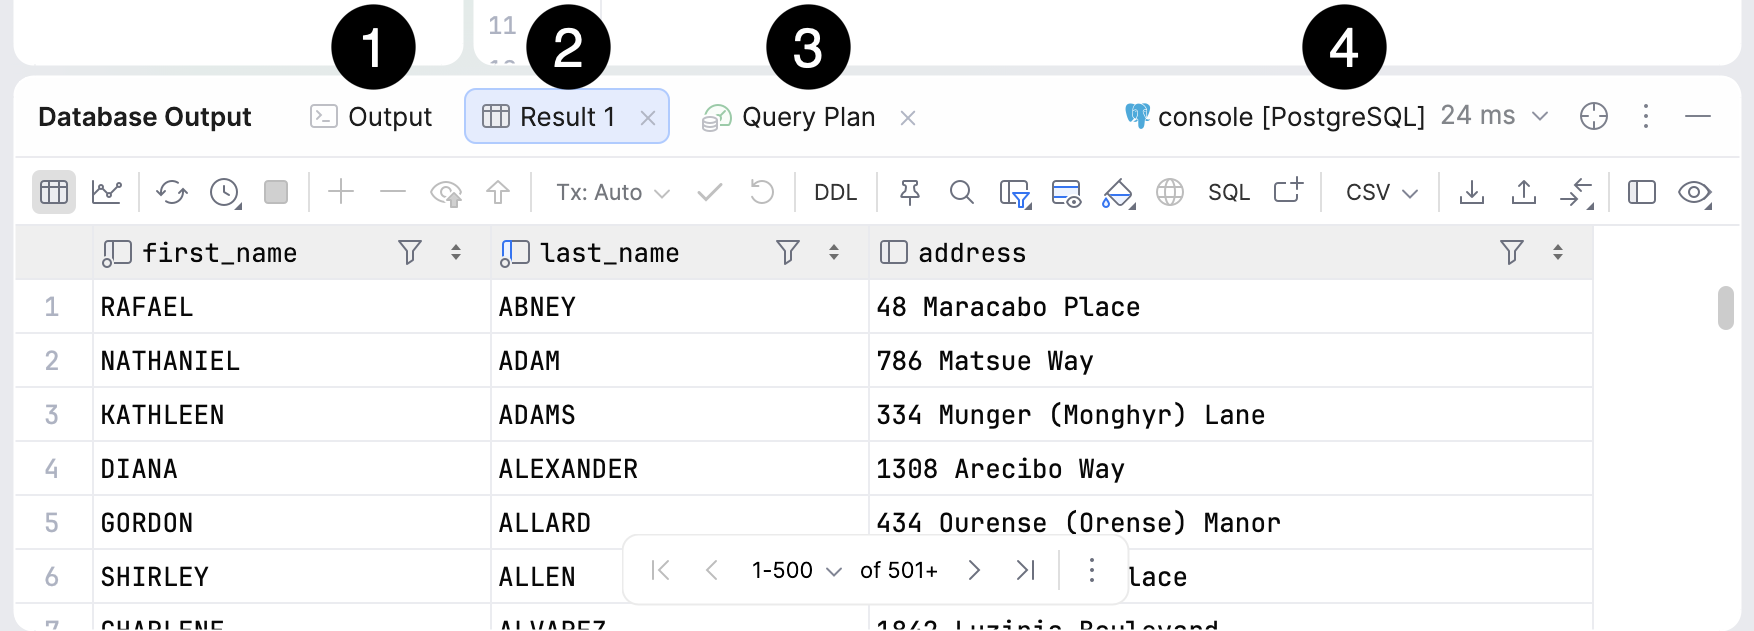
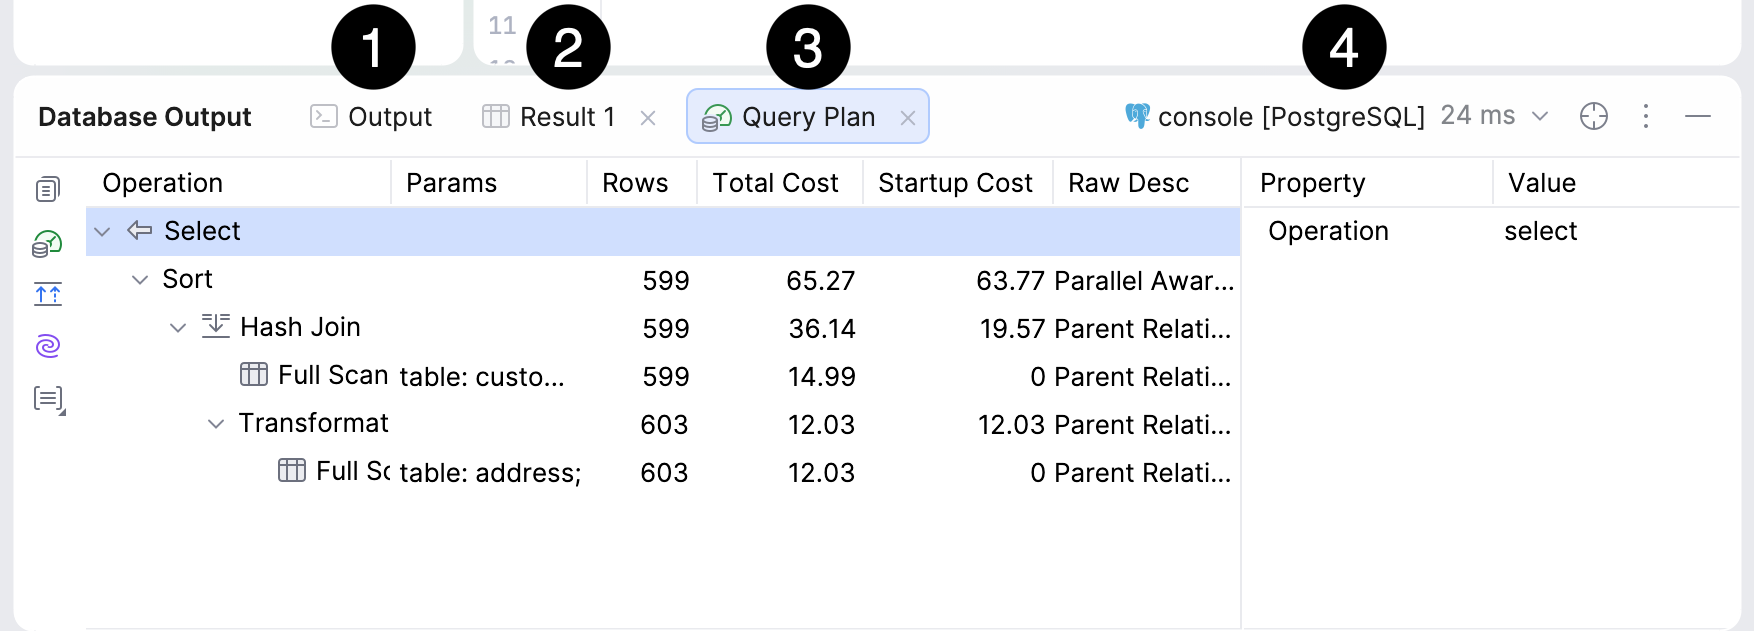
By default, the contents of the tool window follow the active editor tab, showing the corresponding output, query results, and query plan. When you switch to a query console that has no results, the tool window displays its Output tab. Running a query automatically selects the relevant result tab.
Open session details
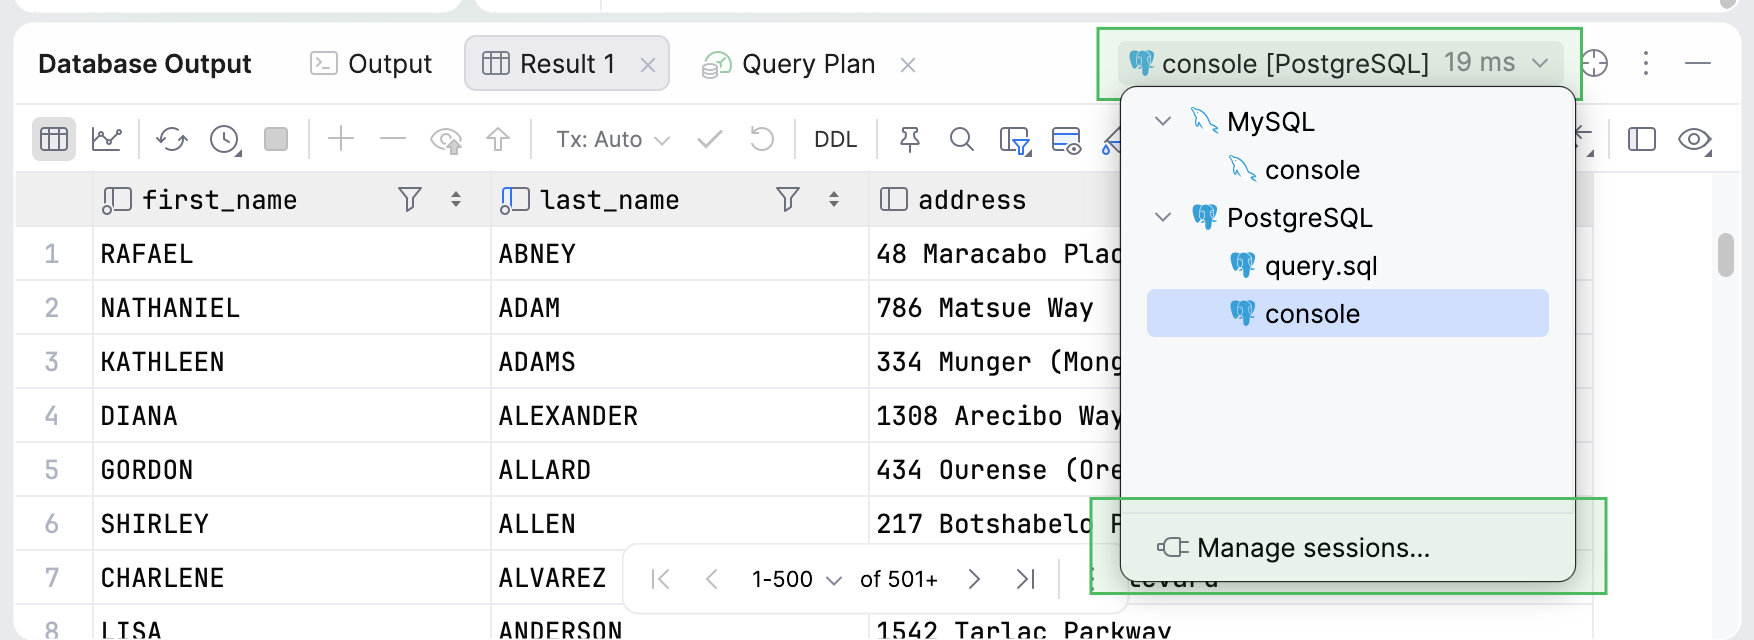
To open session details for the selected query console or file, open the sessions dropdown on the right side of the toolbar and select Manage Sessions.
DataGrip opens the corresponding session details in the Services tool window.
For more information about managing sessions and attaching clients to them, refer to Sessions.
Output tab
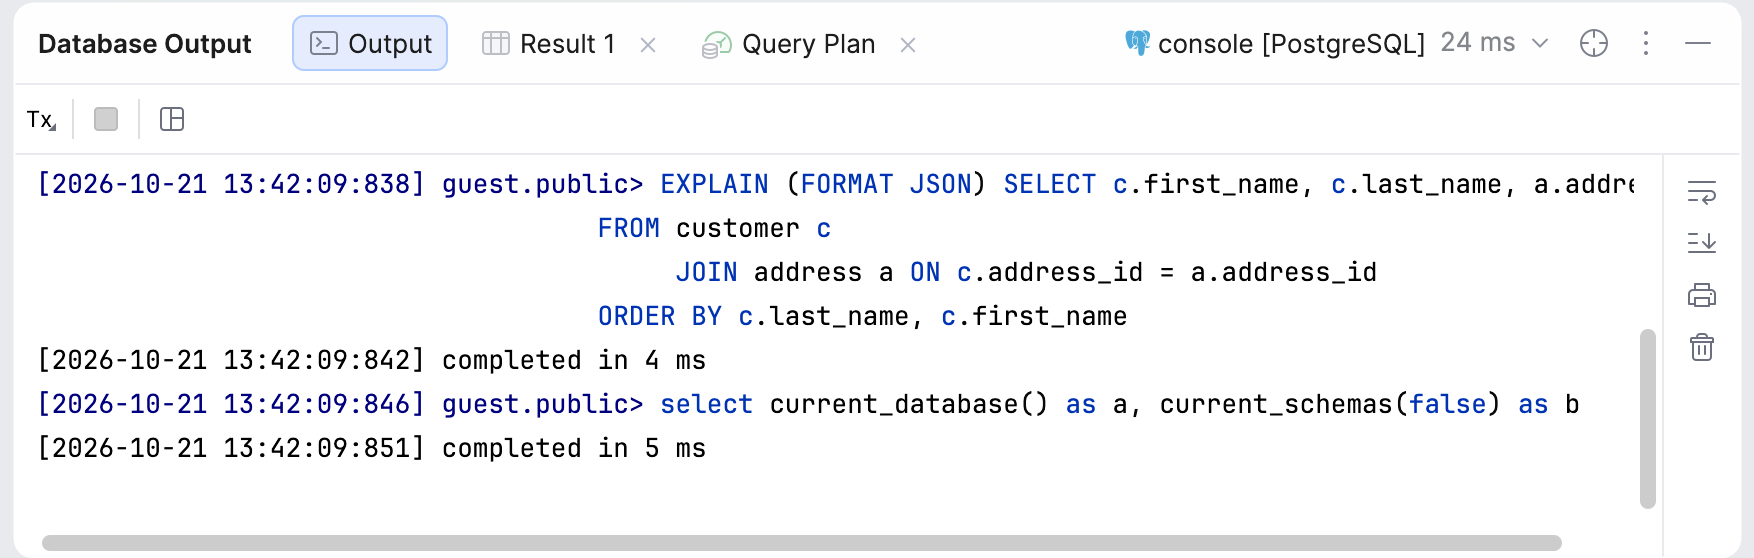
The Output tab displays a log of executed SQL statements and database operations, including execution messages and errors. Depending on the operation and output settings, the log can also include timestamps, affected row counts, and execution times.
The tab also displays output from queries that DataGrip runs when you open a database table in the data editor. For output settings, refer to Output and Results.
Toolbar
-
TxTransaction Mode and Transaction Isolation Select the isolation level for database transactions and the way the transactions are committed.
Auto: the current transaction is committed automatically when you submit your local changes to the database server.
Manual: the changes submitted to the database server are accumulated in a transaction that can either be committed or rolled back explicitly by means of
 Submit and Commit or
 Roll Back buttons on the toolbar.
For more information about database transaction modes and isolation, refer to Submit changes to a database.
 Cancel Running Statements Ctrl+F2
Terminate execution of the current statement or statements.
 Restore Default Layout
Restore default positions of visual elements in the tab.
Right toolbar
 Soft-Wrap
Wrap long lines of text.
 Scroll to End
Scroll the output log to the end.
 Print…
Print a console file, a selected text, or all the files in a directory.
 Clear All
Clear the Output tab.
Result tab
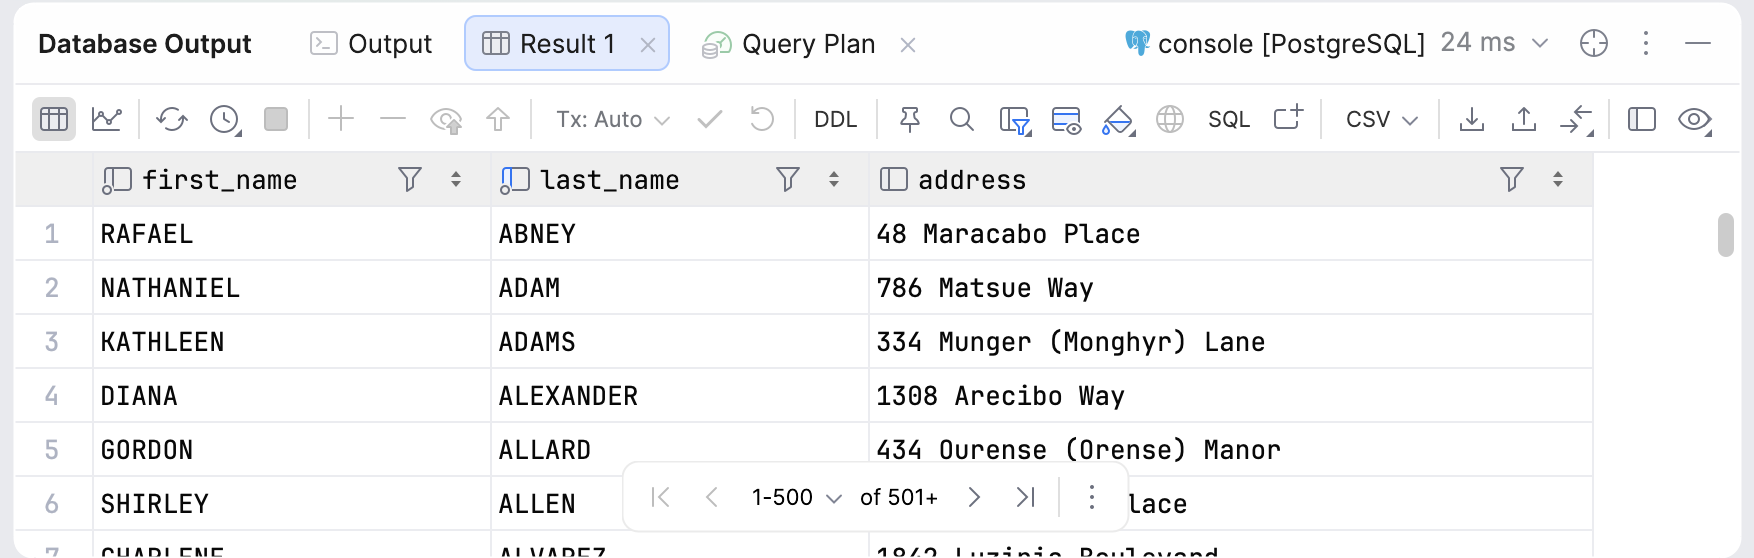
Each Result tab displays a query result set in a data editor. You can browse the data and use the data editor controls to work with it. For more information about data editor and viewing and working with result sets, refer to Data editor and viewer and Query results.
Toolbar controls
Icon | Action and shortcut | Description |
|---|---|---|
| Switch to Table | View the query results as a table in data editor. |
| Switch to Chart | View the query results as a chart. |
| First Page Previous Page Ctrl+Alt+Up Change page size Next Page Ctrl+Alt+Down Last Page | Available on the toolbar if the position is selected in the IDE settings (Ctrl+Alt+S) under . Use navigation icons and corresponding commands for switching between pages that show the retrieved data and change the page size. A number of rows that you see on the Result tab are referred to as a result set page. If this number is less than the number of rows that satisfy the query, only a subset of all the rows is shown at a time. If all the rows are currently shown, navigation icons and the corresponding commands are inactive. You can see the limit between the navigation buttons. You can change it here by clicking and selecting the necessary limit or in settings.
To change the size of a result set page, click the Change page size button and select the size. Alternatively, open settings (Ctrl+Alt+S) and navigate to . In the Limit page size to field, type a new size of a result set page. Alternatively, to disable the page size restriction, clear the Limit page size to checkbox. |
| Reload Page Ctrl+F5 | Reload data for the table view to synchronize the data that you see in the editor with the contents of the database. Also, use the Reload Page button when you want to apply a new page size limit setting after its change. |
| Update Interval | Select, pause, or disable update interval for the current table. You can also set a custom one. |
| Cancel Running Statements Ctrl+F2 | Terminate execution of the current statement or statements. |
| Add Row Alt+Insert | Add a row to the table. To save a new row, click The Add Row button is disabled in the inappropriate context. For example, if the current table does not permit adding rows. For more information about working with rows, refer to Rows. |
| Delete Row Ctrl+Y | Delete the selected row or rows. To select multiple rows, click numbers in the gutter. Also, you can press Ctrl and click the necessary rows. The Delete Row button is disabled in the inappropriate context. For example, if the current table does not permit removing rows. |
| Revert Selected Ctrl+Alt+Z | Revert changes that you made to a cell value. You can select a scope of different cells and revert values in this scope. For more information about reverting changes, refer to Submit changes to a database. |
| Preview Pending Changes | Preview DML of changes that you made to the table. |
| Submit Ctrl+Enter | Submit local changes to the database server. For more information about submitting and reverting changes, refer to Submit changes to a database. |
| Transaction Mode and Transaction Isolation | Select the isolation level for database transactions and the way the transactions are committed.
For more information about database transaction modes and isolation, refer to Submit changes to a database. |
| Submit and CommitCtrl+Alt+Shift+Enter | (For the Manual transaction mode.) Submit and commit the current transaction. This button is available only for the manual transaction mode. See also, transaction mode and isolation. |
| Roll Back | (For the Manual transaction mode.) Roll back changes. This button is available only for the manual transaction mode. See also, transaction modes and isolation. |
| Find on Current Page | Client side text search for the current page. |
| Enable Local Filter | Enables a local filter for every column of the grid. For more information about local filter, refer to the Filter data topic. |
| Record View | View and edit values of a certain record in a side panel. For more information about the action, refer to the View data topic. |
| Show Geo Viewer | Enables a graphic viewer to explore geospatial data in your database. For more information about the Geo viewer, refer to the Using Geo viewer for geographical data in PostgreSQL. |
| Show Chart | Opens data visualization. For more information about about charts, refer to Visualize data. |
| Data Extractors | Select an output format for your data. For the list of available formats and full information about data extractors, refer to the Data extractors topic. Also, you can configure the following options:
For more information about data extractors, refer to the Data extractors topic. |
| Export Data | Export the table data to the clipboard or save to a file. |
| Copy to Database | Copy the data to another table, schema or database. Select the target schema (a new table will be created) or table (the data will be added to the selected table). In the dialog that opens, specify the data mapping info and the settings for the target table. |
| Compare Data | Compare the current table with a table from the list. For more information about comparing tables, refer to Compare table data. |
| View as | Select the mode for browsing and editing table data.
For more information about viewing data, refer to View data. |
| Show Options Menu | The Show Options Menu list includes the following options:
|







Context menu
You can find all basic actions for working with cells under the context menu. To call the context menu, right-click the cell that you want to modify. The following table lists all the actions.
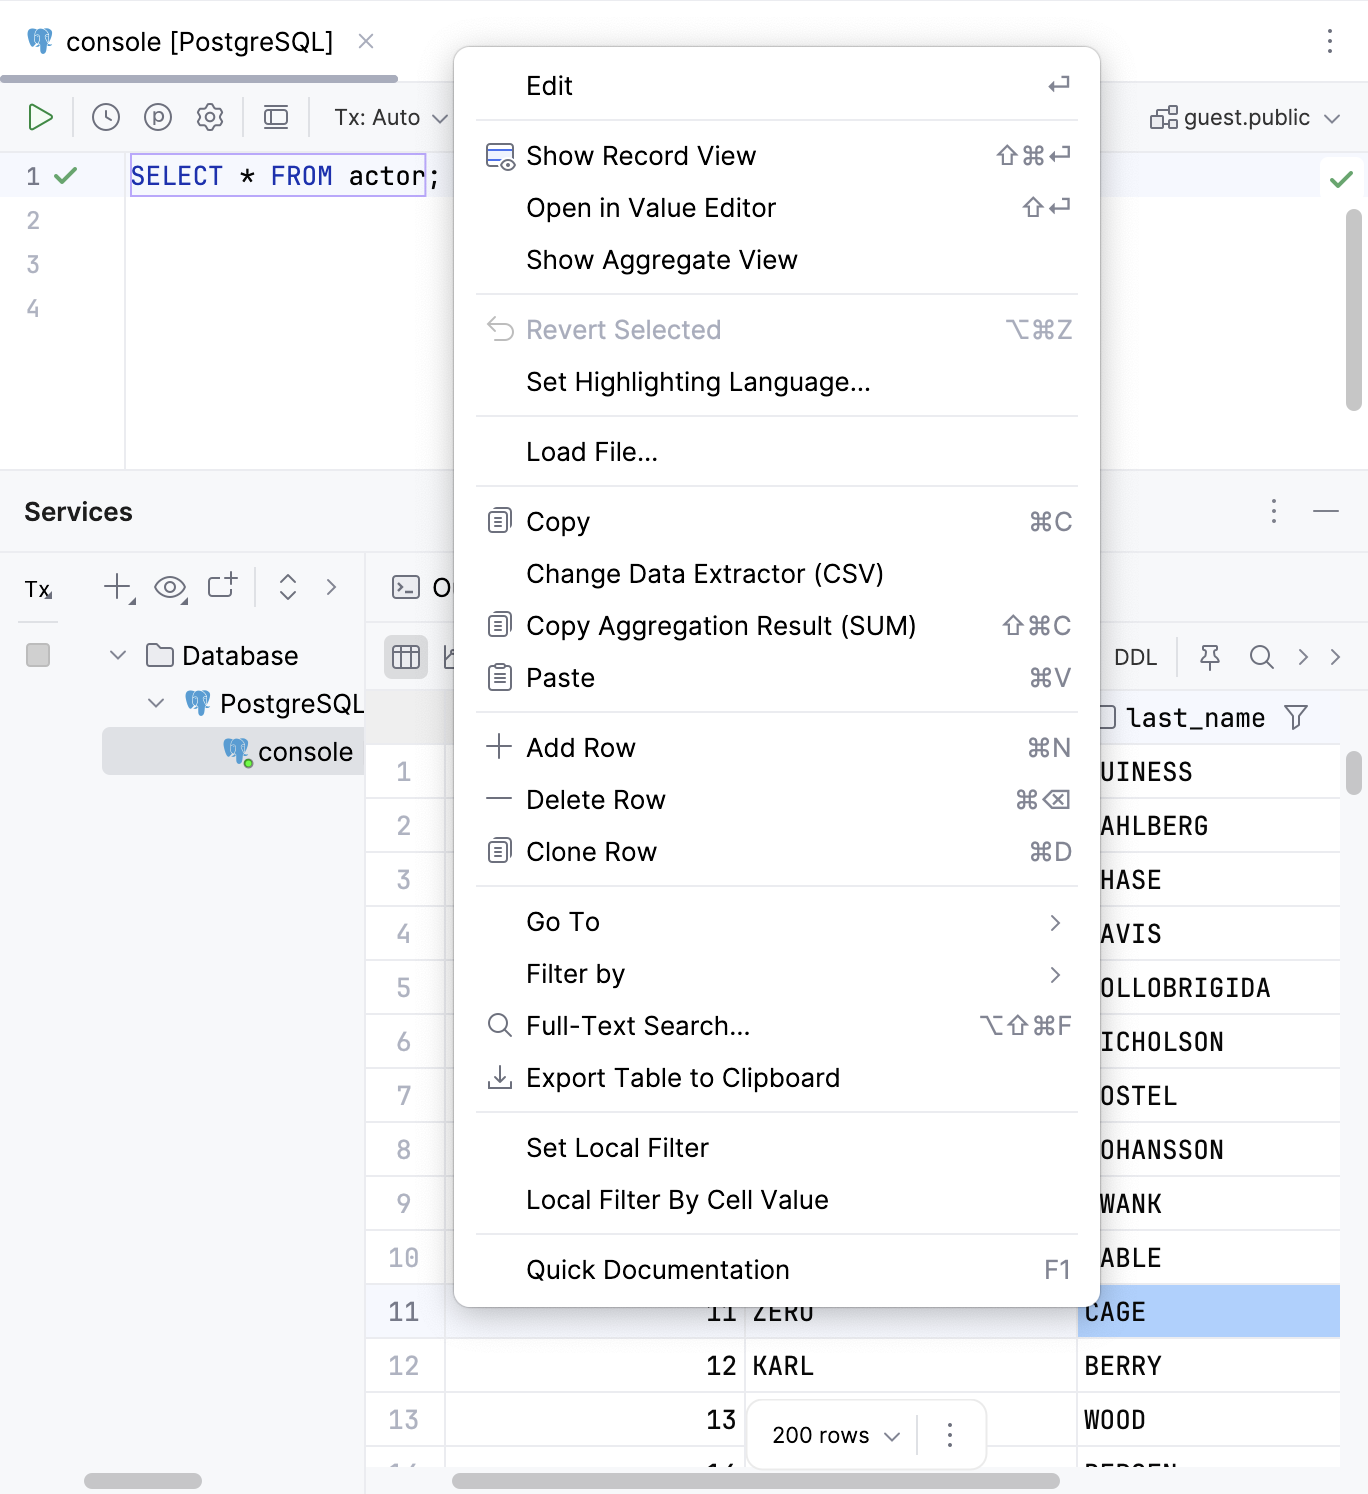
Action | Shortcut | Description | |
|---|---|---|---|
Edit | Enter | Edit a value in the selected cell or cells. Alternatively, you can double-click the cell and start typing a value. The Edit command is unavailable for read-only values.
For more information about editing cells, refer to Cells. | |
| View and edit values of a certain record in a side panel. For more information about the action, refer to the View data topic. | ||
Open in Value Editor | Shift+Enter | Open in a separate value editor where you can edit data that is stored in the cell. For more information about the editor, refer to Value editor. | |
Show Aggregate View | Open the aggregate view where you can select values of multiple cells and get a single summary value. For more information about the view, refer to Aggregate view. | ||
| Ctrl+Alt+Z | Revert changes that you made to a cell value. You can select a scope of different cells and revert values in this scope. For more information about reverting changes, refer to Submit changes to a database. | |
Set Highlighting Language | Select a language that the IDE should use to highlight data in a cell. | ||
Change Display Type | Select how the IDE should display binary data in the column. 16-byte data is displayed as UUID by default. | ||
Set DEFAULT | Ctrl+Alt+D | Set the current cell value to the default value or the value that you specified for the column. For more information about viewing or set a default value, refer to Manage default and NULL values for a cell. | |
NULL | Ctrl+Alt+N | Set the current cell value to NULL. For more information about allowing a NULL value, refer to Manage default and NULL values for a cell. | |
Generate UUID | Generates the UUID for the selected cell. | ||
Load File… | Load a file into the field. | ||
Save LOB… | For the cells that contain a binary large object (LOB). Save content of a cell into a file. | ||
| Ctrl+C | Copy selection to the clipboard. | |
Change Data Extractor | Change the data extractor currently selected from the Data Extractors list on the toolbar. | ||
| Ctrl+Shift+C | Copy a summary value for a range of cells. By default, DataGrip copies the | |
| Ctrl+V | Paste the contents of clipboard into the table. | |
| Add a row to the end of a table. | ||
| Alt+Delete | Delete selected rows. | |
| Create a duplicate of the selected row and adds the duplicate to the end of a table. | ||
Go To | Navigation Bar | Alt+Home | Jump to a navigation bar. |
Database Explorer | Alt+Shift+B | Open the selected object in the Database Explorer. | |
Related Symbol… | Ctrl+Alt+B | Navigate to one of the related objects. | |
DDL | Ctrl+Alt+B | Open an object definition (DDL). | |
Row… | Ctrl+G | Jump to a specified row. In the Go to Row dialog, specify the column and row number (use the | |
| F4 | Navigates to the related records:
If more than one record is referenced or referencing the current one, select the target record in the popup that appears. The action is not available if there are no related records. For more information about related data, refer to Navigate between related rows. For more information about action behavior options, refer to Advanced Settings. | |
| F4 | Opens URL in OS default browser. Requires the links opening URL Click Settings enabled in the Database | Data Editor and Viewer settings page Ctrl+Alt+S. | |
| F4 | Open file URI in OS default file browser. For example, Requires the links opening URL Click Settings enabled in the Database | Data Editor and Viewer settings page Ctrl+Alt+S. | |
Filter by | Select a filter that you want to a column. | ||
| Ctrl+Alt+Shift+F | Open a search window where you can search for data in your database or a group of databases. For more information about full-text search, refer to Full-text search in databases. | |
| Copy the whole table to the clipboard. This action does not depend on Limit page size to setting. | ||
Switch Session | Open a window to select another session or create a new one. For more information about sessions, refer to Sessions. | ||
Quick Documentation | Ctrl+Q | Show information about selected objects. For different database objects, Quick Documentation shows corresponding information. For example, for a group of cells, you will see a summary for the selection. You can preview it in a regular or in a transposed view and also see the related records by their foreign keys. | |
 Copy
 Paste
 Add Row
 Delete Row
 Clone Row
 Related Rows
 Open URL
 Open File
 Full-Text Search…
Query Plan tab
The Query Plan tab displays the execution plan generated by an Explain Plan or Explain Analyse action. For more information about generating plans and working with their tree, raw, and graphical representations, refer to Query execution plan.
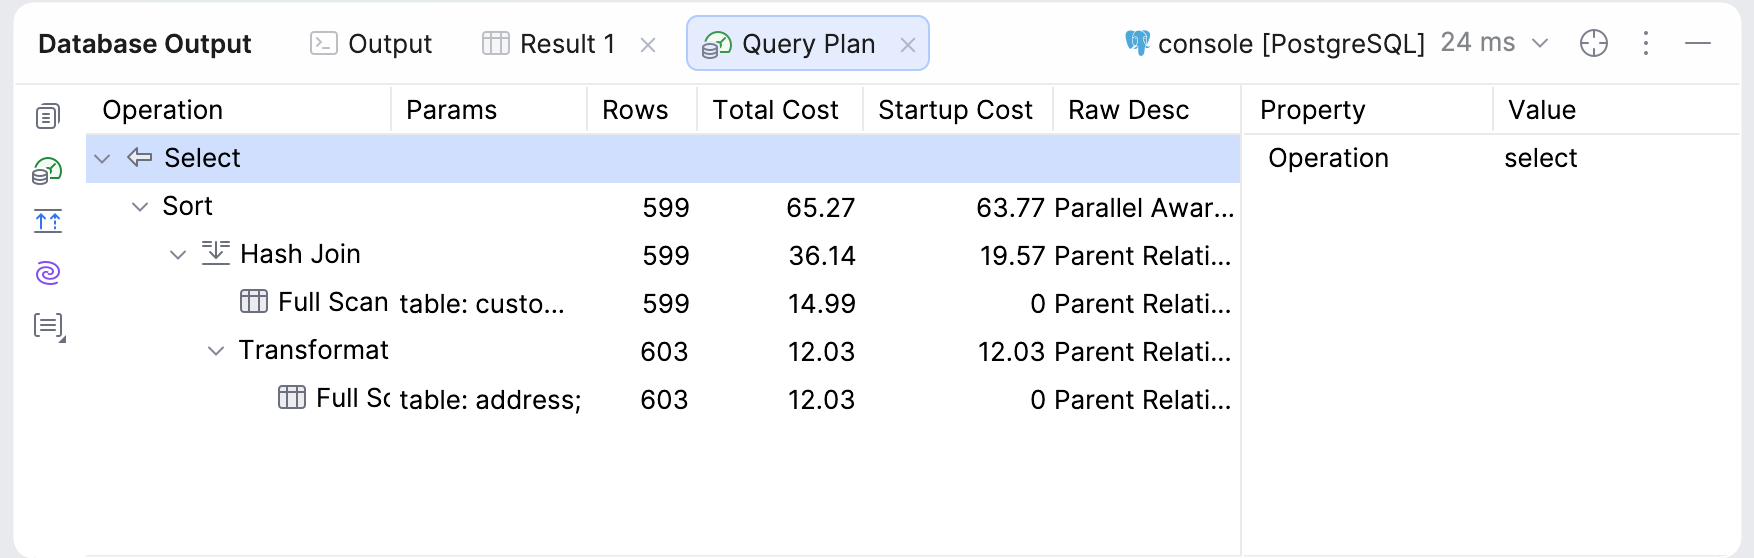
Left toolbar
Icon | Action and shortcut | Description |
|---|---|---|
| Copy Original Query Plan | Copies the query plan in the database’s native format, for example, JSON or XML. |
| Raw | Opens the raw explain plan in the Raw inner tab. |
| Show Diagram… | Opens a diagram in a separate editor tab. |
| Flame Graph | Opens one of the following graphs:
|
| Analyze SQL Plan with AI | Ask AI Assistant to explain your query plan. |


Session client dropdown
In the session clients dropdown, you can select a session client, such as a query console or SQL file, to view its output, query results, and query plans. Clients are grouped by data source. Selecting a client in this dropdown does not change the active editor tab.
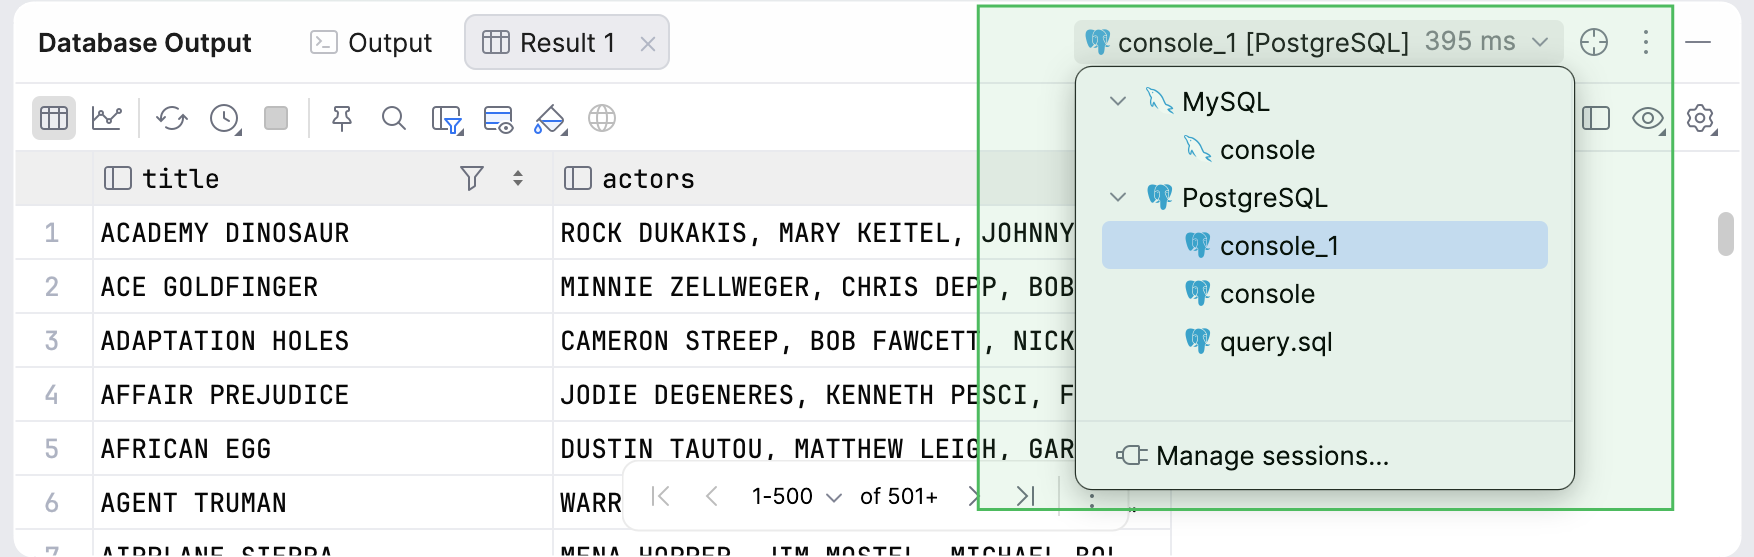
Select Manage sessions to open session details for the selected client in the Services tool window.
For more information about sessions and session clients, refer to Sessions.