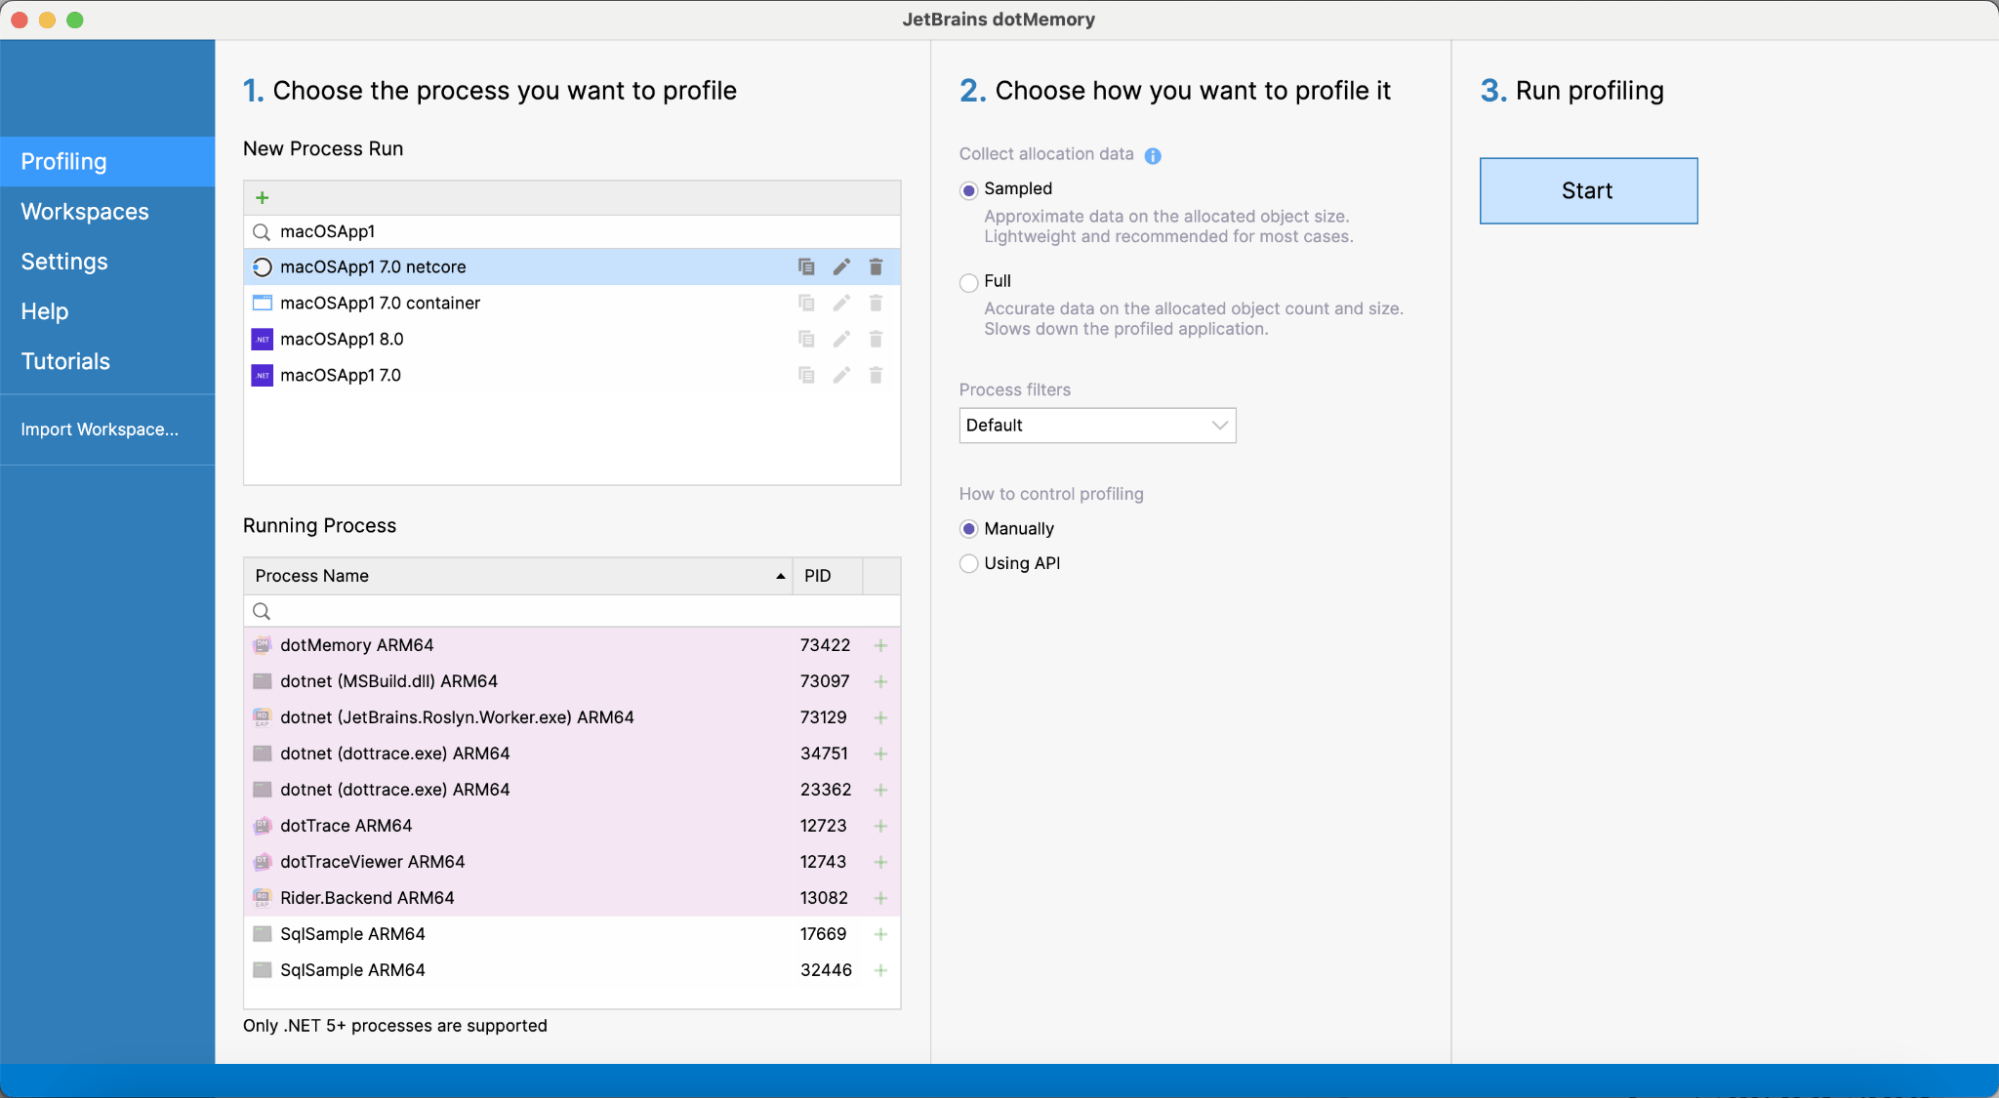
What′s New in dotMemory
This page details the latest updates and changes in dotMemory.
Reworked Monitoring tool window in JetBrains Rider 2025.2
The Monitoring tool window in Rider has been reworked to provide a more visual and integrated profiling experience. It now includes interactive charts for CPU usage, memory consumption, and garbage collection (GC) activity, giving you an at-a-glance view of your application's runtime behavior.
From the tool window, you can initiate performance or memory profiling sessions for deeper analysis in the built-in dotTrace and dotMemory profilers or their standalone counterparts. On Windows, the Monitoring tool also automatically detects performance bottlenecks, UI freezes, and GC issues. Detected problems and time intervals selected on the charts can be further investigated in dotTrace.
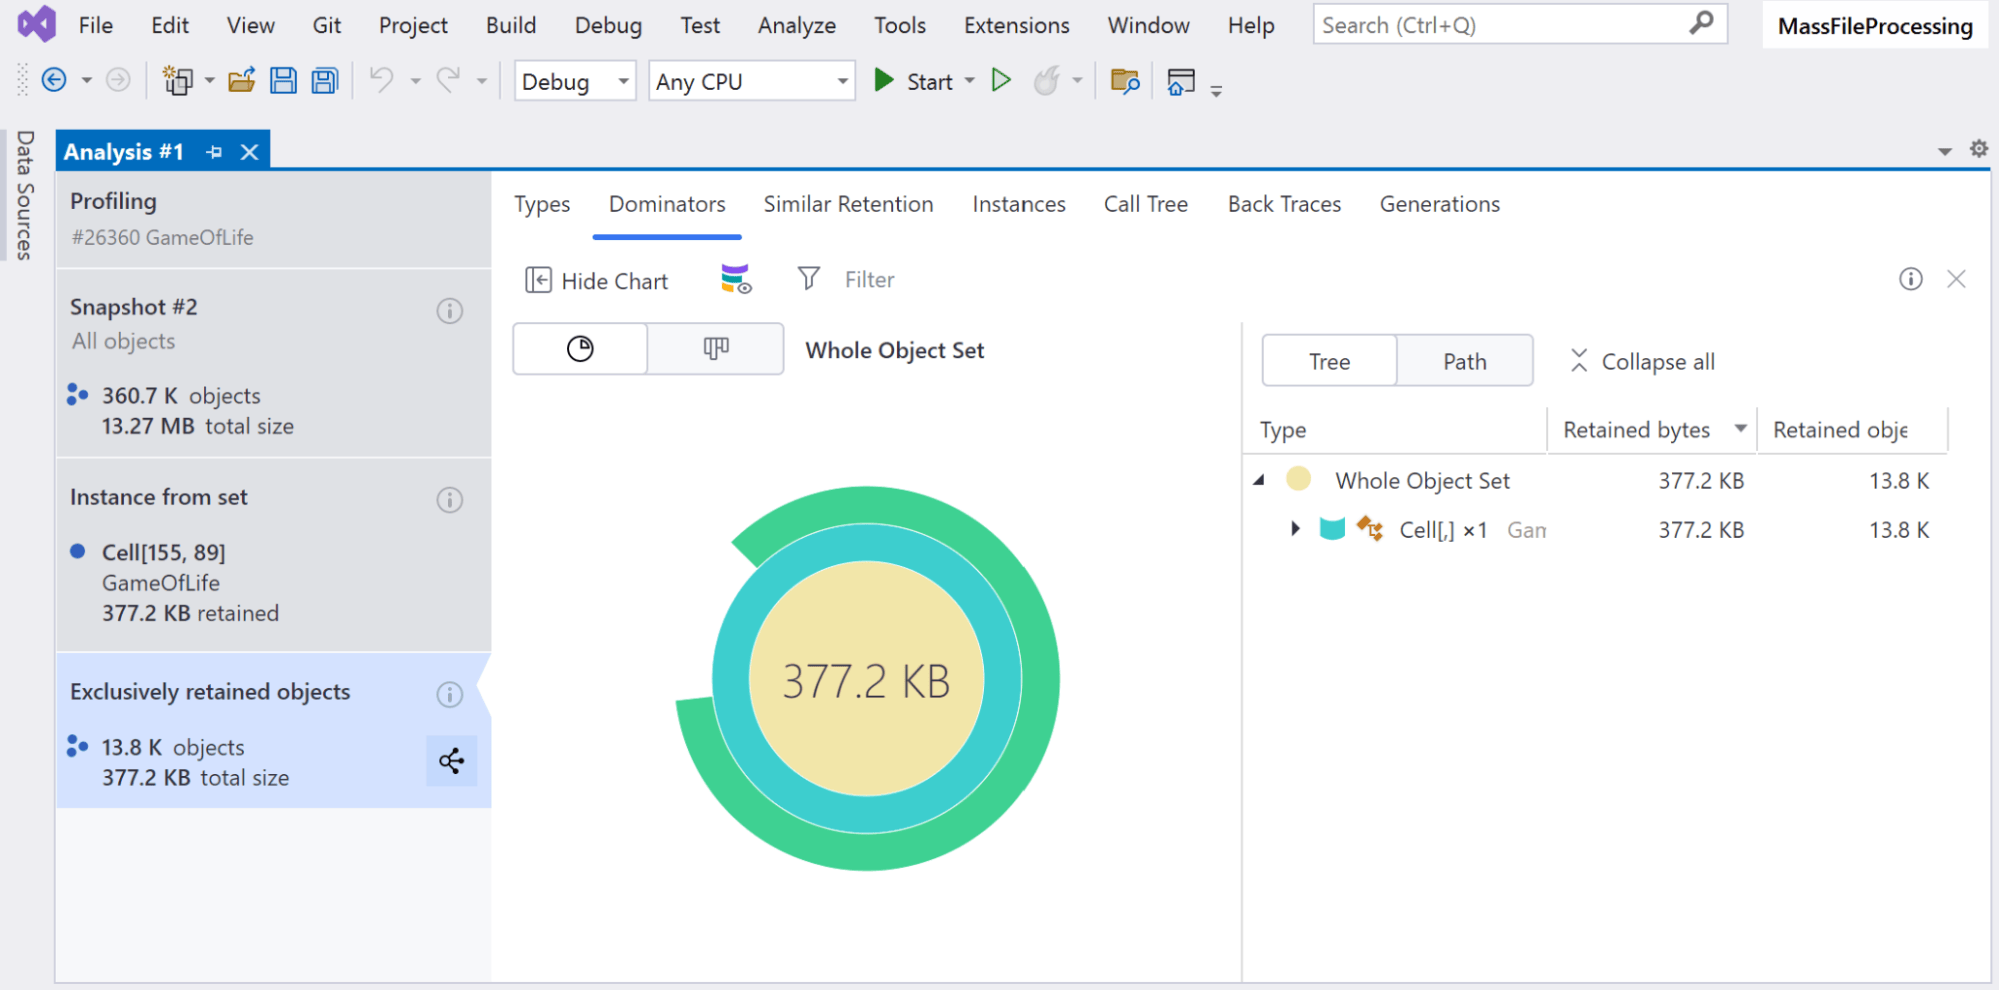
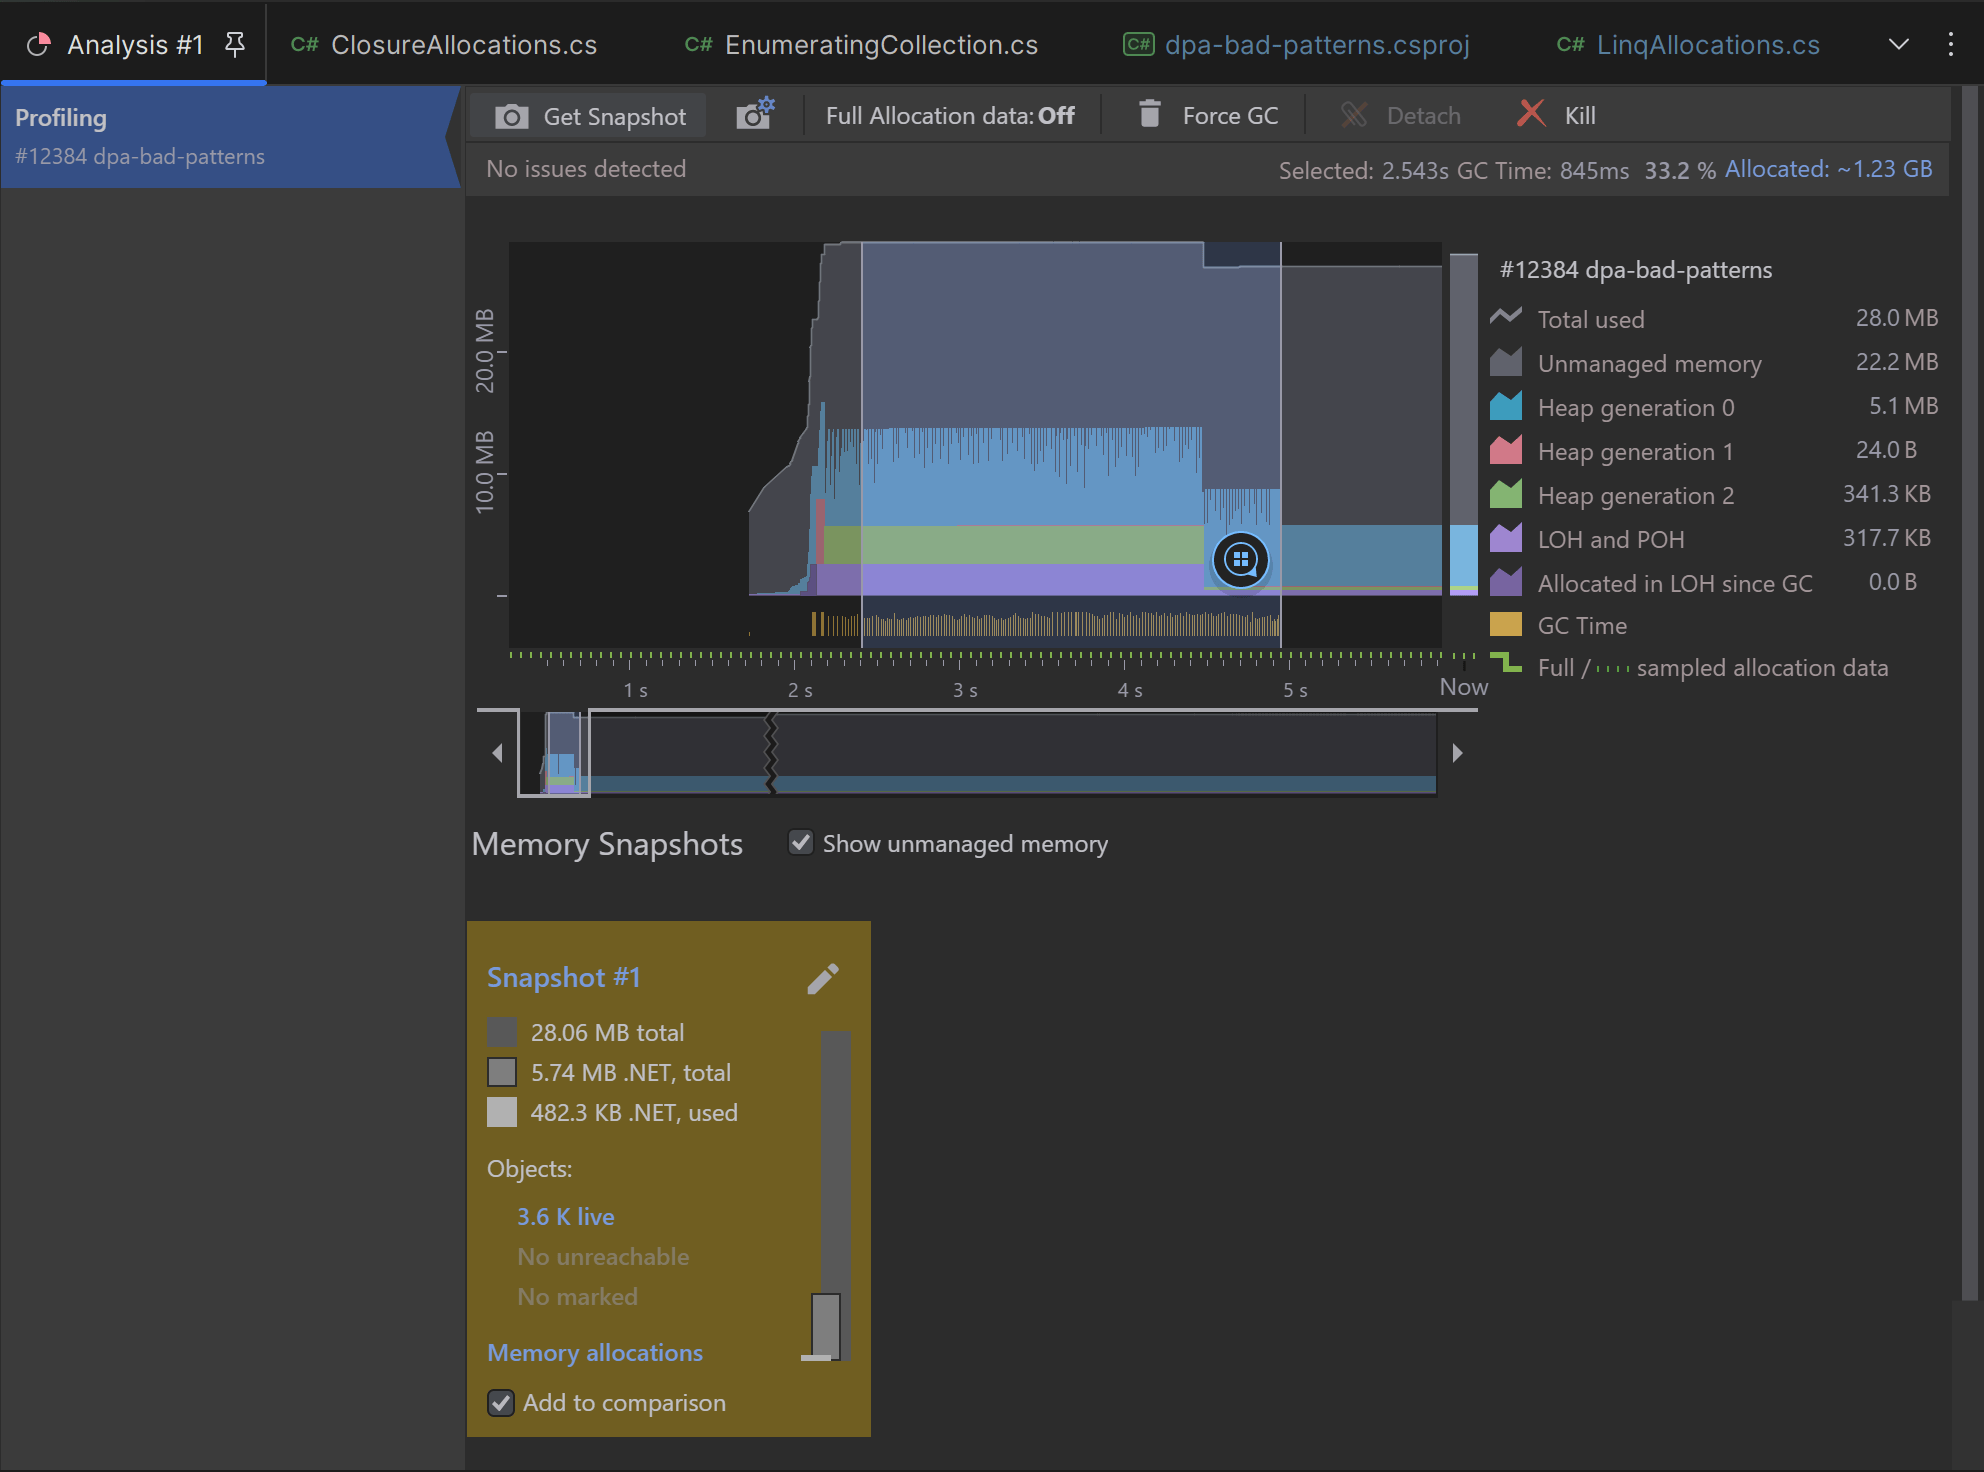
Snapshot analysis inside Visual Studio 2025.1
dotMemory is now fully integrated with Microsoft Visual Studio. Previously, you could only trigger profiling from within Visual Studio, but you had to switch to the standalone dotMemory application to analyze the results. Now, you can both profile your application and analyze memory snapshots without ever leaving the IDE.
User interface 2024.3
The 2024.3 update introduces a number of small UX/UI improvements, as well as the finishing touches that give all dotMemory versions across all operating systems a unified look and feel.
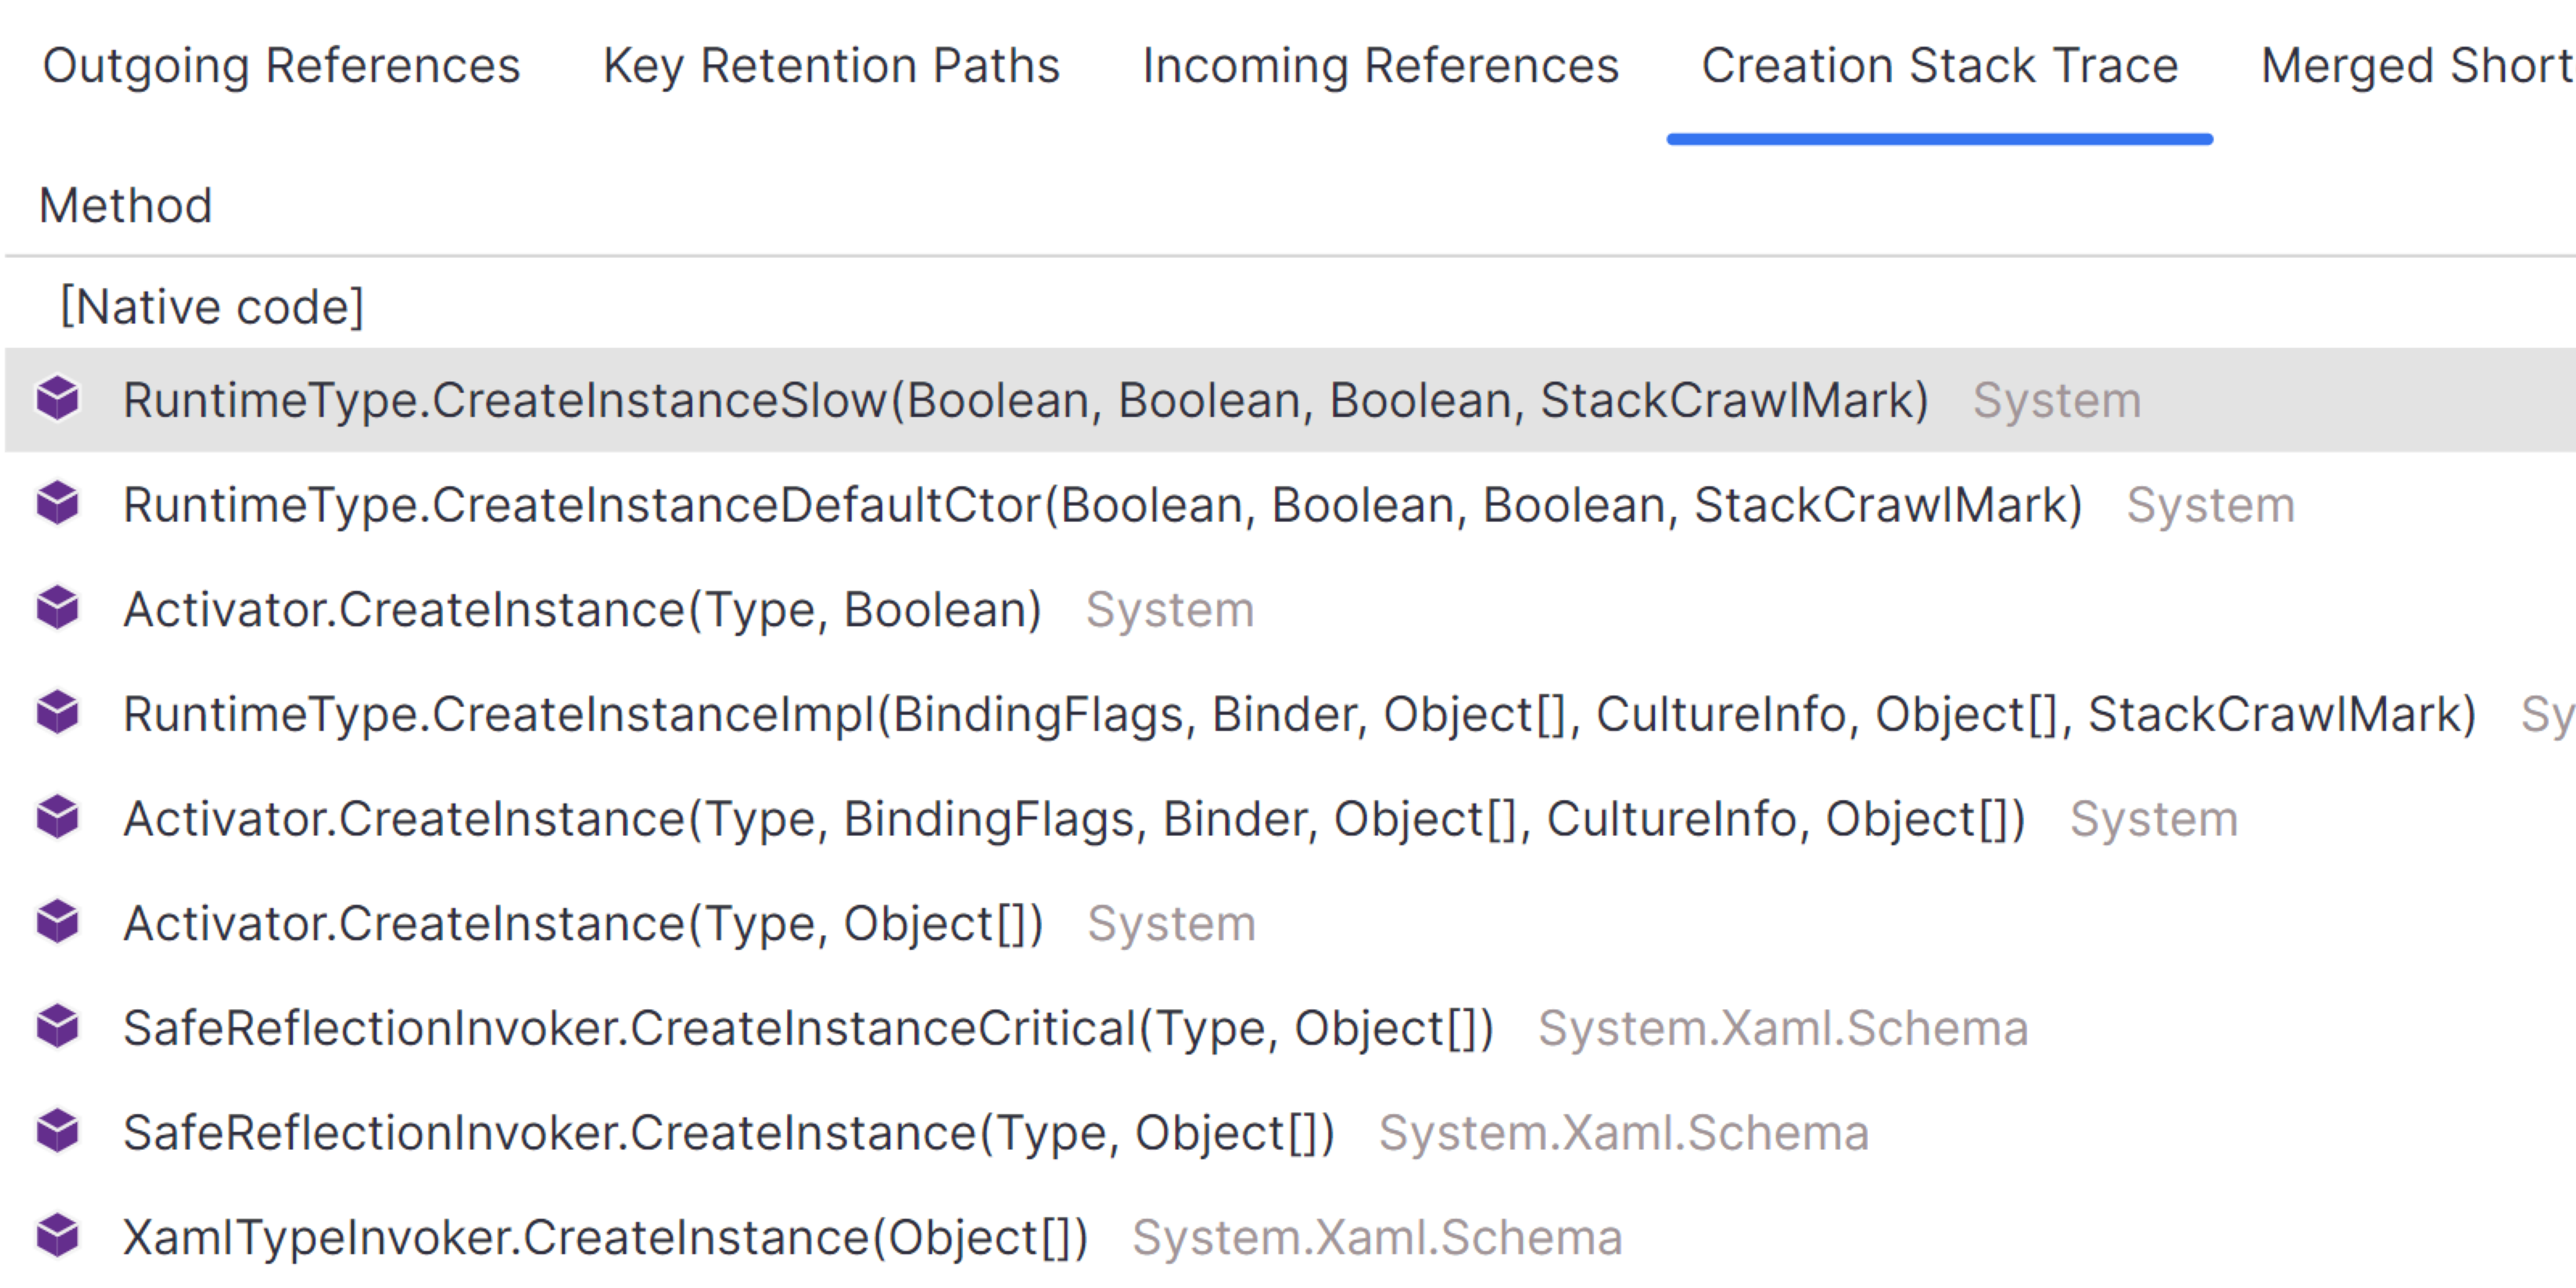
Creation Stack Trace view for object instances 2024.3
We've reintroduced the Creation Stack Trace view, which had previously been removed during the UI redesign. This view shows the function call stack that led to the creation of an object, helping you identify the root cause of memory issues more easily.
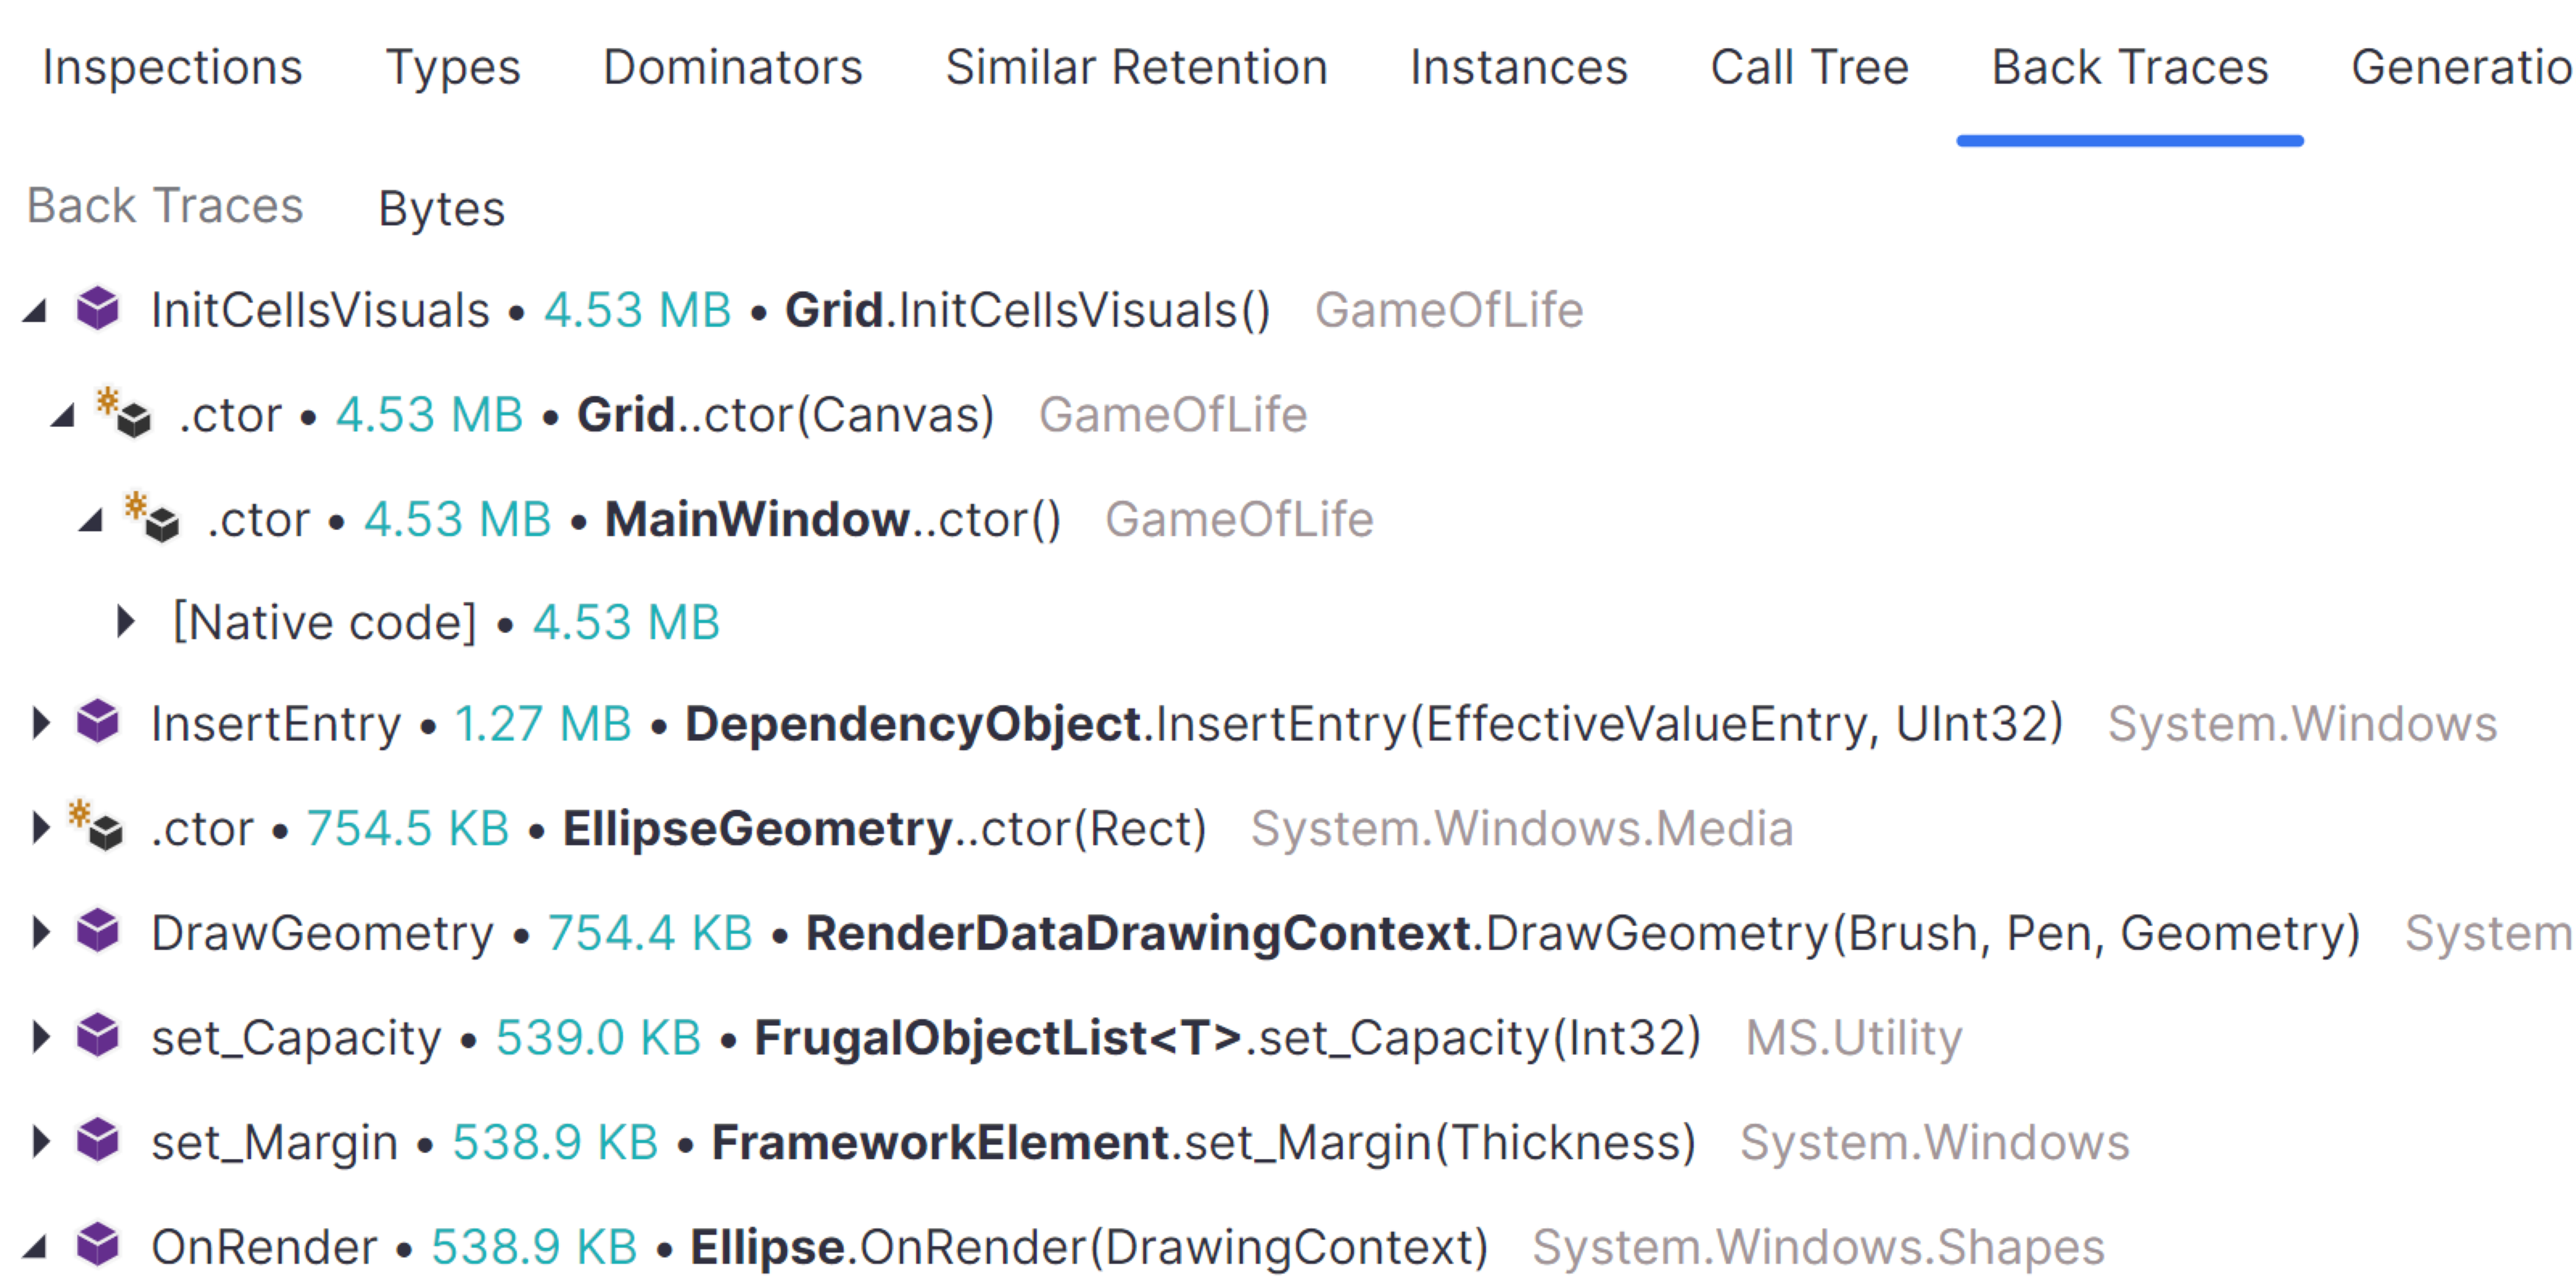
Back Traces view for object sets 2024.3
We’ve also reimplemented the Back Traces view for object sets. This inverted call tree in the view shows the call chain starting from the function that created a particular set of objects, moving from the bottom to the top.
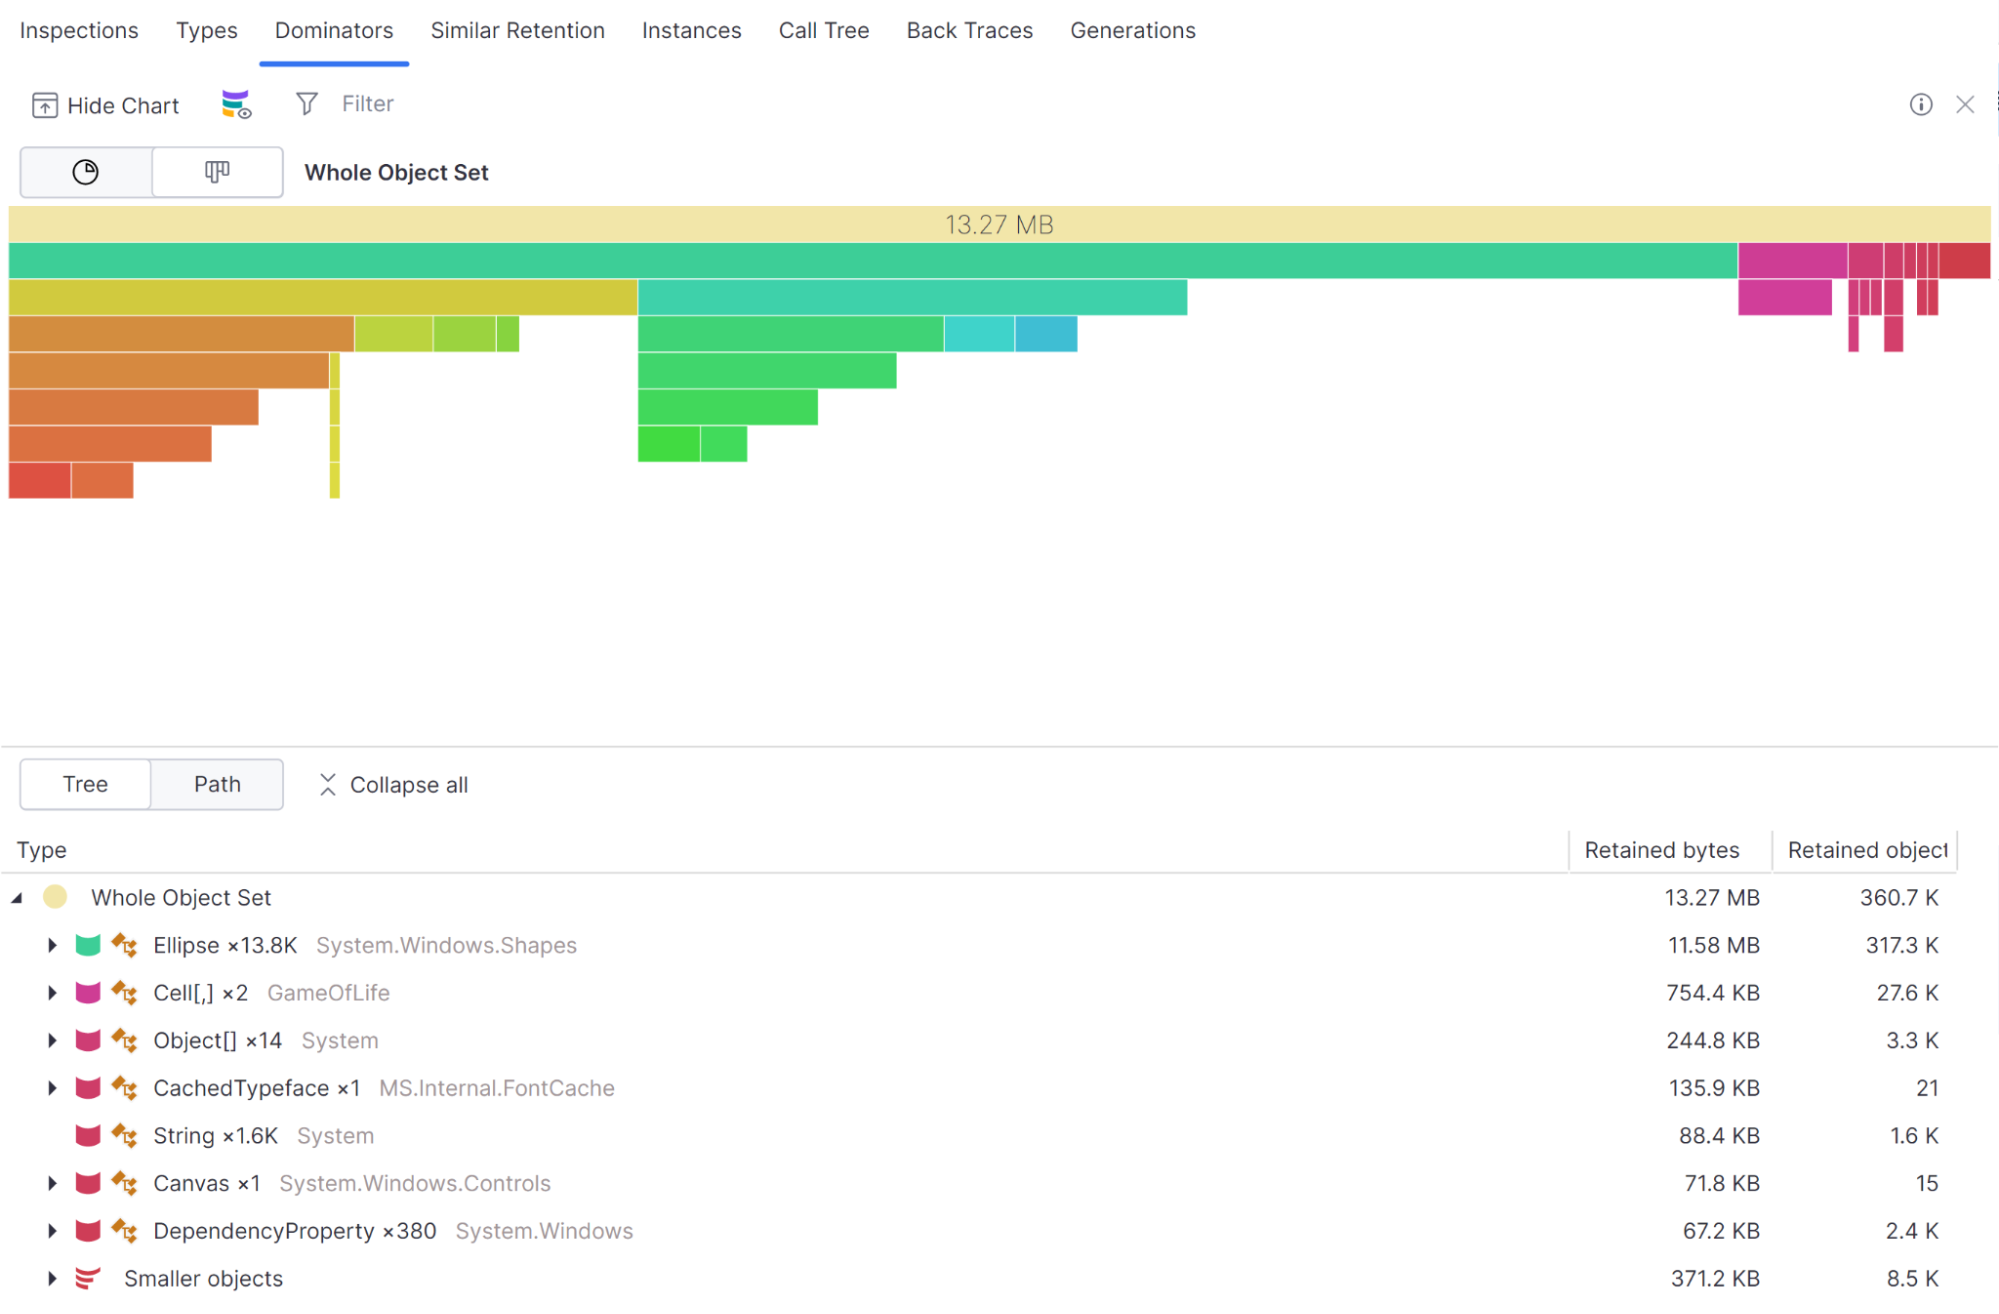
Ability to visualize dominators with an icicle chart 2024.3
The dominator tree can now be displayed as an icicle chart, showing the memory consumption of the dominator and the retained objects. This feature is available on Windows, Linux, and macOS for both the standalone version of dotMemory and dotMemory in JetBrains Rider.
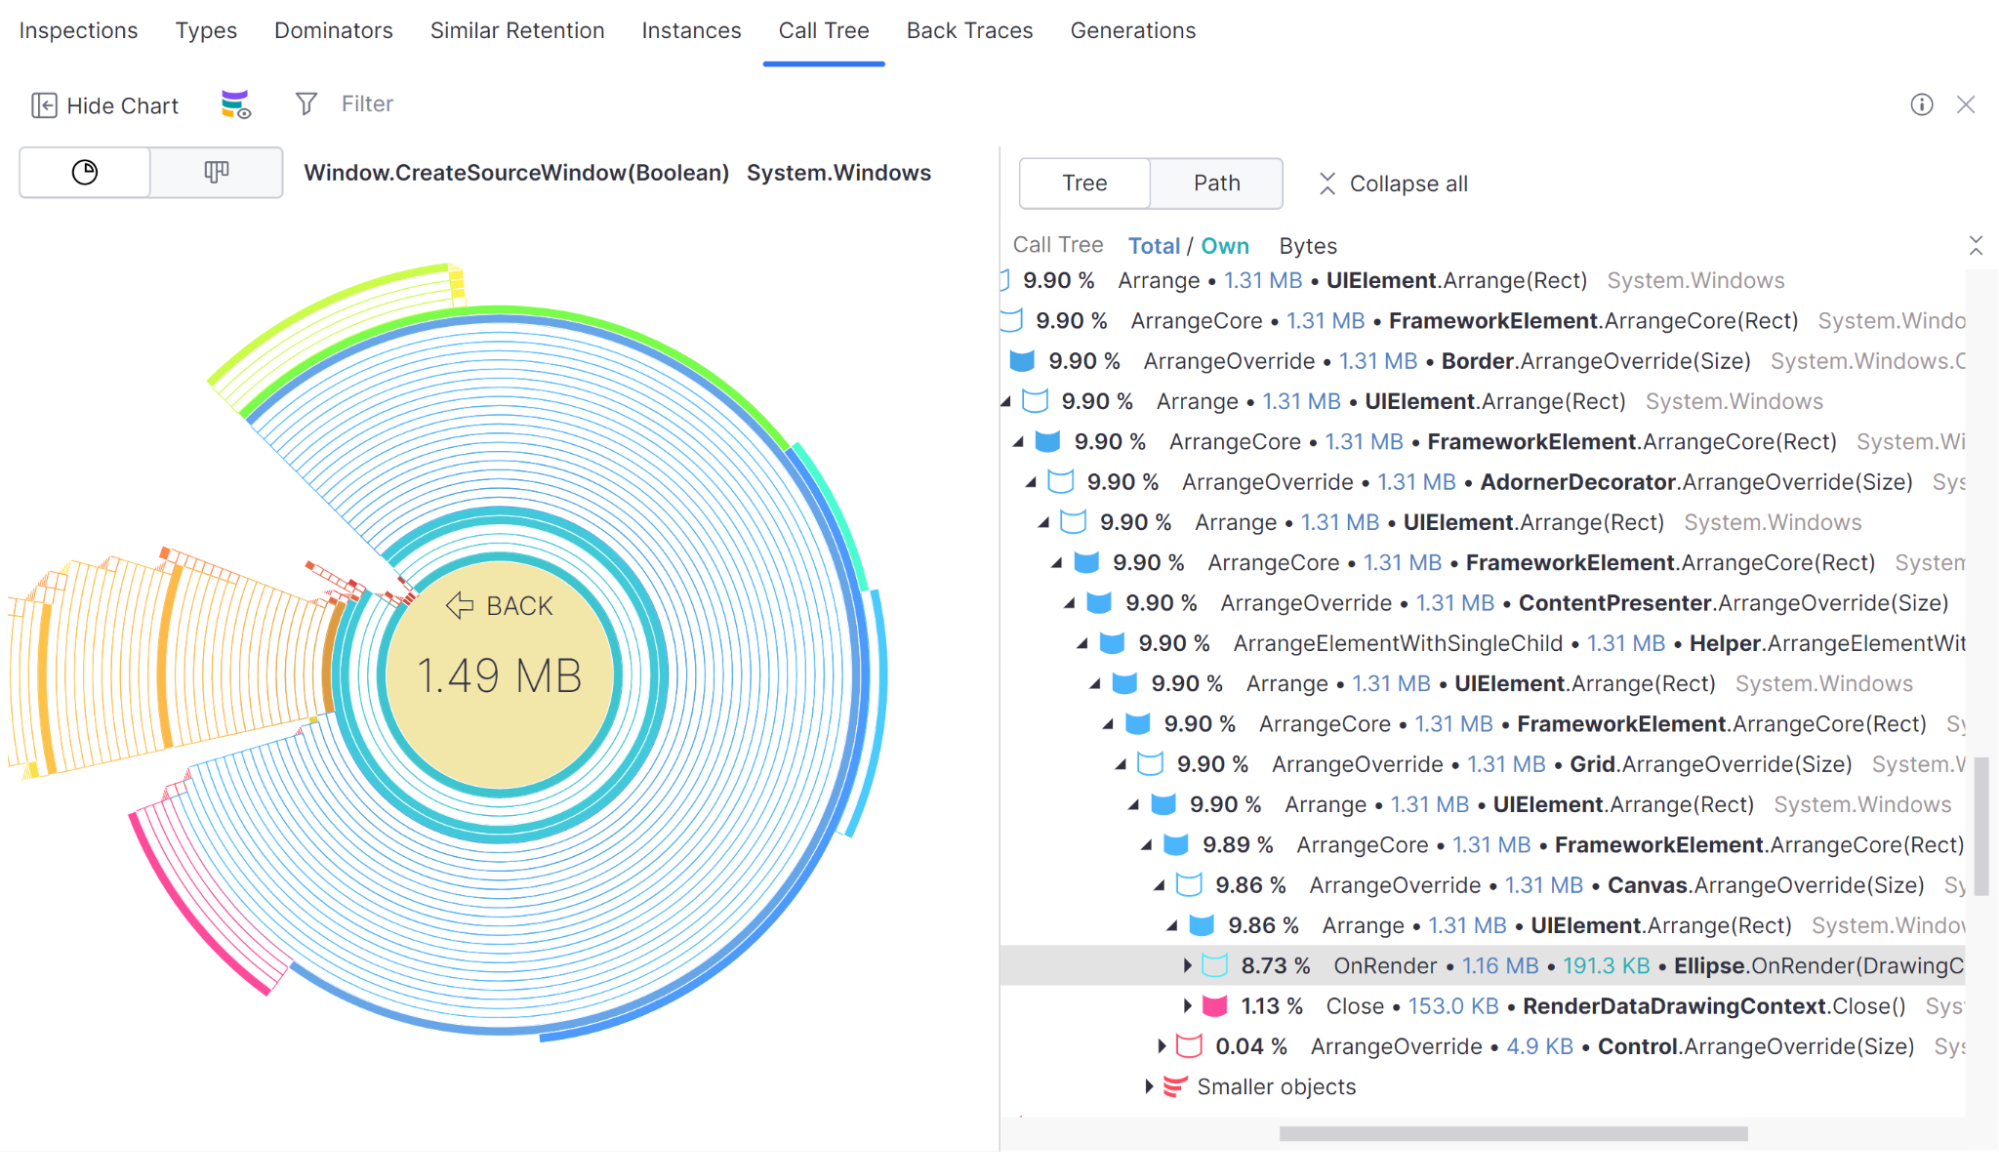
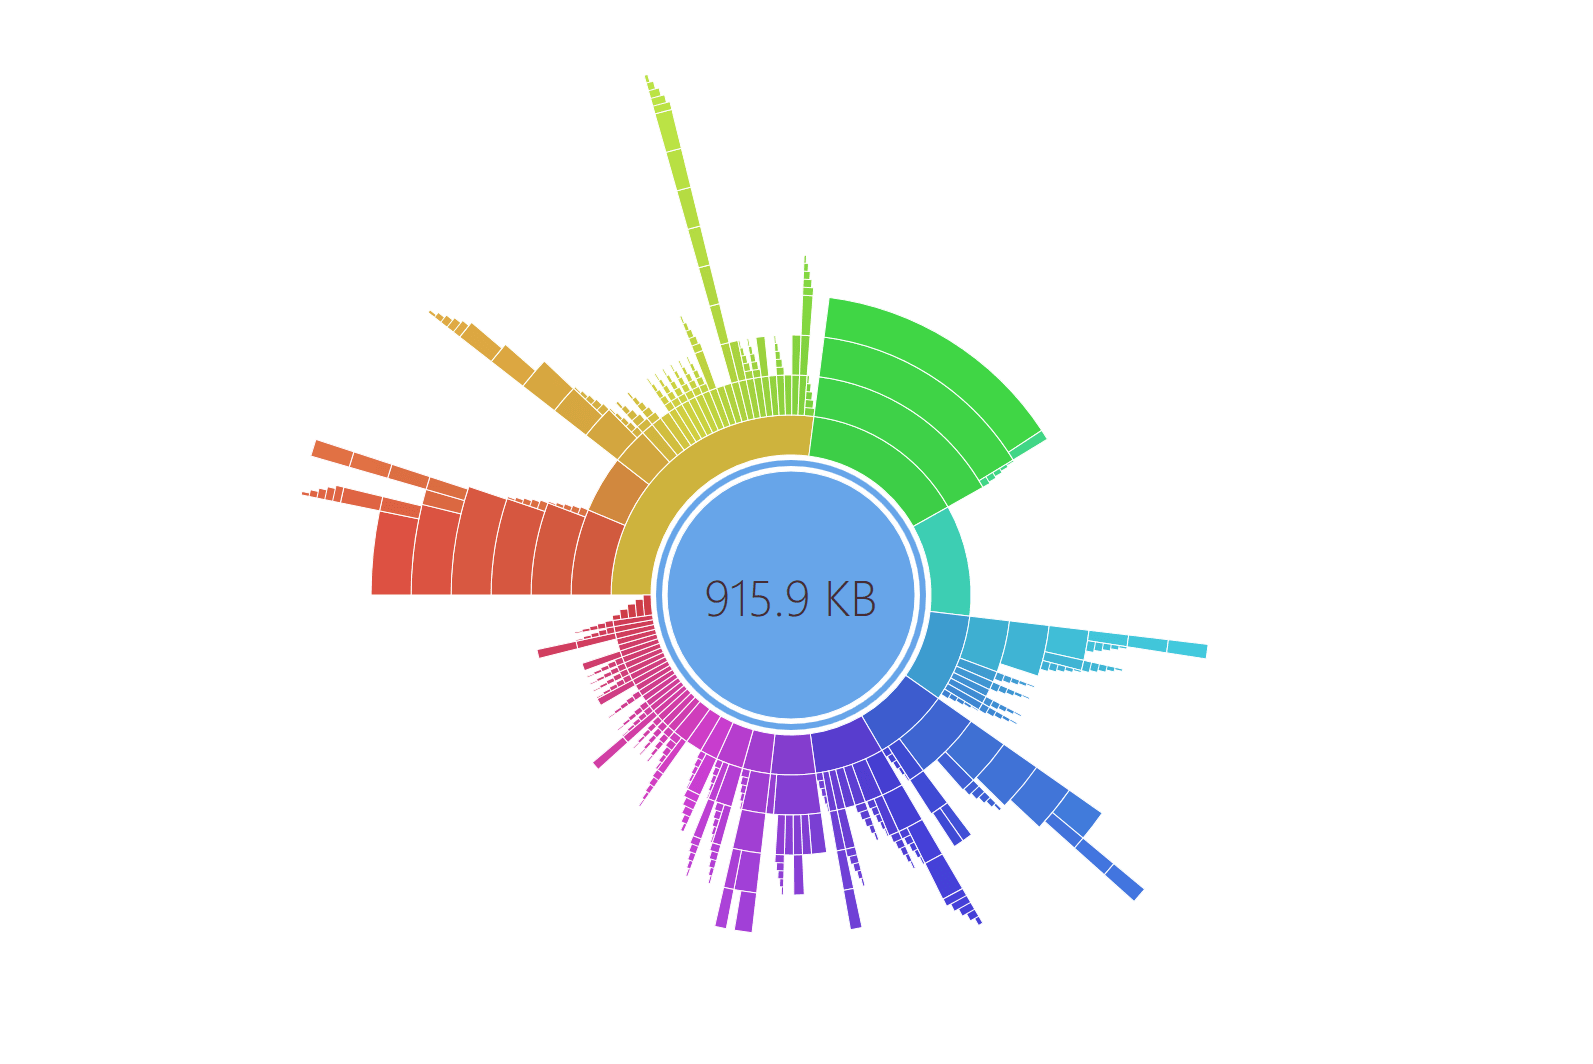
Call Tree with sunburst chart now available on all OS 2024.3
The ability to visualize a Call Tree as a sunburst chart, which was introduced in version 2024.2, is now available on Windows, Linux, and macOS for both the standalone version of dotMemory and dotMemory in JetBrains Rider.
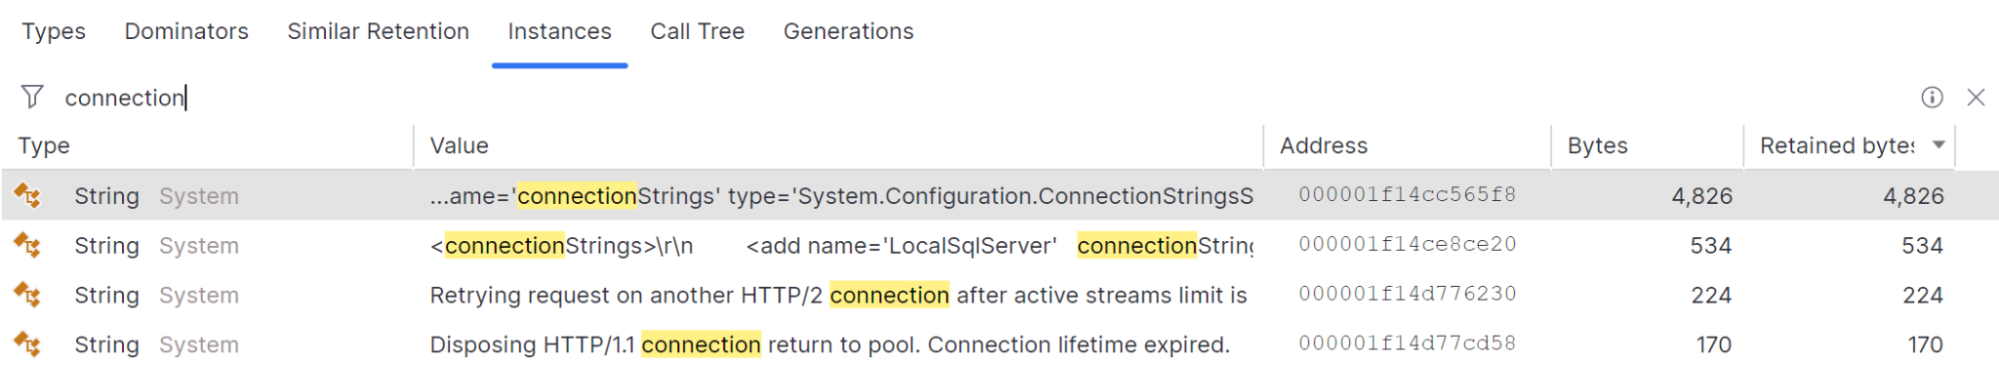
Improved instance search 2024.2
We’ve added new filtering options to the Instancesview:
- Search by string value: Type any string value into the filter field, and dotMemory will highlight matching strings. This makes it easier to find specific string instances based on their content.
-
Regex support for string values: Use regular expressions for more advanced
searches. For example,
^nAsso.{5,}ID$matchesnAssociatedObjectID.nAssociatedObjectID. - Search by object address: You can also search for object instances by their memory address. This is useful for tracking specific objects directly.
These features are available in the standalone version of dotMemory and dotMemory in JetBrains Rider.

Improvements in dotMemory for Linux and macOS 2024.2
The dotMemory version for Linux and macOS gets features that were previously available only on Windows:
- Automatic memory inspections: dotMemory for Linux and macOS gets the Inspections view, which shows several automatically detected memory issues.
- Cross-workspace snapshot comparison: Now, you can compare snapshots from different profiling sessions.
These features are available in the standalone version of dotMemory and dotMemory in JetBrains Rider.
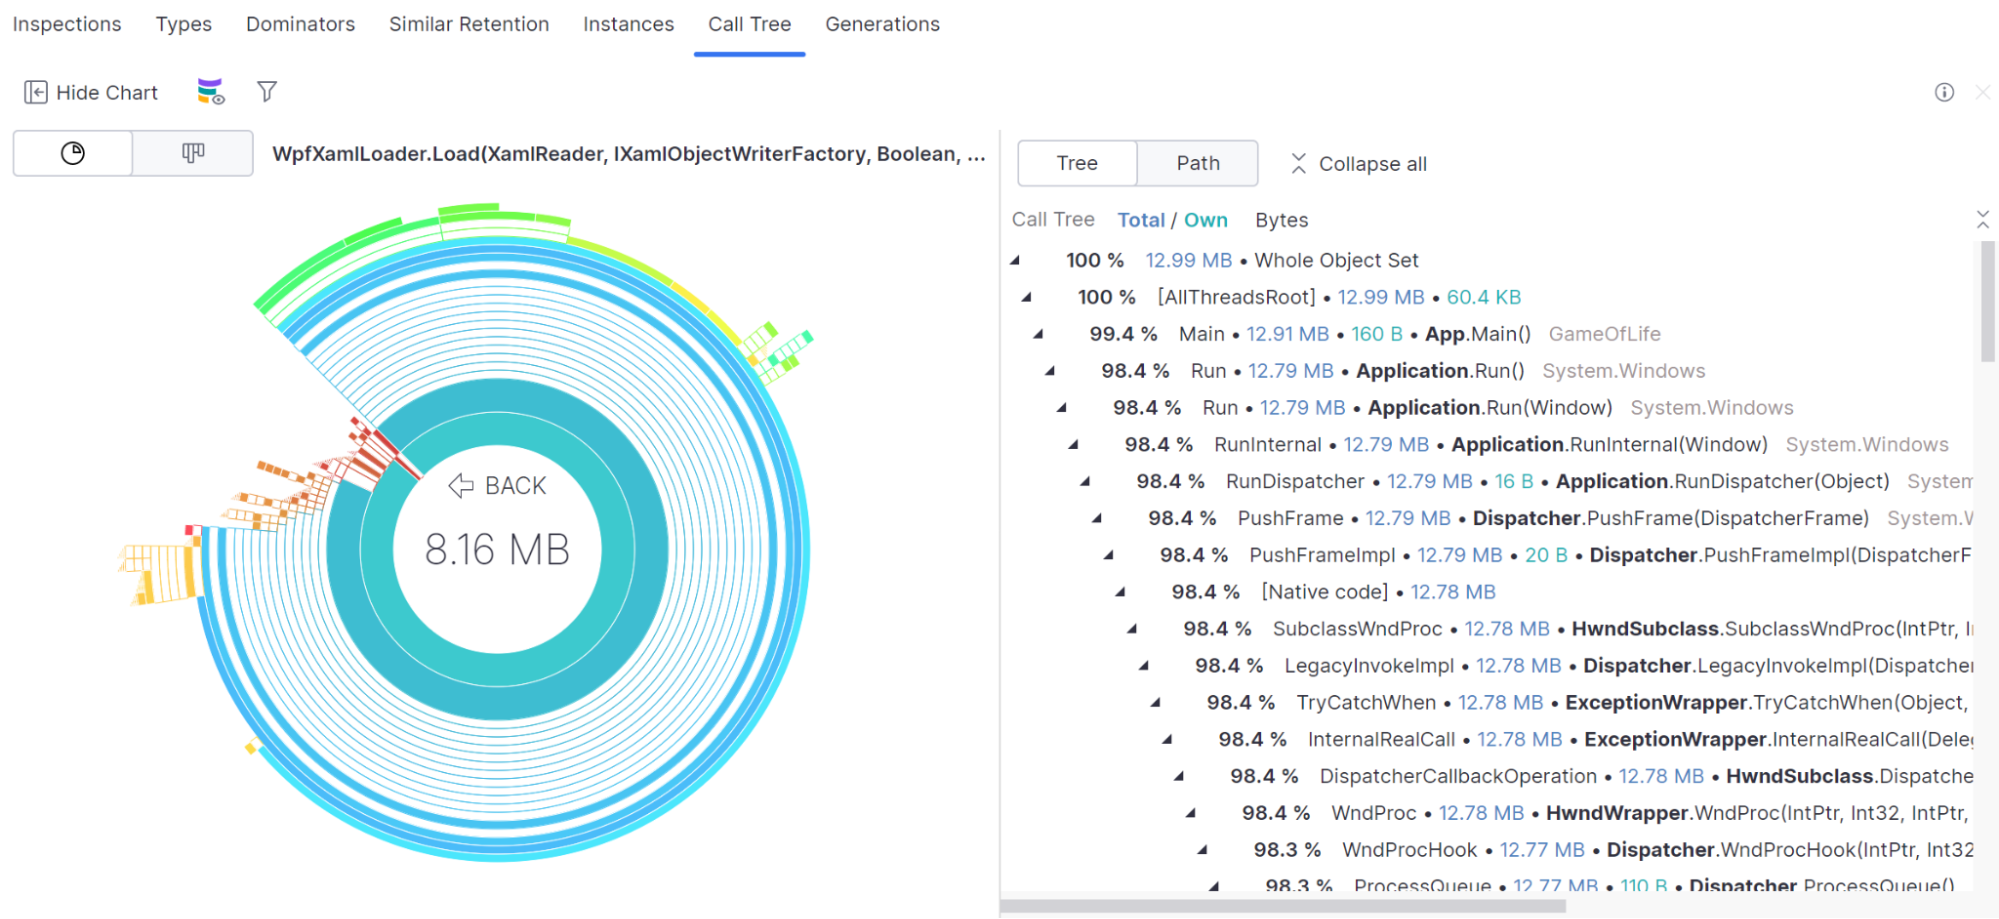
Visualize Call Tree with Sunburst chart 2024.2
The Call Tree can now be displayed as a Sunburst chart, highlighting functions that allocate the most memory. The feature is available in the standalone version of dotMemory (Linux and macOS) and dotMemory in JetBrains Rider (Windows, Linux, and macOS).
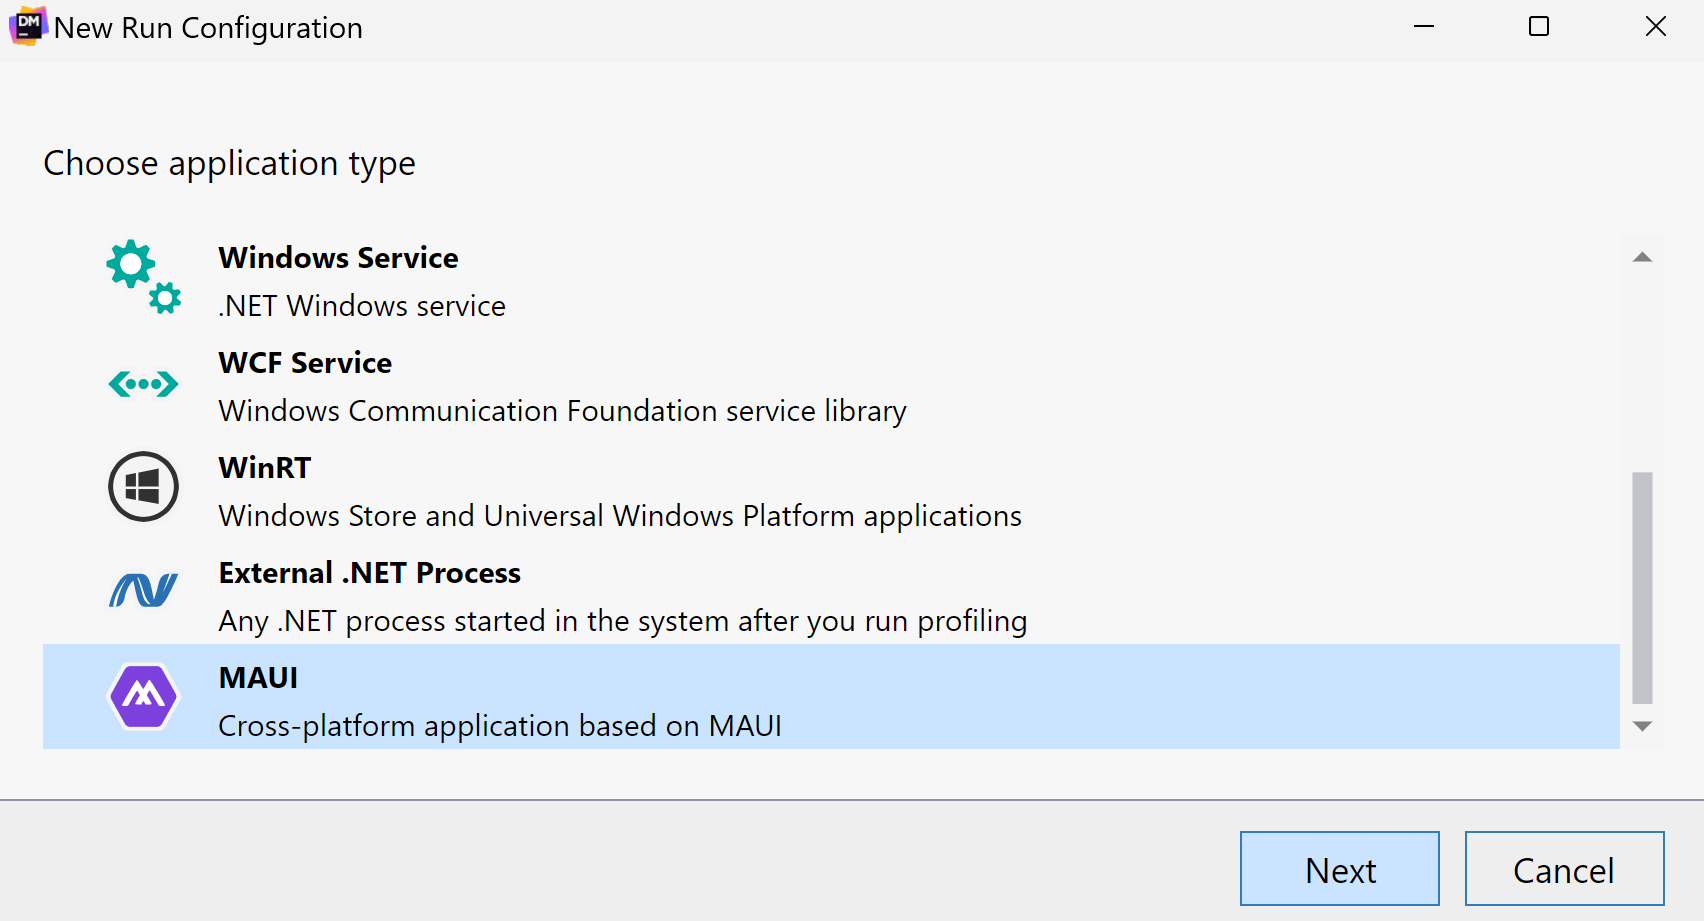
Support for MAUI applications 2024.1
Now, you can profile applications based on the MAUI framework.
Currently, dotMemory supports profiling of WinUI applications targeting .NET 7.0+ on Windows.
The support is available for dotMemory standalone and dotMemory integrated into Rider and ReSharper.
Improved support for macOS 2024.1
-
Now, the standalone version of dotMemory lets you specify application bundles
(
.app) instead of executable files. -
dotMemory in Rider can profile macOS run configurations. The following target
frameworks are supported:
net7.0-macos,net8.0-macos.
New views in dotMemory for Linux and macOS 2024.1
The standalone version of dotMemory on Linux and macOS gets closer to its Windows counterpart, offering:
- The Similar Retention view for analyzing object sets
- The Sunburst diagram for analyzing dominator objects
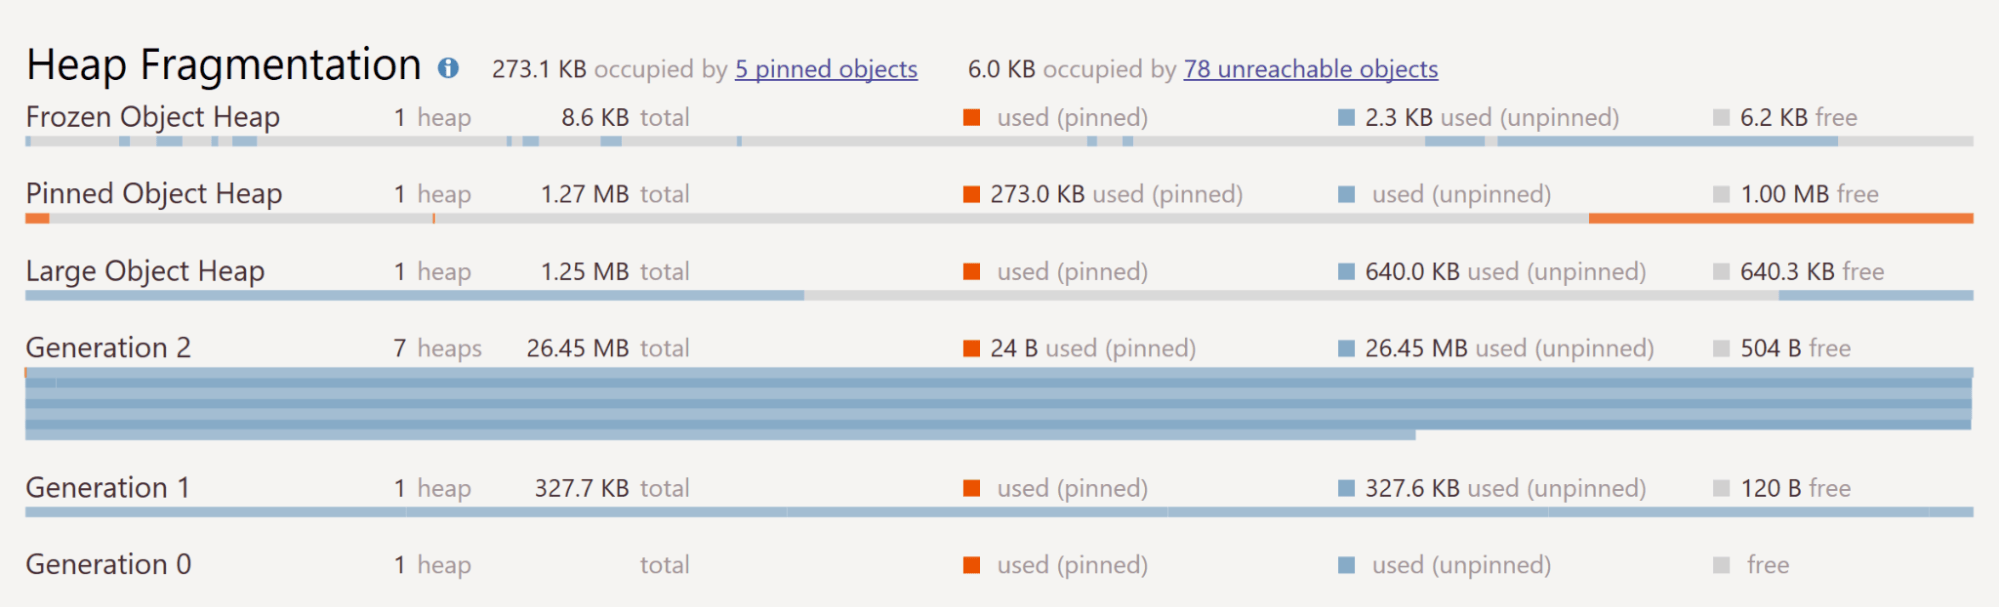
Support for Frozen Object Heap 2024.1
The information about immutable objects in the Frozen Object Heap is shown on the timeline, the Heap Fragmentation diagram, and the Generations view.
dotMemory Standalone on Linux and macOS 2023.3 Beta
Now, you can run the standalone version of dotMemory on Linux and macOS operating systems.
Analyze process dumps on Linux 2023.3
dotMemory now allows you to import and analyze process dumps as regular snapshots on Linux. Please note that the Linux version of dotMemory can only import dumps collected from processes running on the Linux OS.
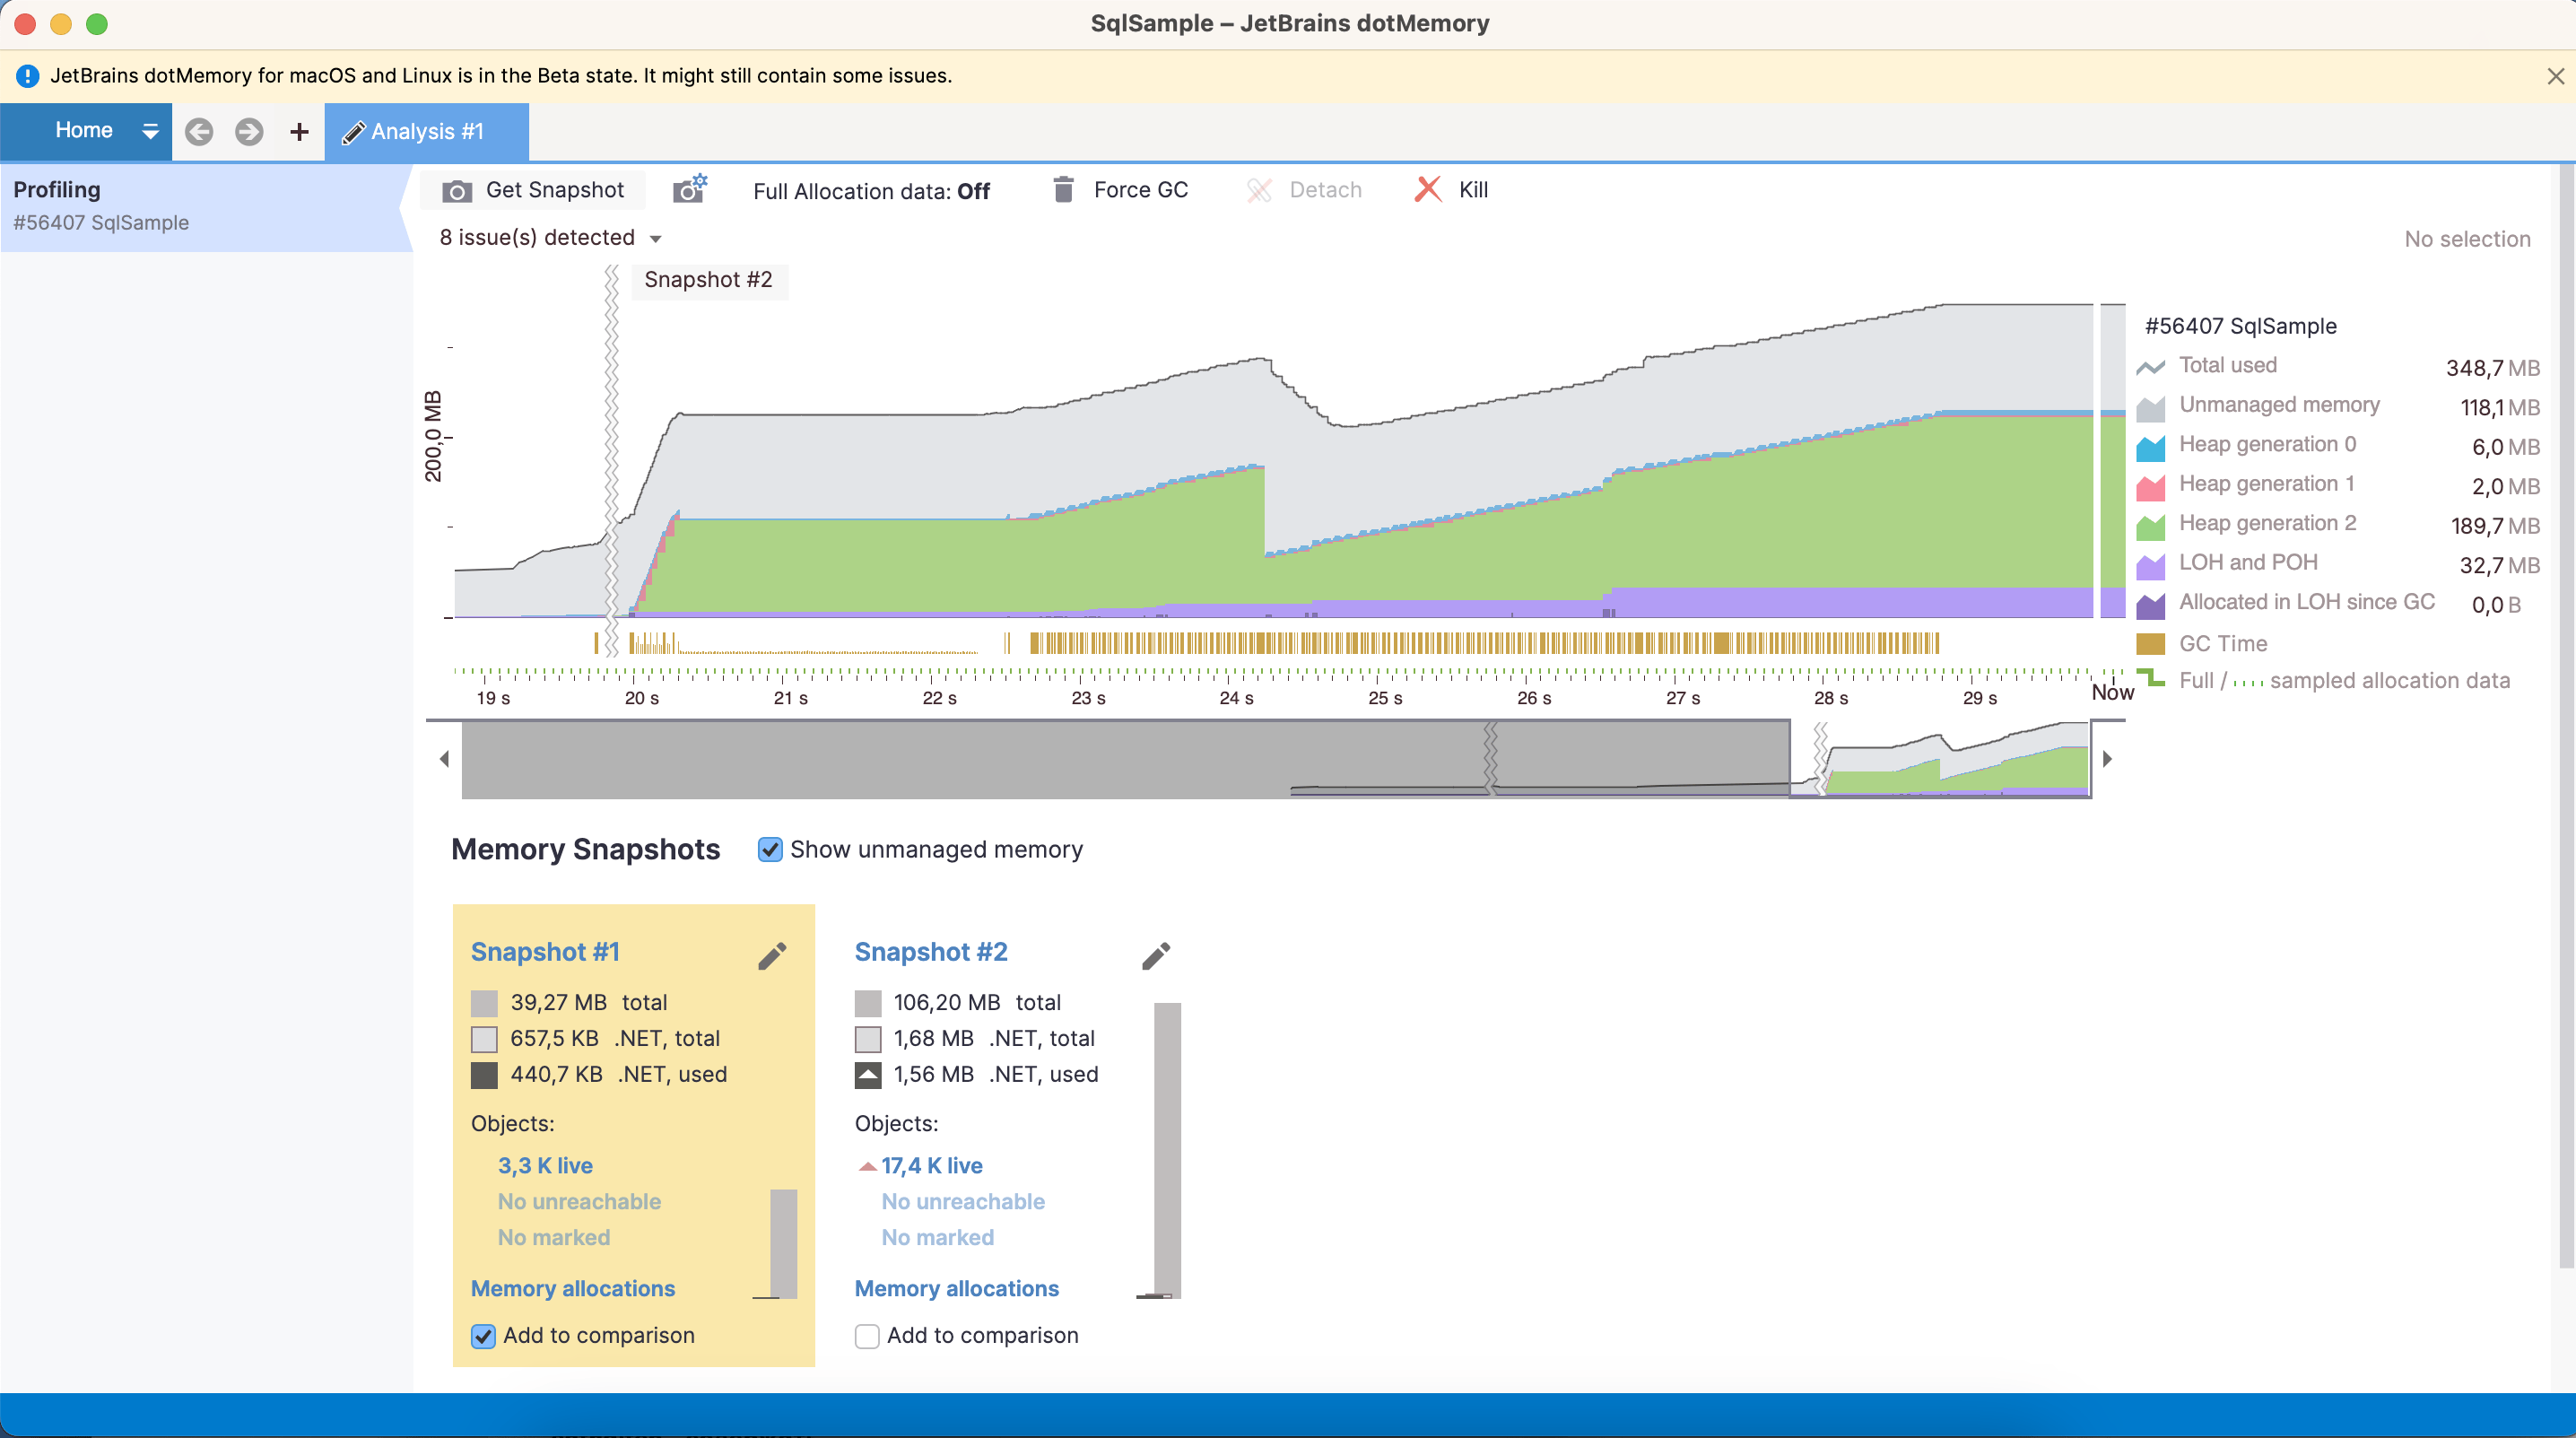
Snapshot analysis in JetBrains Rider 2023.2
Before 2023.2, you could only use dotMemory in Rider for memory allocation analysis. In 2023.2, you can collect memory snapshots and analyze them in Rider, just like in the standalone version of dotMemory.
- Snapshot analysis is available on Windows, Linux, and macOS.
- On Windows, you can also import and analyze process dumps.
- Some features and views are not available, e.g., automatic snapshot inspections and creation stack trace views.